Content
-
Weekly Highlights
- Market Commentary
- Upside & Downside Risks


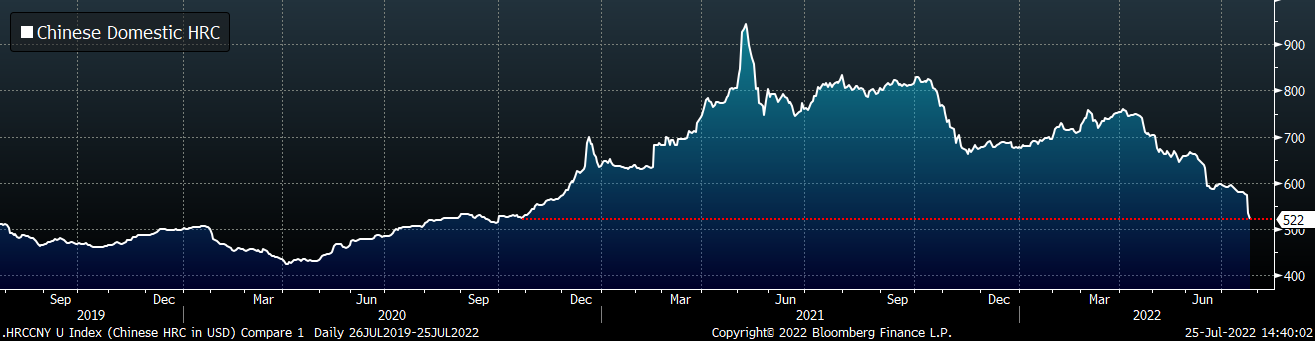
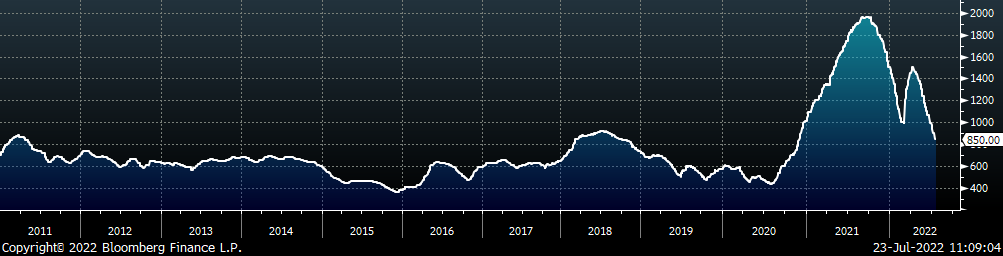
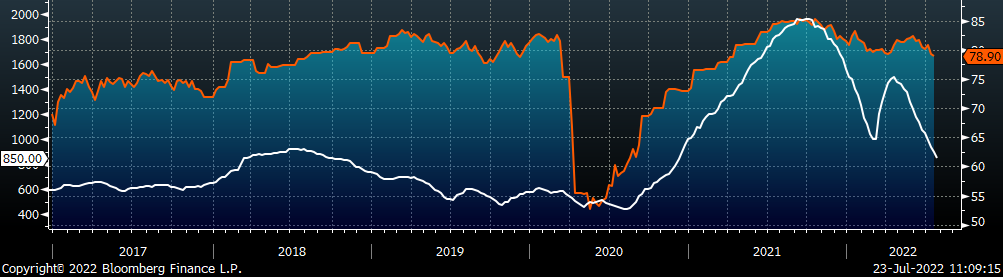
The Chinese price was among the first global HRC prices to start trending lower after the initial run up caused by the Russian invasion of Ukraine. This was primarily because it became clear that China would be a safe harbor for Russian material, but also because the COVID-zero policy which led to domestic lockdowns was bearish for their demand. The chart below shows the Chinese domestic price (translated into USD/s.ton), the current level is at its lowest since October 2020.
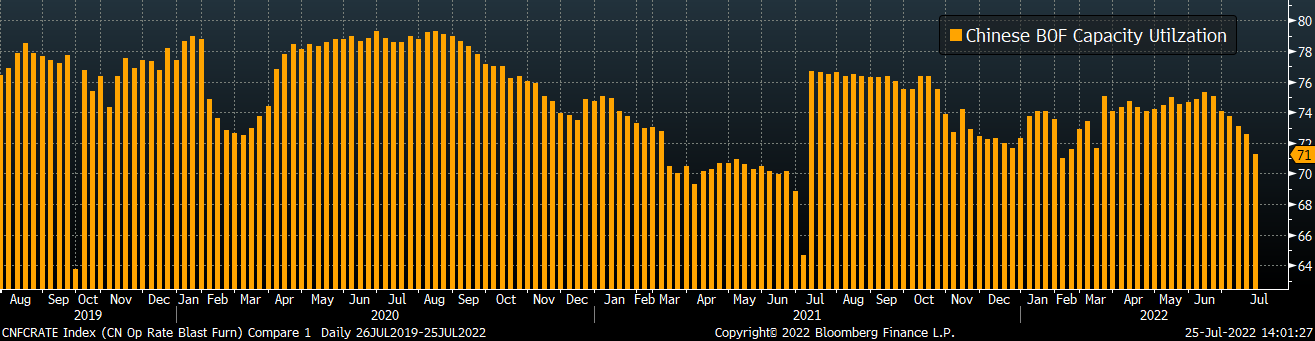
As prices initially fell, the supply side was slow to react, however, over the last couple of weeks clear trends have developed to combat lower prices. The chart below shows capacity utilization in Tangshan, the country’s most significant steel-producing city. Utilization has decreased for 6 straight weeks, and it is currently just above the recent low point in March of this year.
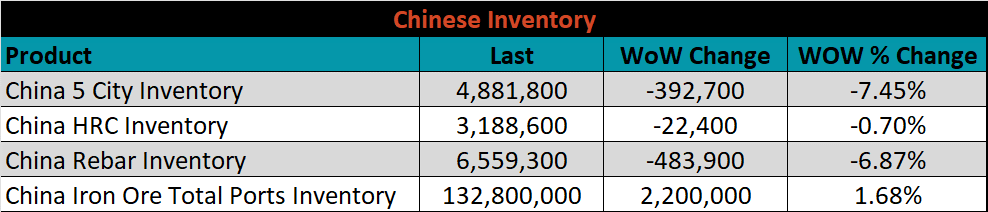
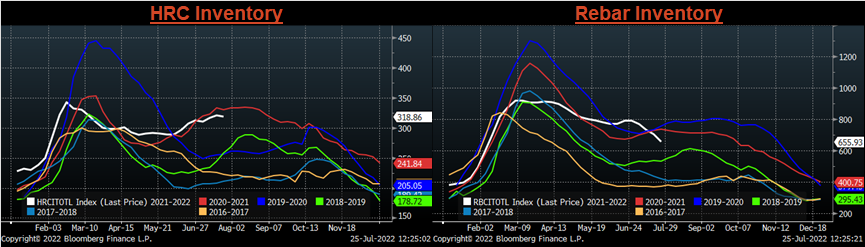
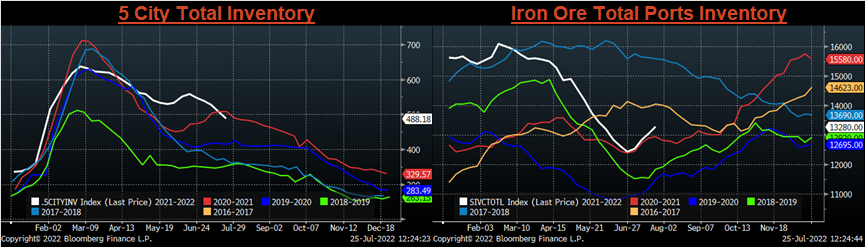
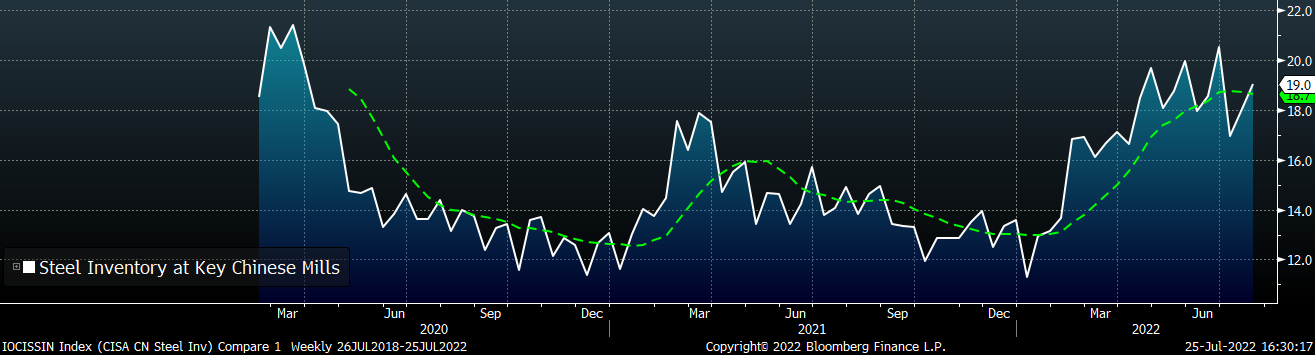
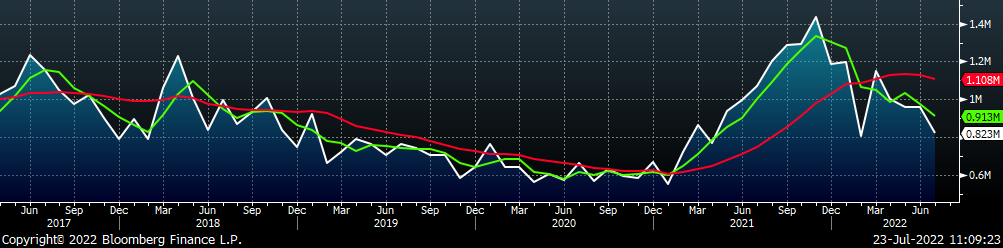
Additionally, the chart below shows inventory levels at key mills, which appear to have peaked in mid-June, with production in the region also down 7.1% compared to July of last year.
The sustained lockdowns and property slump are the most severe headwinds for the Chinese steel market, however, there is no doubt that the government is fully committed to supporting this part their economy via stimulus measures. The looming question for the global market going forward is how the demand in China will respond to the recent throttle down in supply not only in China but in the rest of the world as well.
Below are the most pertinent upside and downside price risks:
Upside Risks:
Downside Risks:
The Platts TSI Daily Midwest HRC Index was down $50 to $850.
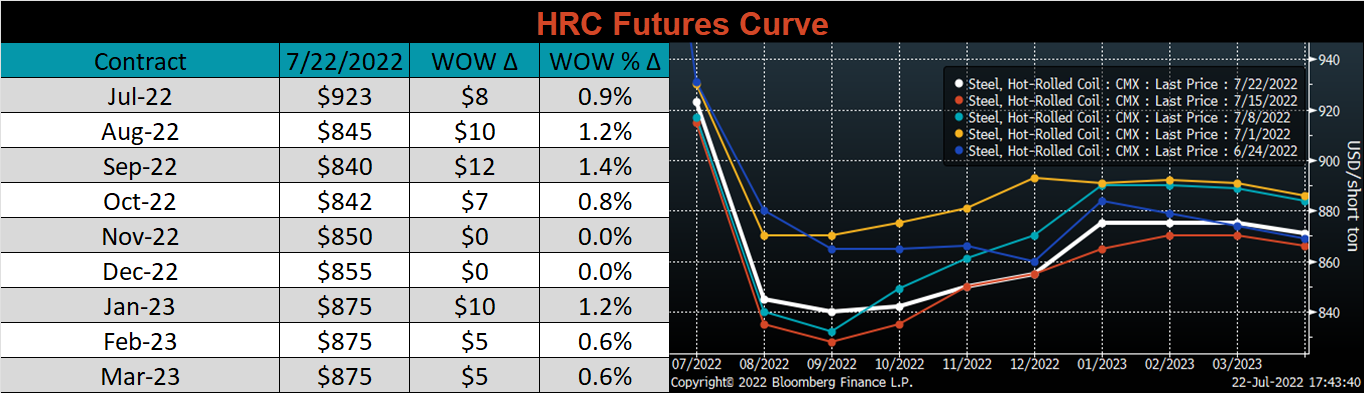
The CME Midwest HRC futures curve is above last Friday’s settlements in orange. Both the front and back end of the curve rose last week with middle months Nov-22 and Dec-22 remaining unchanged.
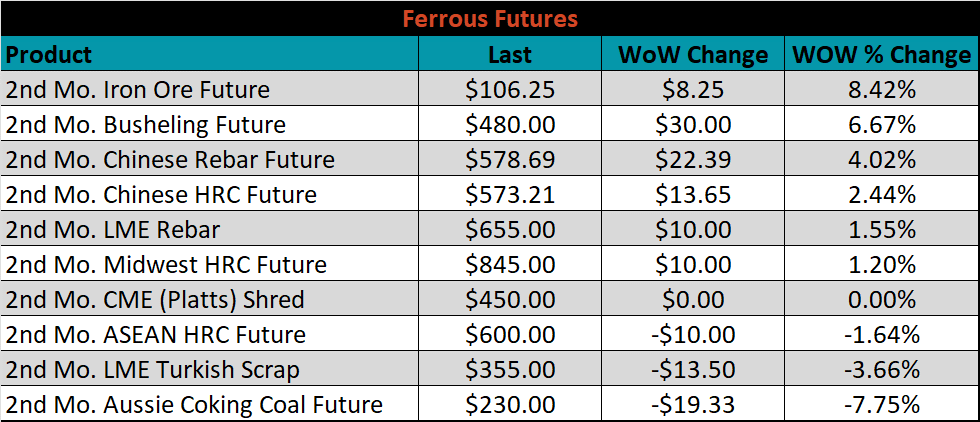
The 2nd month ferrous futures moved primarily higher last week with Iron Ore Futures surging back above $100, up 8.4%. Aussie Coking Coal Futures fell 7.8% last week.
Global flat rolled indexes moved mostly lower, led again by Chinese Spot HRC, down 8.8%, while NE TSI HRC gained 1.9%.
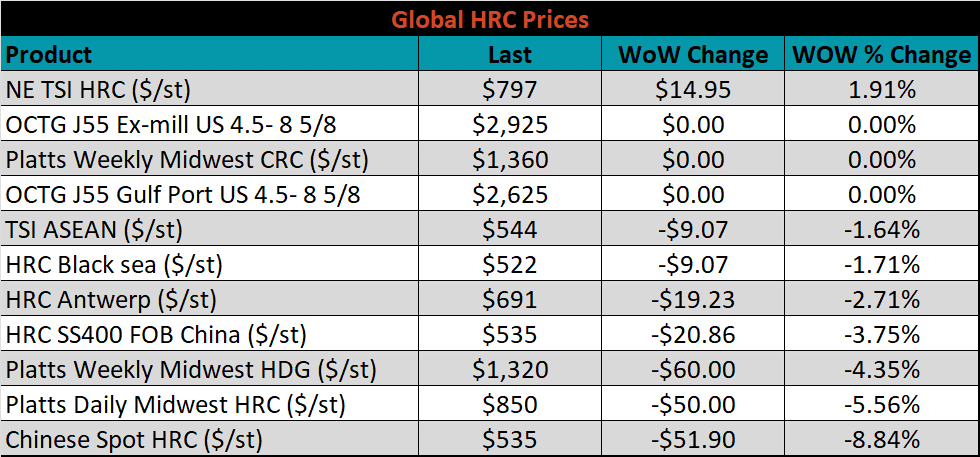
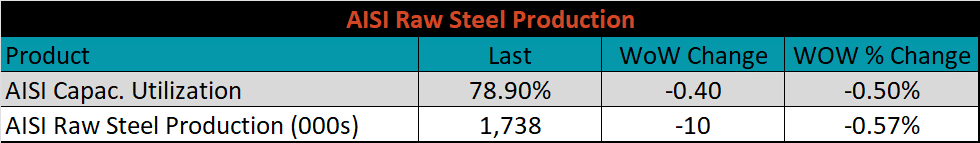
The AISI Capacity Utilization was down 0.5% to 78.9%. This is the lowest level of utilization since the initial COVID recovery, in May of 2021.
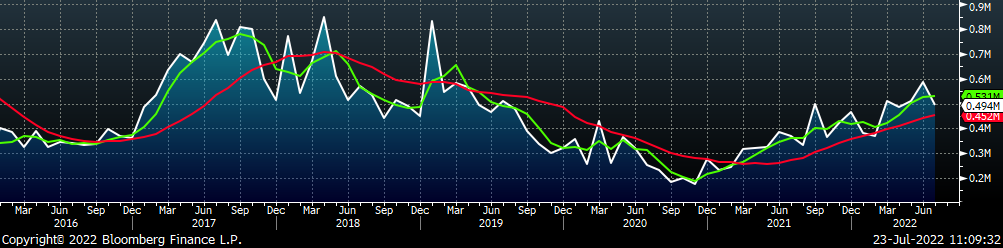
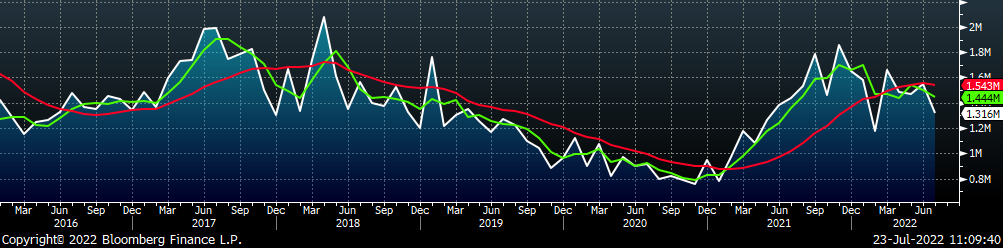
July flat rolled import license data is forecasting a decrease of 136k to 823k MoM.
Tube imports license data is forecasting a decrease of 94k to 494k in July.
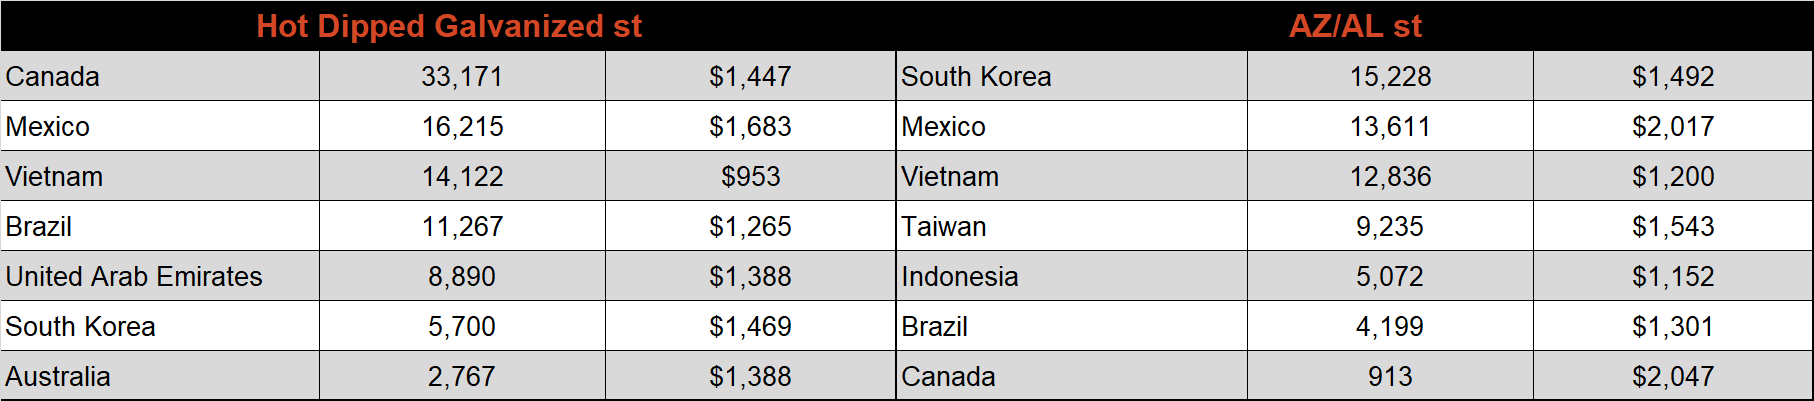
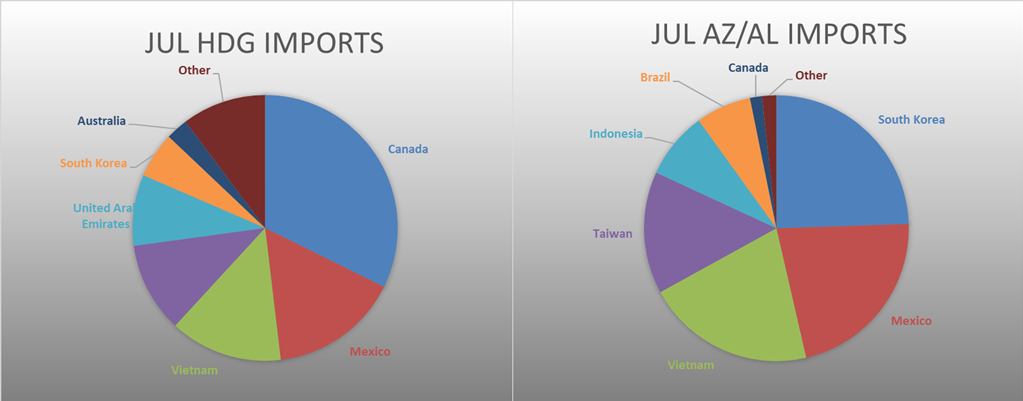
July AZ/AL import license data is forecasting a decrease of 20k to 84k.
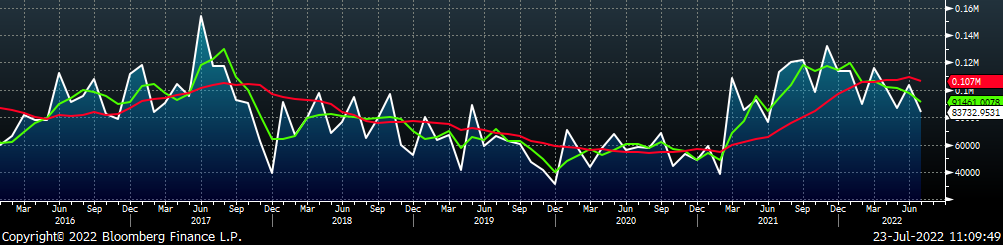
Below is July import license data through July 18th, 2022.
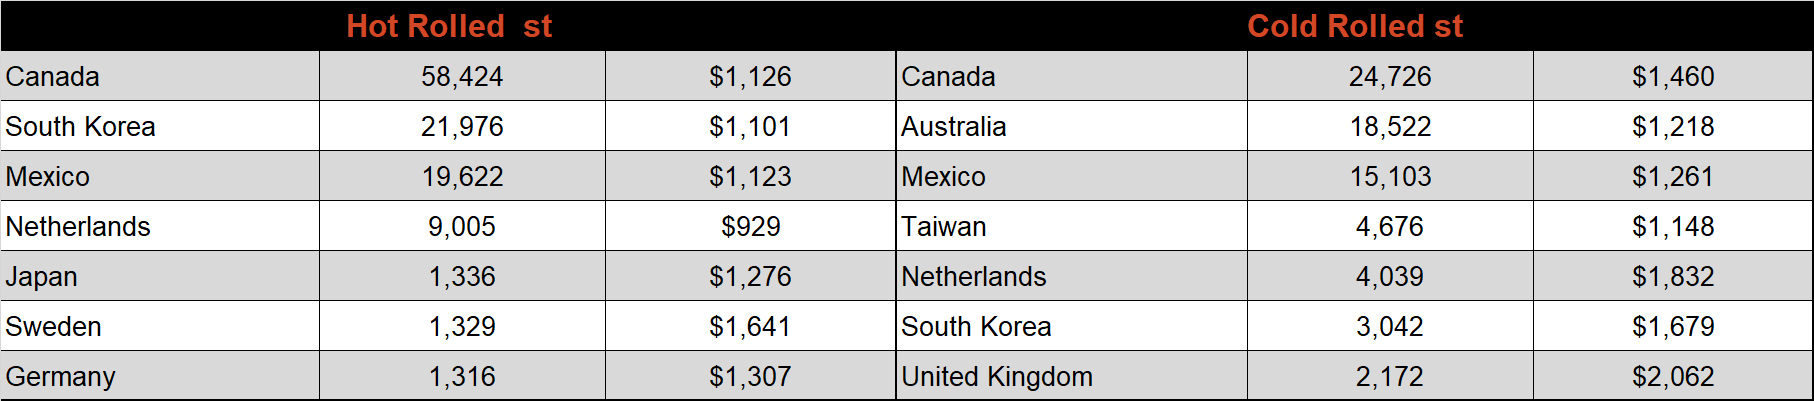
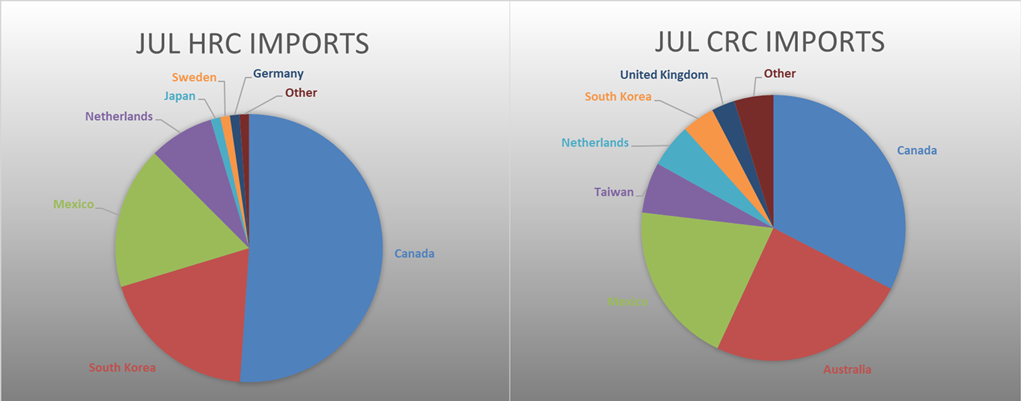
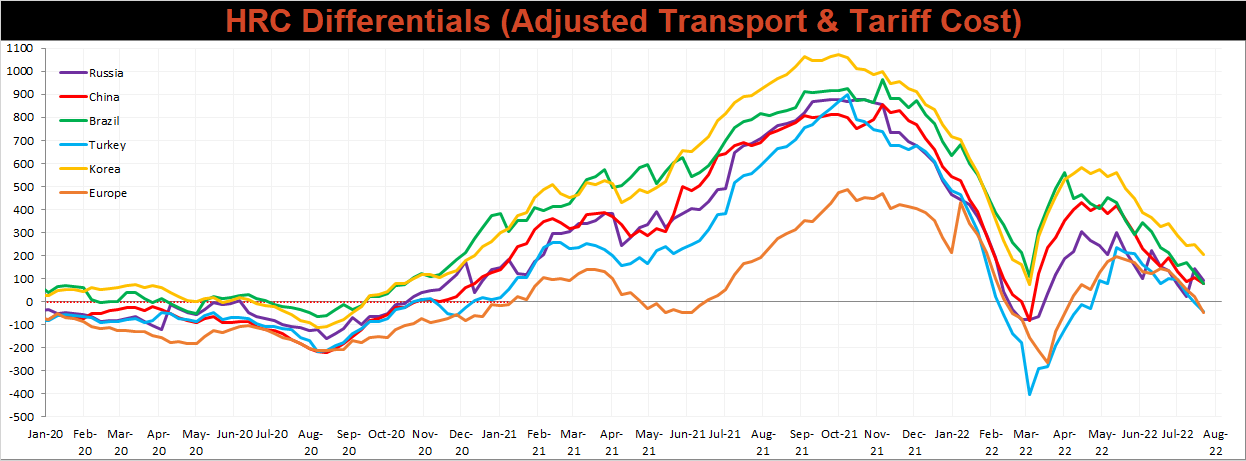
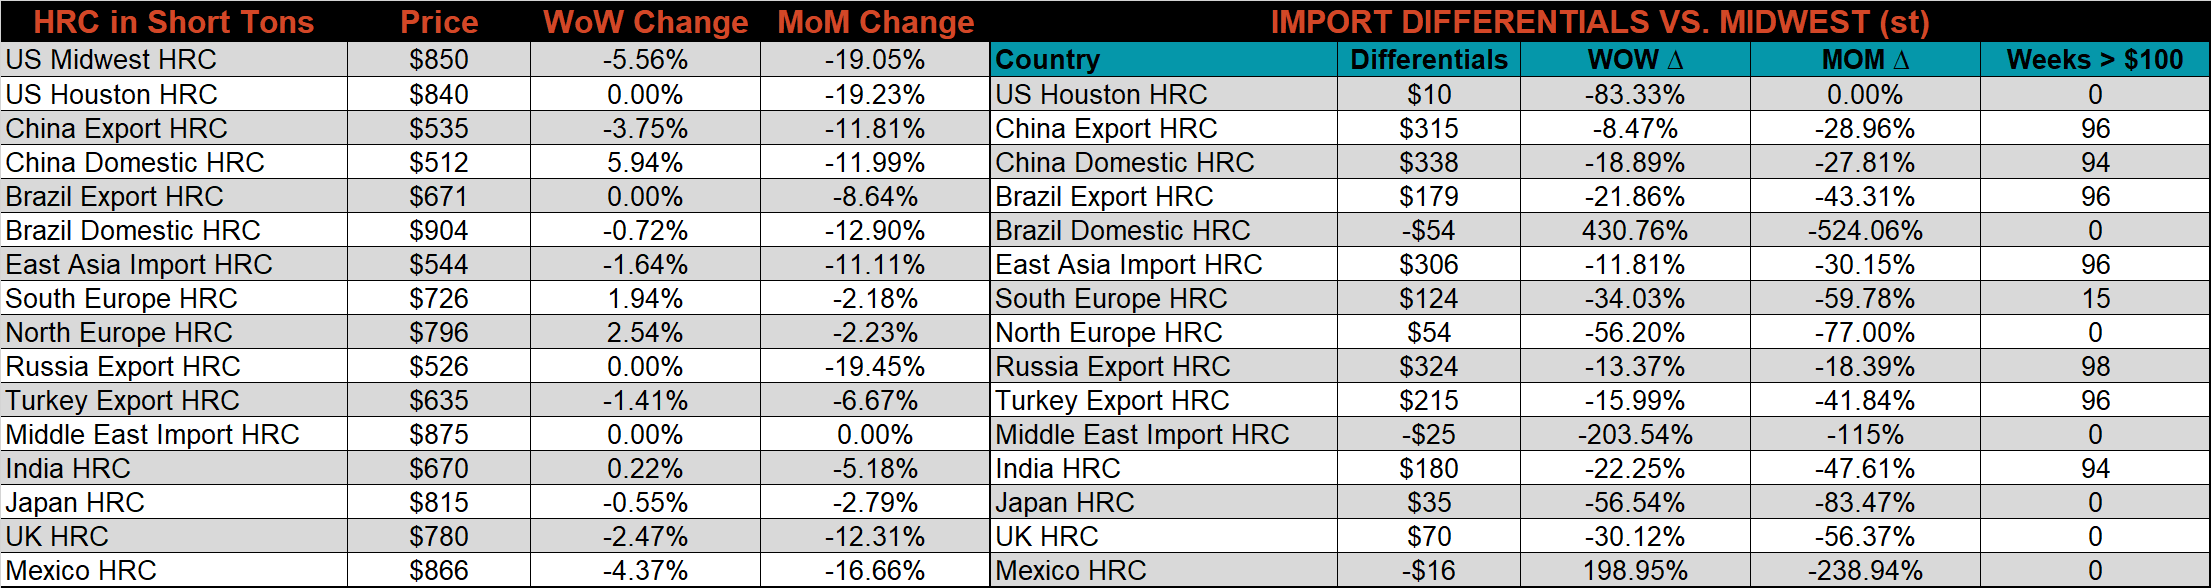
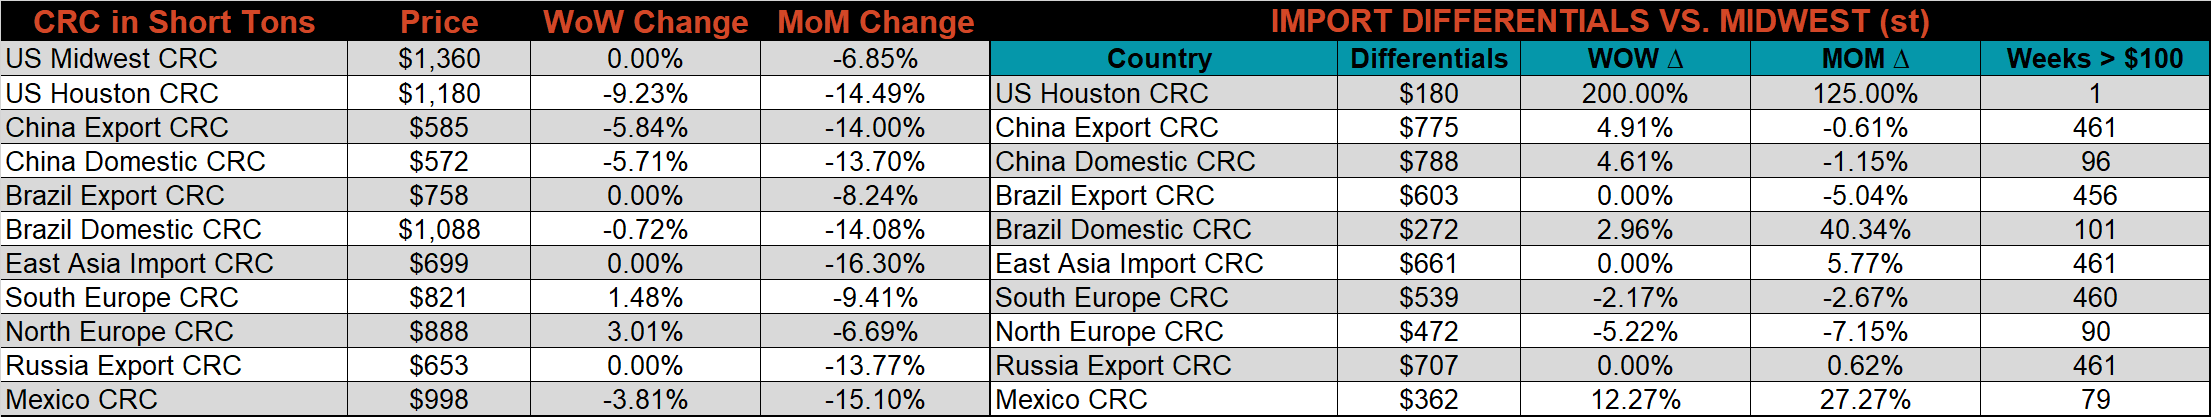
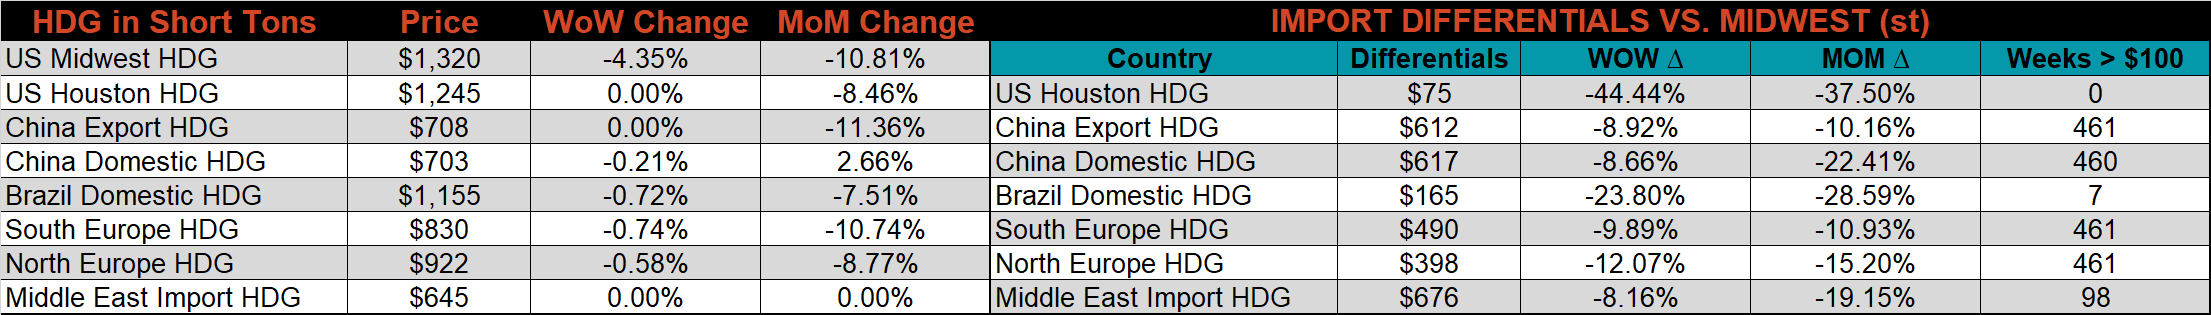
Below is the Midwest HRC price vs. each listed country’s export price using pricing from SBB Platts. We have adjusted each export price to include any tariff or transportation cost to get a comparable delivered price. Differentials decreased across the board as their corresponding prices fell more significantly that the U.S. domestic price.
SBB Platt’s HRC, HDG, and CRC pricing is below. The Midwest HRC price was down 5.6%, HRC fell 4.4%, and CRC remained unchanged.
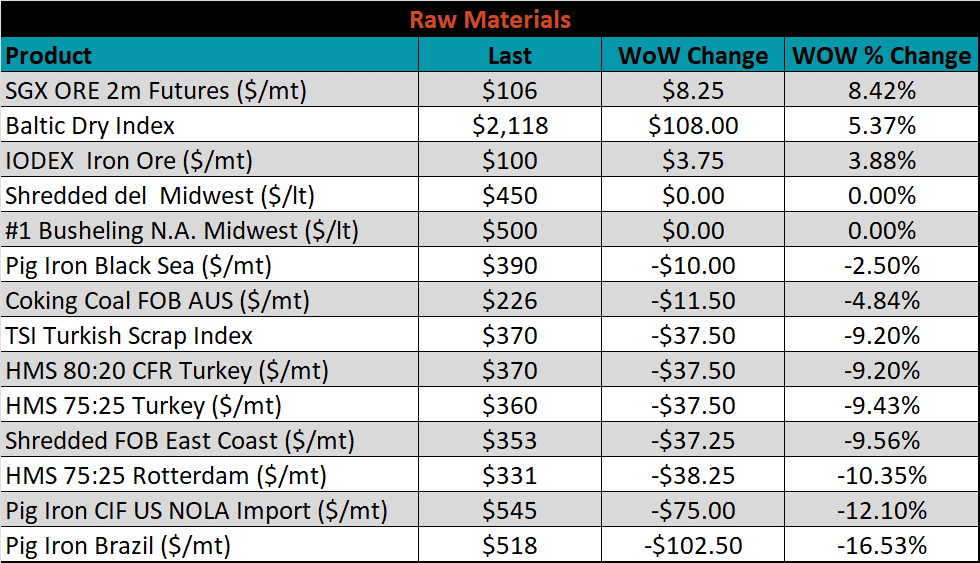
Raw material prices moved primarily lower last week with losses led by Pig Iron Brazil, down 16.5%. SGX ORE 2m Futures rose the most, up 8.4%
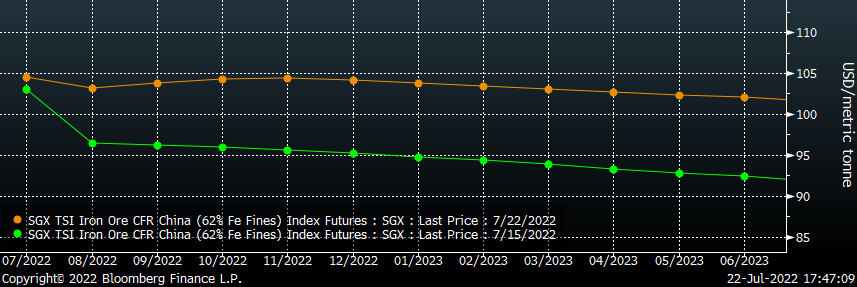
Below is the iron ore future curve with Friday’s settlements in orange, and the prior week’s settlements in green. Last week, the entire curve shifted sharply higher.
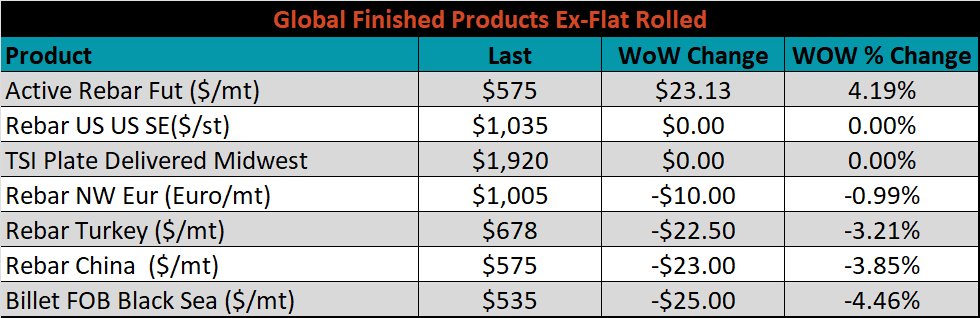
The ex-flat rolled prices are listed below.

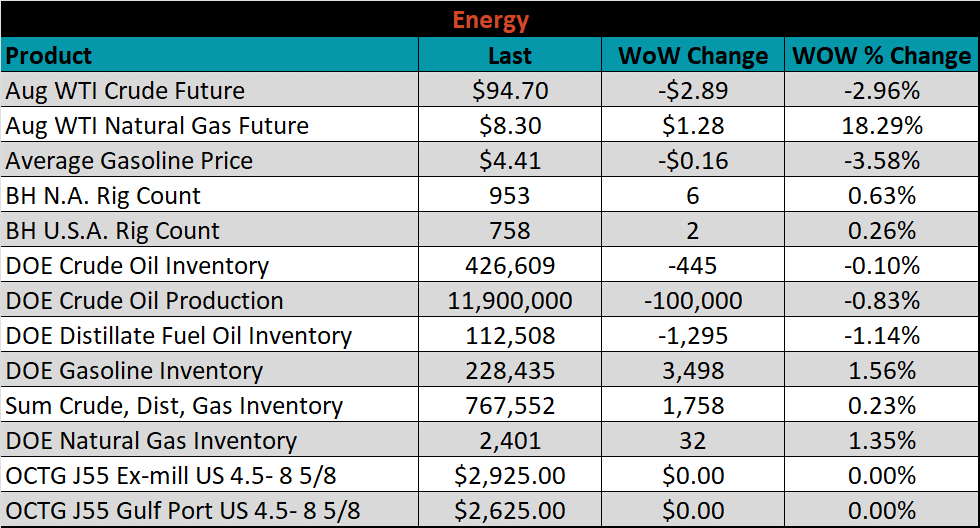
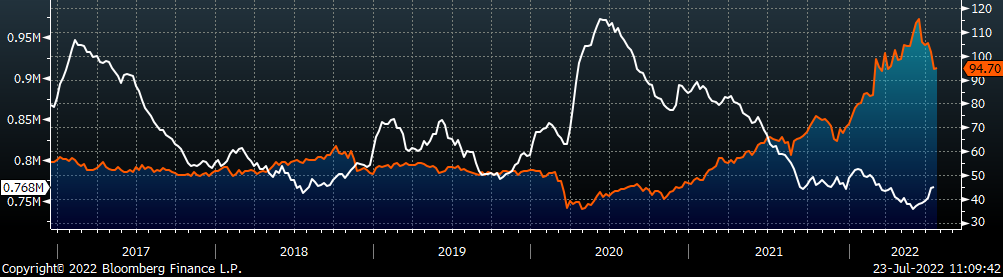
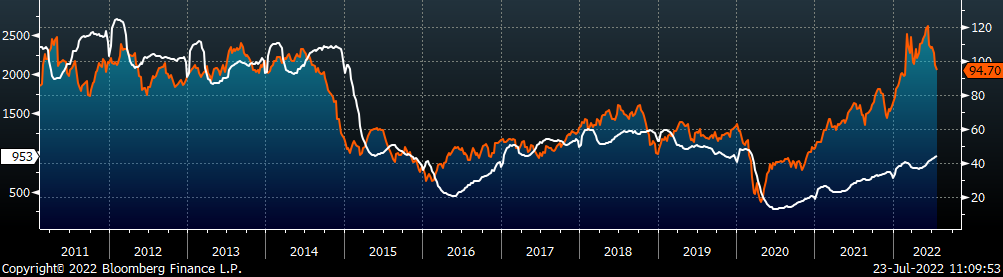
Last week, the August WTI crude oil future fell $2.89 or 3% to $94.70/bbl. The aggregate inventory level decreased 0.1%. The Baker Hughes North American rig count increased 6 rigs, while the U.S. rig count increased 2 rigs.
The list below details some upside and downside risks relevant to the steel industry. The bolded ones are occurring or highly likely.
Upside Risks:
Downside Risks: