Content
-
Weekly Highlights
- Market Commentary
- Risks


The rally continues after another quiet week in the physical market resulted in higher HRC spot prices. Demand remains strong across most major steel consuming sectors, while auto production is artificially constrained by the continued chip shortage and due for a significant rebound. At the same time, lead times have slowly started moving closer to their historical average over the last month, a shift we believe requires further context to fully understand. Recently, we have heard from multiple mills that they are withholding September tons to have better visibility of production for the month. While sceptics may be hesitant to take this at face value, the fact is that throughout most of this rally, contract customers have been held to minimums and spot buyers are left with whatever remains (if anything). This has led to an uneven disbursement of the limited number of tons available and has forced many “domestic only” buyers to look at foreign tons. The chart below better describes the relationship between spot price and lead time going back to 2015, when we started to track both more closely.
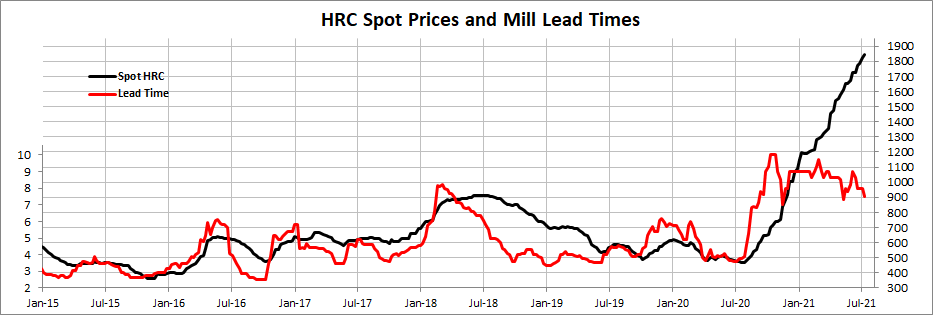
Historically, decreasing lead times have signaled a “red alert” for elevated prices, but it is important to remember that although they have started trending lower, current levels would signal the high-water mark compared to historic rallies. Given this context, we view the current shift in lead times as mill discipline and efficiency rather than diminishing demand. Further, their ability to reign in lead times is necessary to providing spot market reliability. By being able to offer more tons to spot buyers, they diminish the threat of imports and are in a prime position for the eventual return of auto production on top of increasing demand from energy and construction.
Turning to the paper markets, we will refresh a chart last analyzed in the May 28th WoW Report, HRC Net Speculative position (blue) and HRC open interest (white).
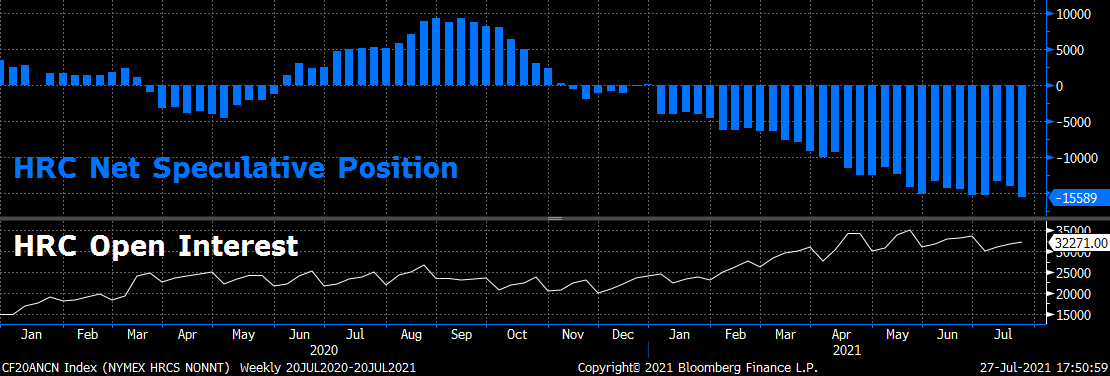
As a quick reminder, speculators and commercial participants have inverse positioning in this data. This means that the current long position from commercial hedgers is at an all-time high level for this rally. On top of that, open interest remains elevated, meaning speculators who have been losing significant amounts of money throughout the rally continue to maintain short positions at these elevated prices. What this really means for customers looking to fix their price in 2022 is that there is a serious risk from speculators pushing prices higher if they are required to cover their shorts due to margin requirements. If you are waiting for lower prices to lock in next year, the mechanics of the futures market suggest lower prices are very unlikely if current demand remains intact.

Below are the most pertinent upside and downside price risks:
Upside Risks:
Downside Risks:

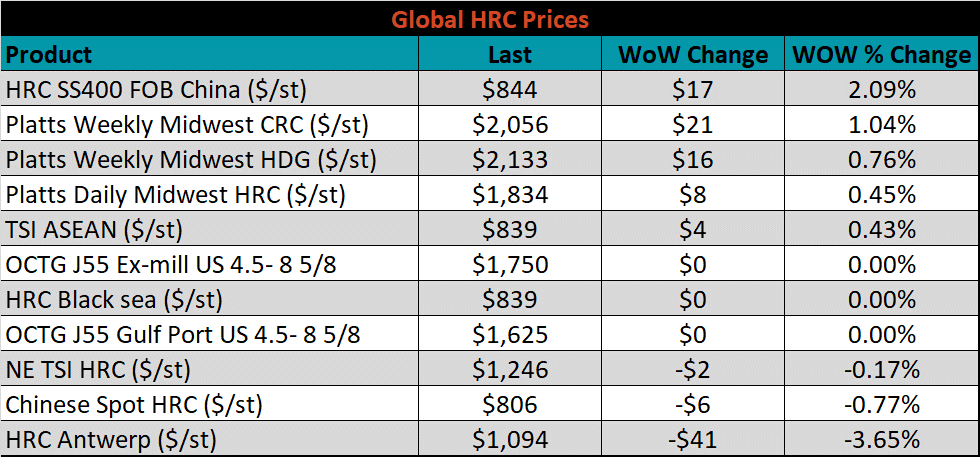
The Platts TSI Daily Midwest HRC Index increased by $8.25 to $1,833.50.

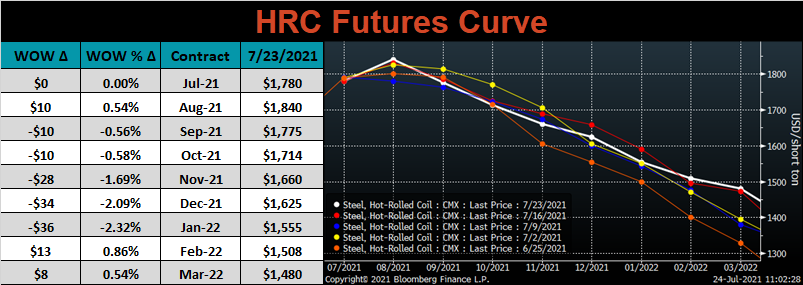
The CME Midwest HRC futures curve is below with last Friday’s settlements in white. Last week, the middle of the curve shifted slightly lower.
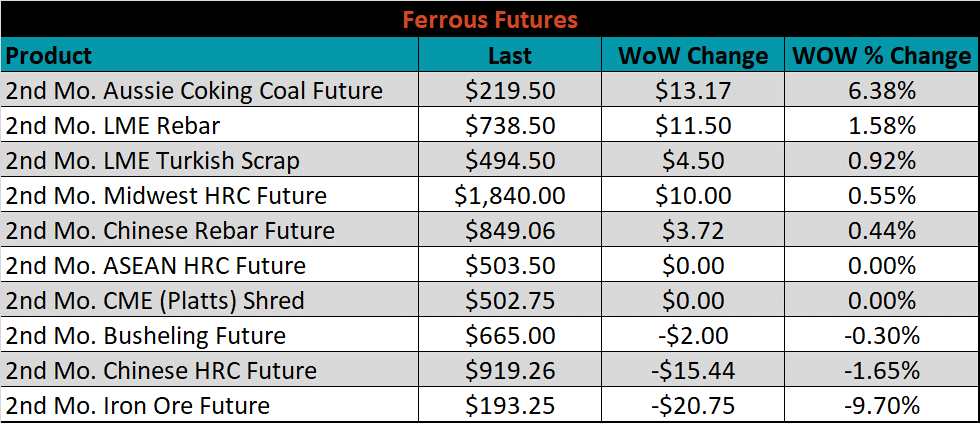
September ferrous futures were mixed. Iron ore lost 9.7%, while Aussie coking coal gained 6.4%.
Global flat rolled indexes were mixed. Chinese export HRC was up 2.1%, while Antwerp HRC was down 3.7%.
The AISI Capacity Utilization rate increased 0.5% to 84.1%.


July flat rolled import license data is forecasting a decrease of 84k to 902k MoM.

Tube imports license data is forecasting a decrease of 81k to 329k in June.


June AZ/AL import license data is forecasting an increase of 65k to 141k.

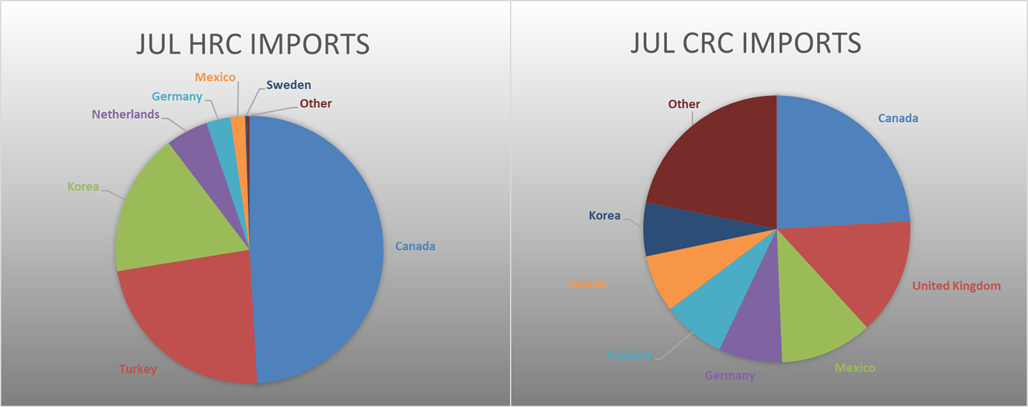
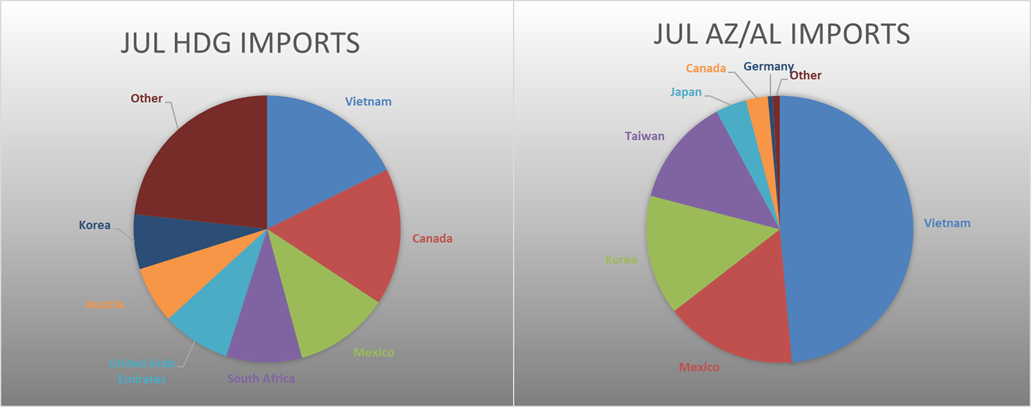
Below is July import license data through July 19th, 2021.


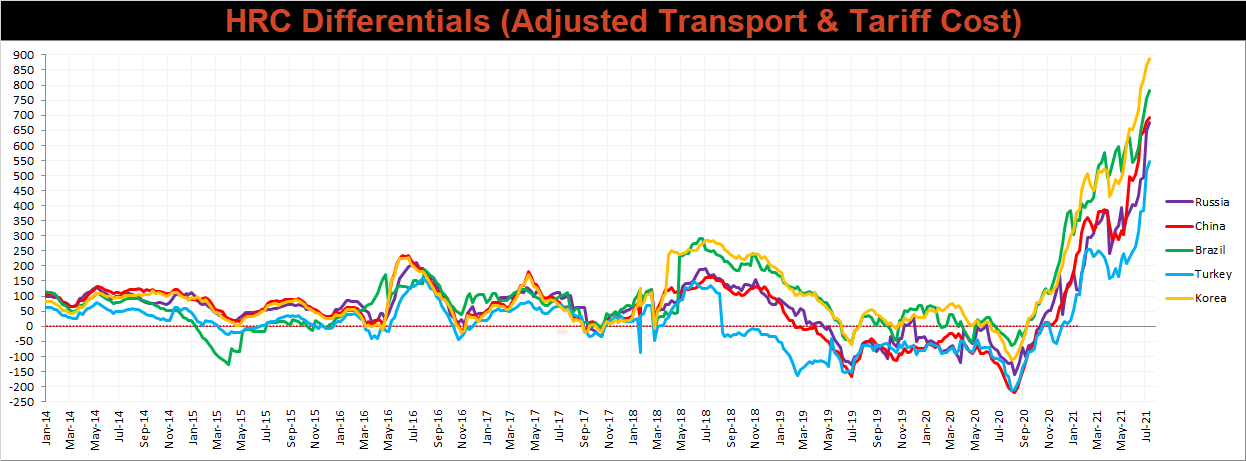
Below is the Midwest HRC price vs. each listed country’s export price using pricing from SBB Platts. We have adjusted each export price to include any tariff or transportation cost to get a comparable delivered price. Differentials for all watched countries increased further and are holding at these incredible levels. Supply chain constraints and the fear of retaliatory tariffs appear to be major roadblocks for steel exporting countries looking to take advantage of this historic differential.
SBB Platt’s HRC, CRC and HDG pricing is below. The Midwest CRC, HDG, & HRC prices were up, 1%, 0.8% and 0.5%, respectively. Globally, the Southern European HRC price was down 3.3%.


Raw material prices were mixed, New Orleans pig iron up 2.4%, while the September iron ore future lost 9.7%.
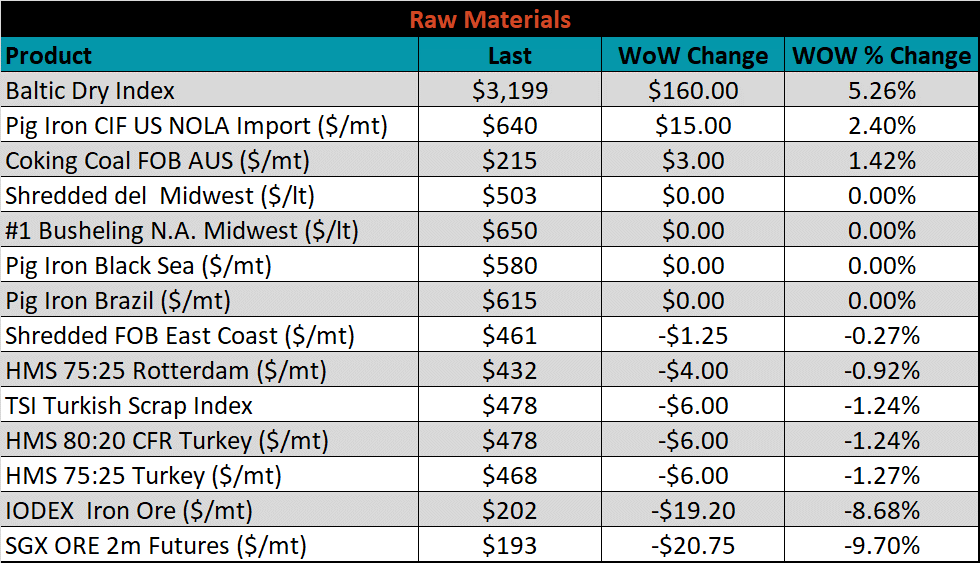
Below is the iron ore future curve with Friday’s settlements in orange, and the prior week’s settlements in green. Last week, the entire curve shifted lower most significantly in the front.

The ex-flat rolled prices are listed below.


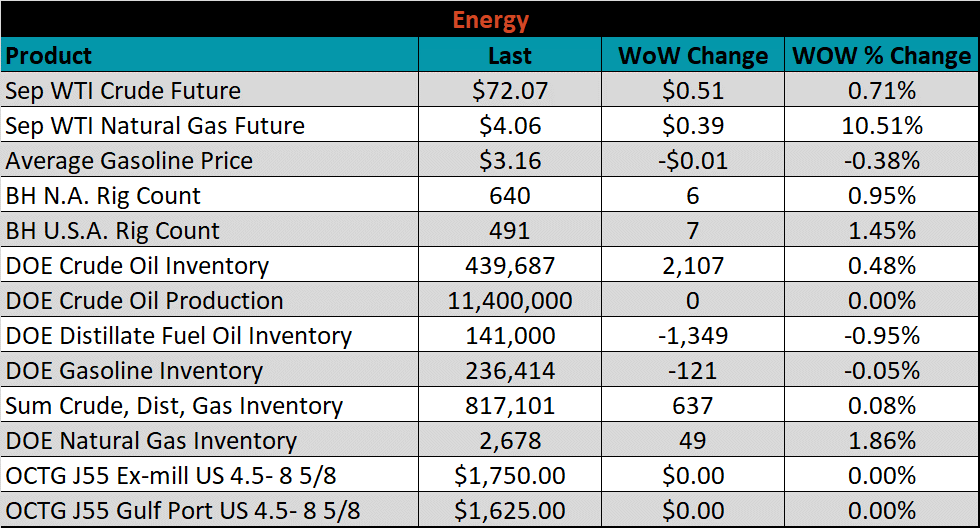
Last week, the September WTI crude oil future was up $0.51 or 0.7% to $72.07/bbl. The aggregate inventory level was up 0.1%, while crude oil production remains at 11.4m bbl/day. The Baker Hughes North American rig count was up another 6 rigs, and the U.S. rig count was up 7.


The list below details some upside and downside risks relevant to the steel industry. The orange ones are occurring or look to be highly likely. The upside risks look to be in control.
Upside Risks:
Downside Risks: