Content
-
Weekly Highlights
- Market Commentary
- Risks


A week after integrated mills announced price increases for flat rolled products, the market does not appear willing to support the higher prices. The spot price continued to decline last week, and mini mills have maintained offers at low prices for new orders. When looking at support for price increases, the market tends to focus on the strength of mill order books. While integrated mill order books may be full – due to the large amount of capacity that remains idled- mini mills are continuing to struggle to fill their capacity with new orders, as evidenced by extremely short lead times. Part of this divergence has been driven by higher utilization rates at EAFs compared to BOFs. In SDI’s second quarter earnings call, the company reported that their flat rolled operations achieved a utilization of almost 90% versus an industry average of near 55%. With mini mills near full operating rates, they don’t have the ability to refuse orders at low prices. Moreover, they comprise a higher portion of the market through operating at these higher rates, and they are likely able to do so because of the recent declines in scrap prices. Iron ore and scrap prices have diverged, favoring EAF profitability.
Looking forward, these dynamics appear intact, with declining spot prices and a wide range of offer prices based on the type of producer. Additionally, US Steel also announced that it would bring back its #8 furnace at Gary Works starting August 1, which will limit any upside price rally. However, there are multiple possible disruptions to this status quo, and we will discuss a few this week.
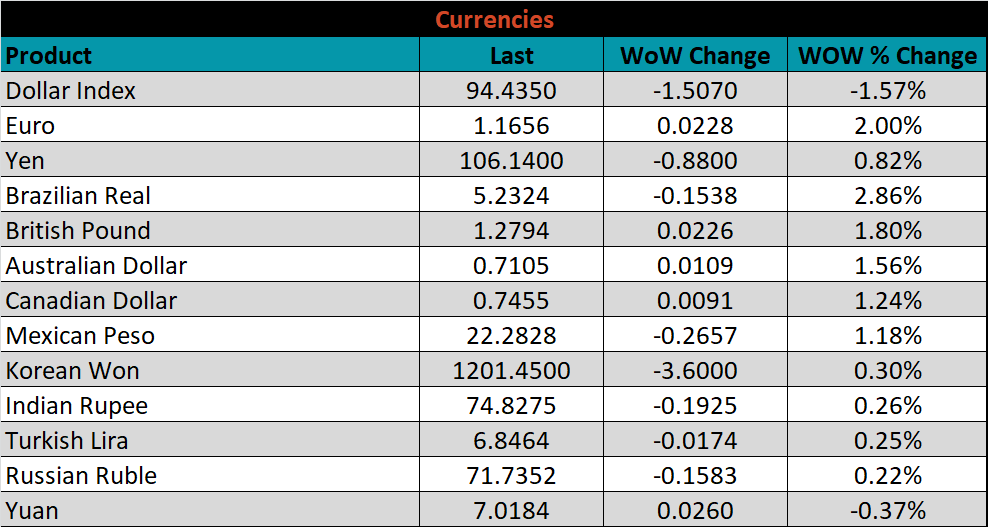
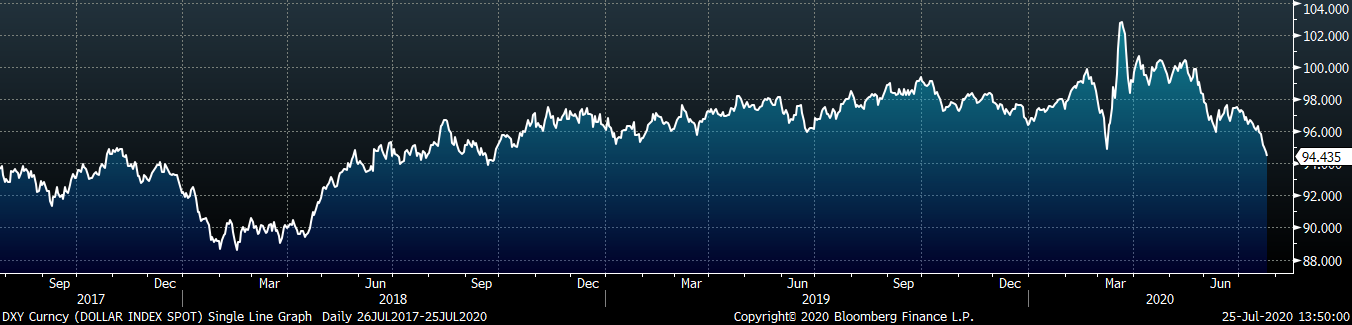
First, there has been a change in the outlook in the scrap market. After July scrap traded down significantly more that original expectations, most expected further weakness in the succeeding months. However, the August scrap outlook has improved, with busheling expected to be flat to slightly down and obsolete likely to move higher. This is significant because strength in the scrap market will squeeze profits at mini mills and provide support in the market for higher prices. This change in outlook for scrap is partially driven by increased exports of scrap from the east coast, supported by the weaker US dollar versus other global currencies.
Another noteworthy dynamic, also supported by the weakening US currency, is the strength of the global steel market and the global HRC price convergence with the domestic market. The below chart, which extends the time frame of our usual differential graph, shows the price differential of the domestic HRC price and the China export price, plus $100/st to account for transportation costs.
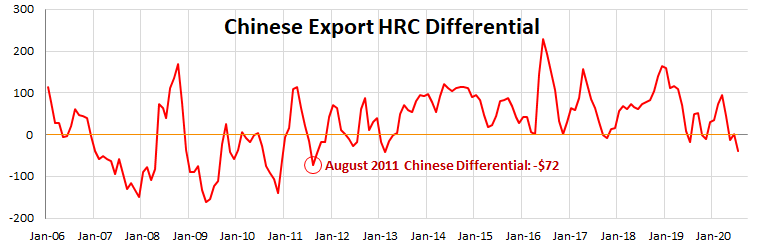
The current differential is at the lowest level since August of 2011, and the differential will continue to decline if weakness in the domestic market persists. Interestingly, the “zero” line in the chart, representing points where the domestic price is exactly $100 above the China export price, has been a reliable lower bound over the past 6 years. However, with the current move significantly below this threshold, the pricing dynamics between the two appear to be entering a “new normal”, similar to the relationship before 2013. One possible explanation is the increased domestic production capacity on the back of the Section 232 tariffs, leading to more competitive domestic pricing. Nevertheless, as domestic prices fall and the differential declines further, there will be more upward pressure on the domestic market. The upside risks are starting to add up.
Below are the most pertinent upside and downside price risks:
Upside Risks:
Downside Risks:
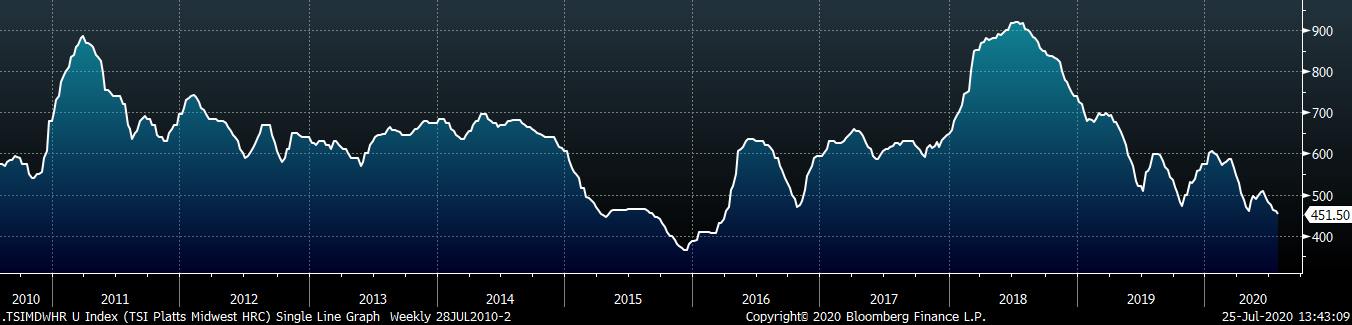
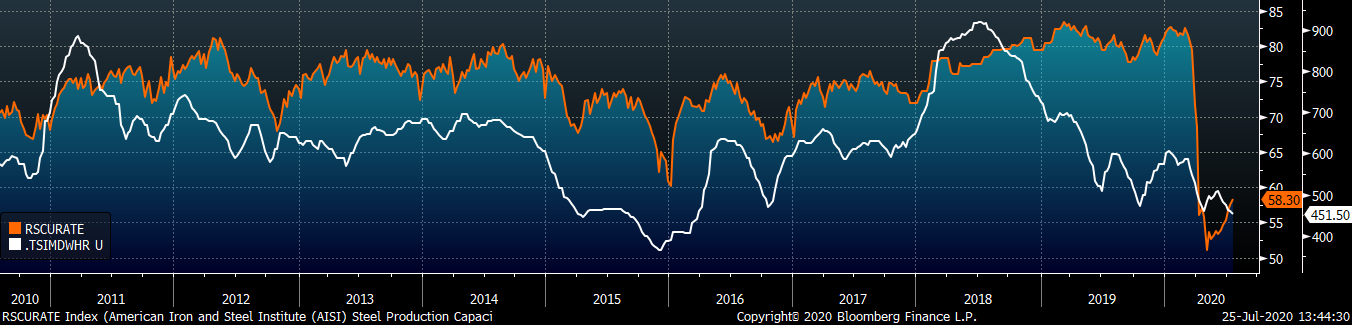
The Platts TSI Daily Midwest HRC Index was down $7.25 to $451.50.
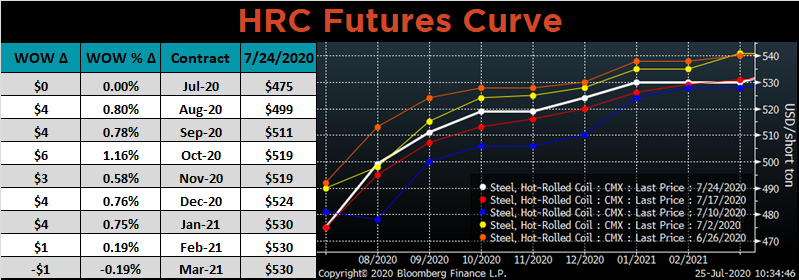
The CME Midwest HRC futures curve is below with last Friday’s settlements in white. Last week, the curve shifted slightly higher.
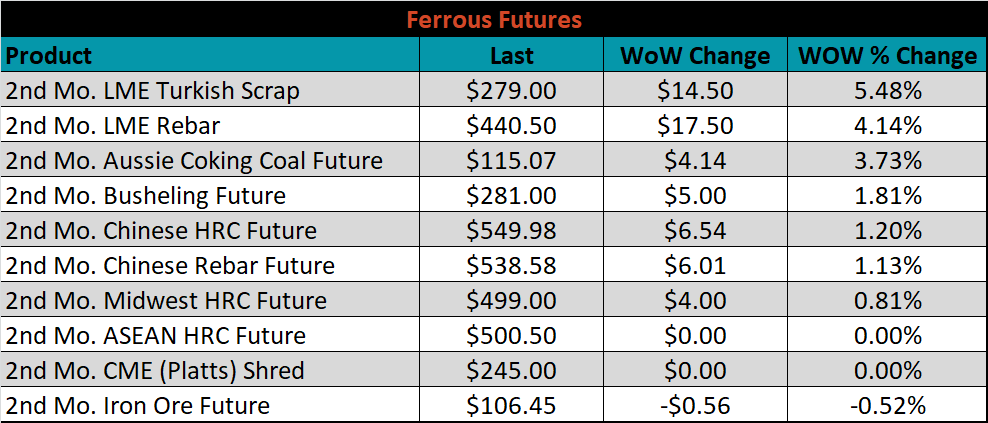
August ferrous futures were mostly higher, led by LME Turkish scrap, which gained 5.5%.
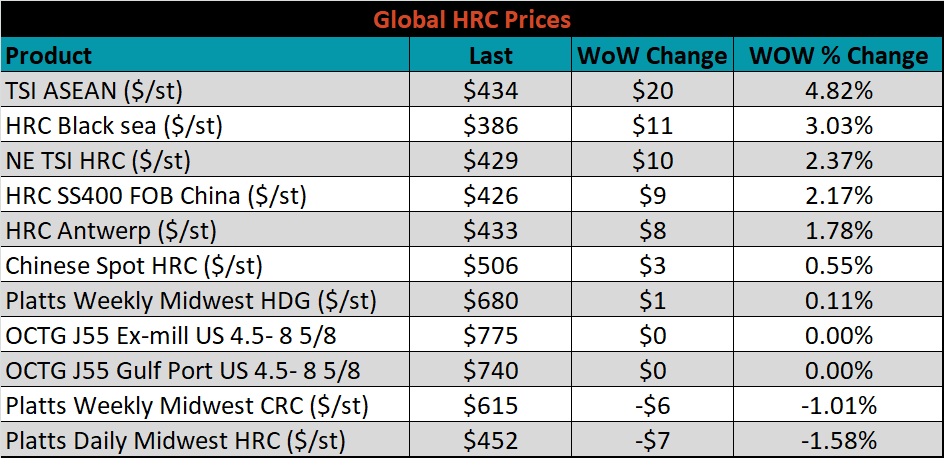
The global flat rolled indexes were mixed. The TSI ASEAN HRC price was up 4.8%, while TSI Platts Midwest HRC was down 1.6%.
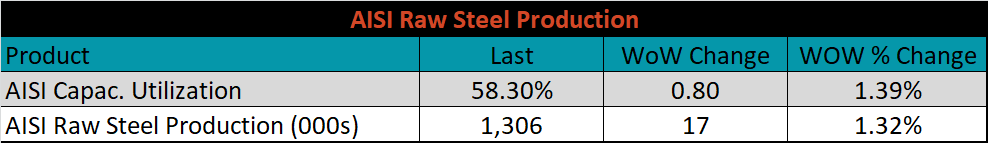
The AISI Capacity Utilization Rate was up another 0.8% to 58.3%.
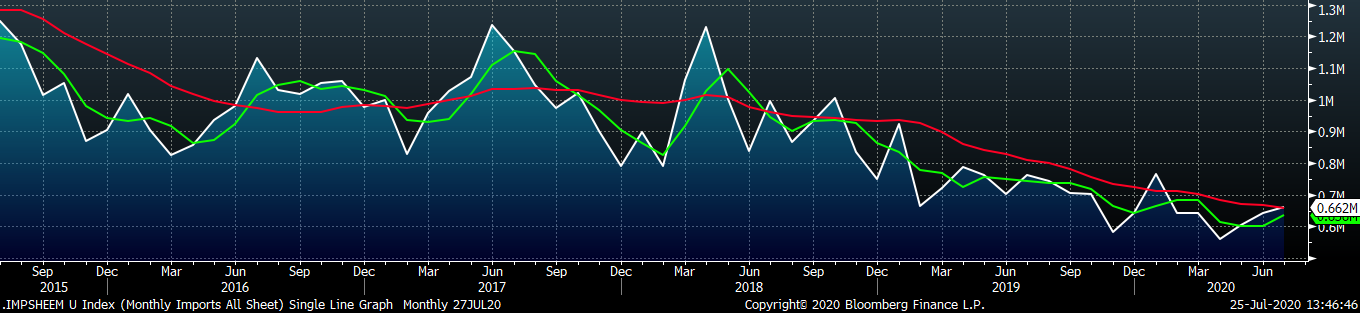
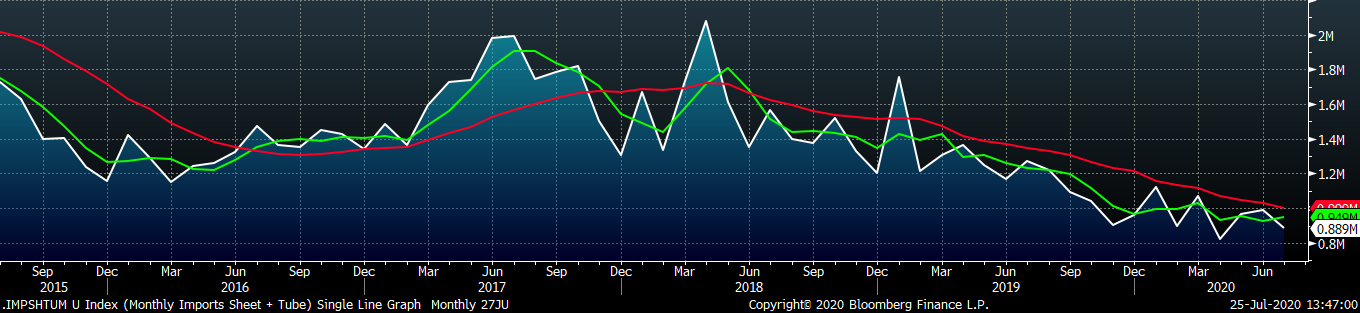
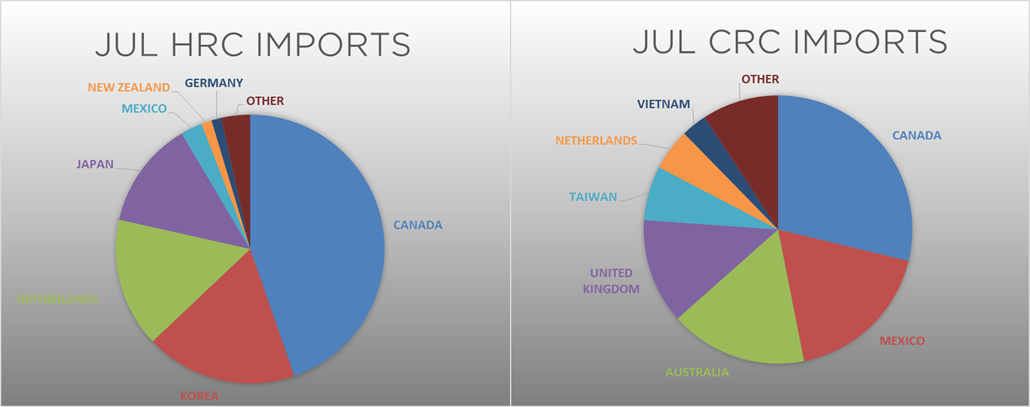
July flat rolled import license data is forecasting an increase of 20k to 662k MoM.
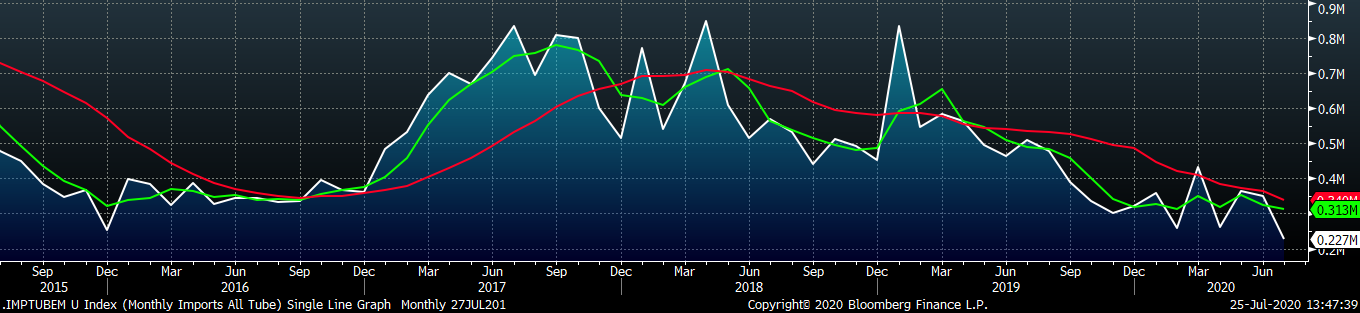
Tube imports license data is forecasting a MoM decrease of 121k to 227k tons in July.
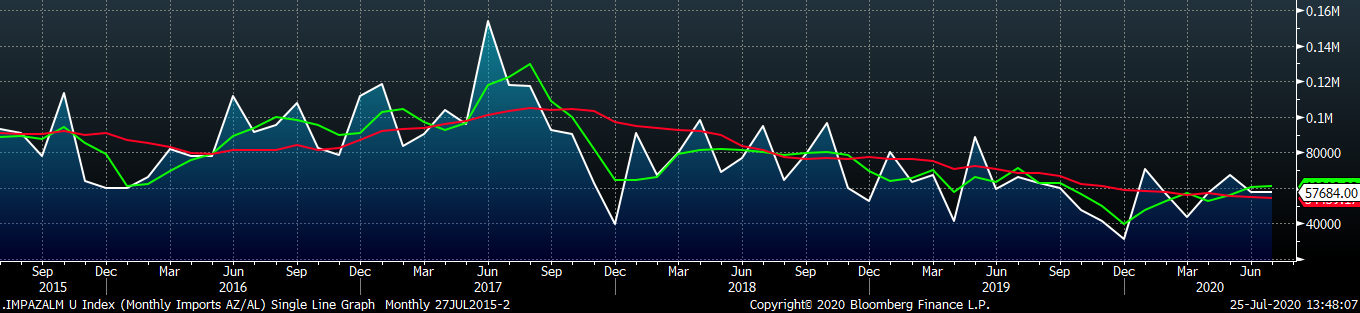
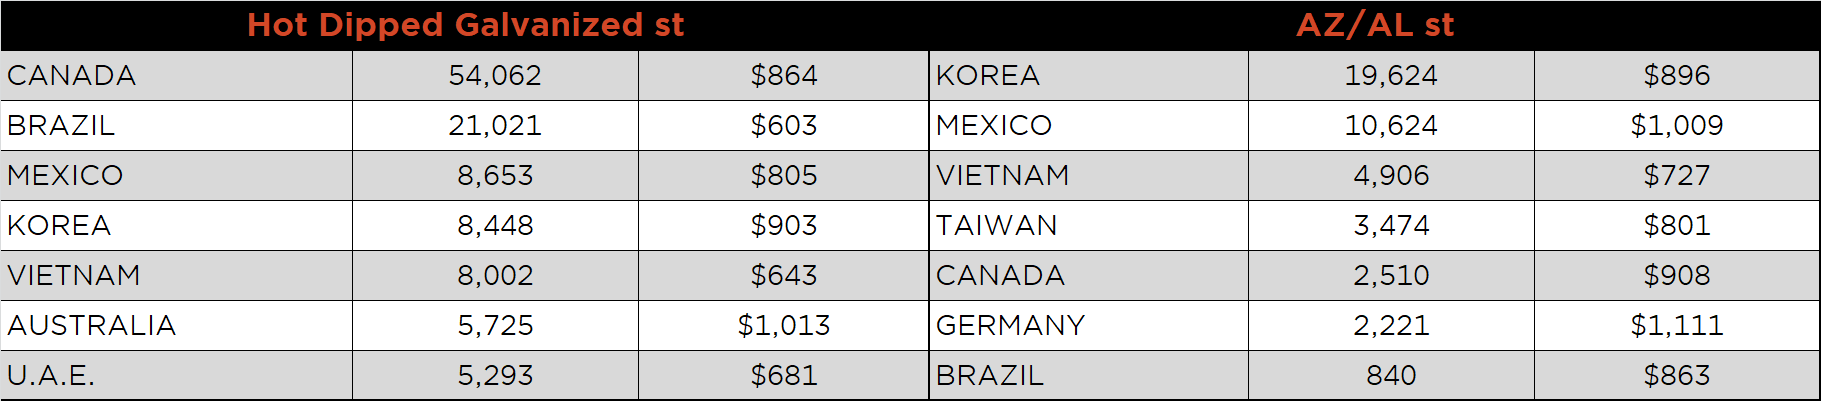
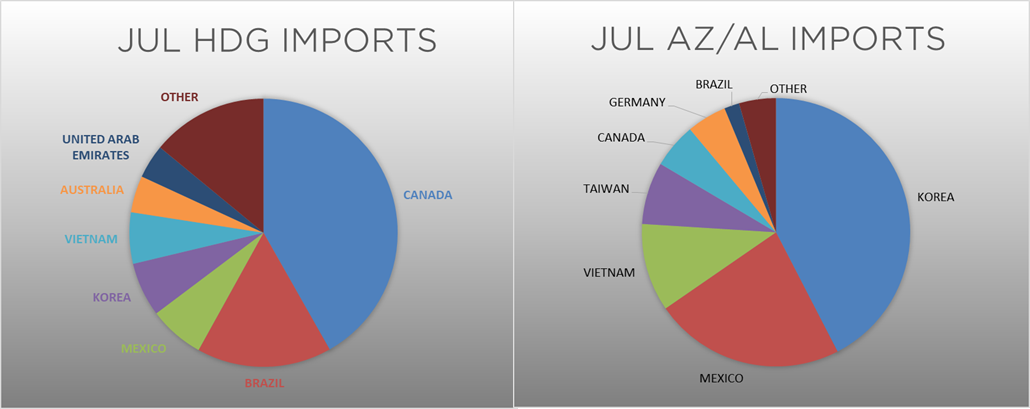
AZ/AL import license data is forecasting no change at 58k MoM.
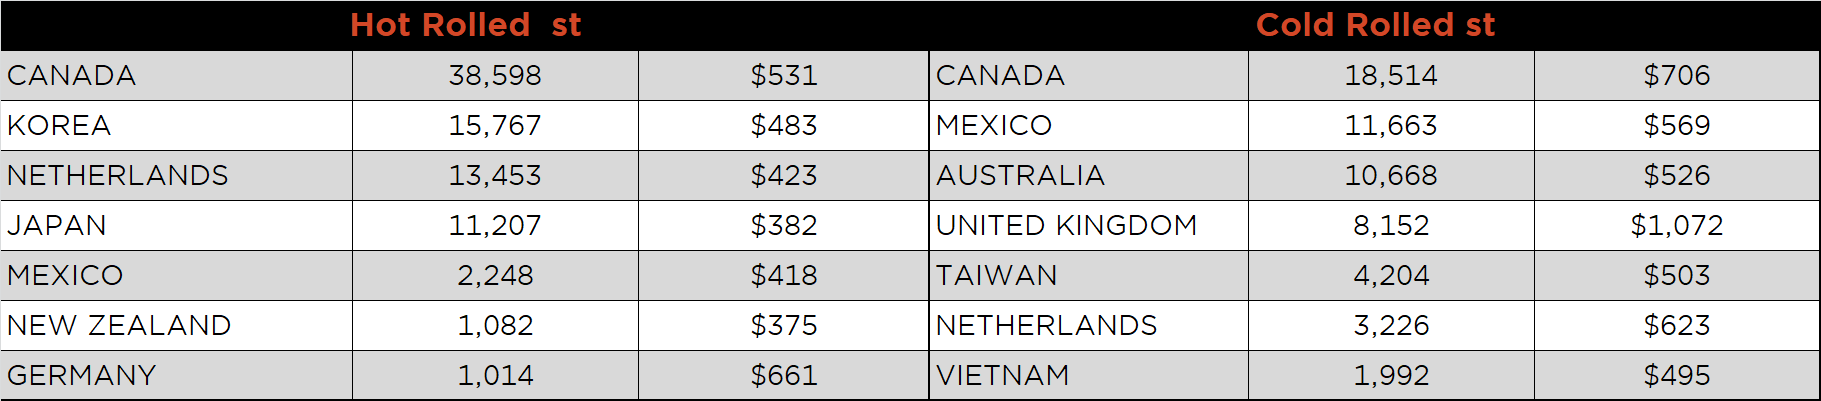
Below is July import license data through July 21, 2020.
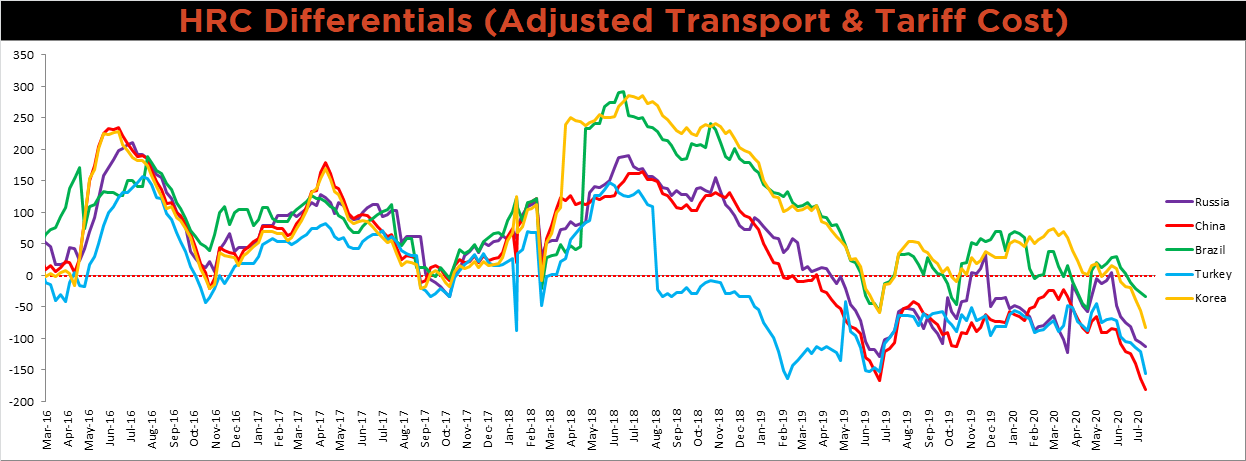
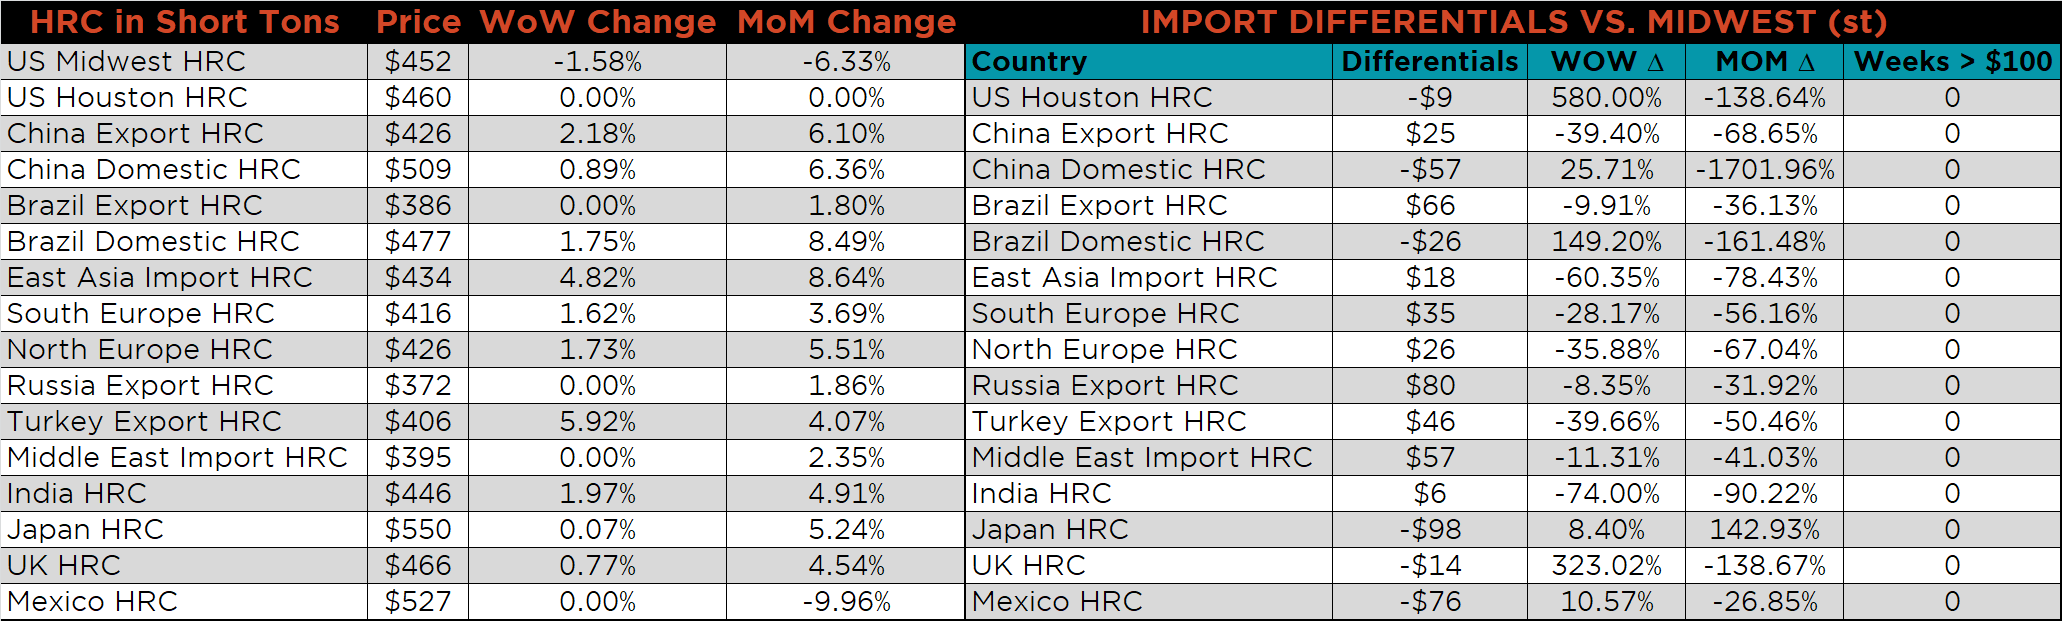
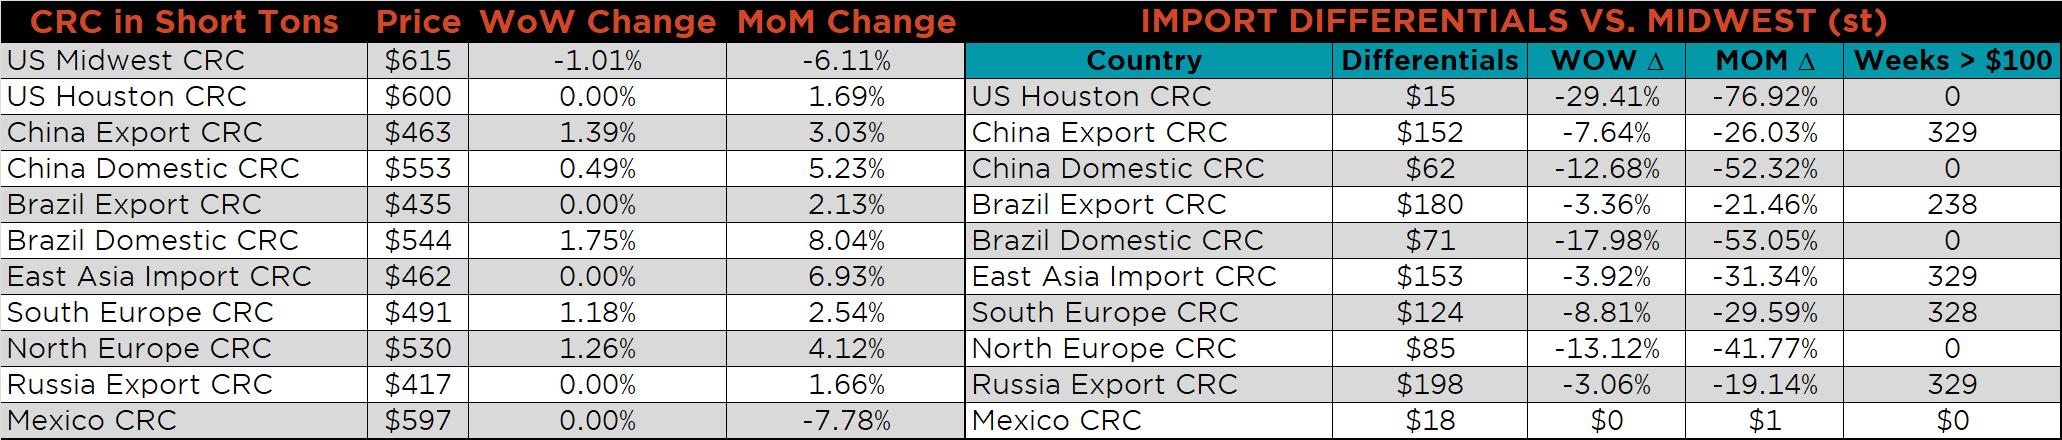
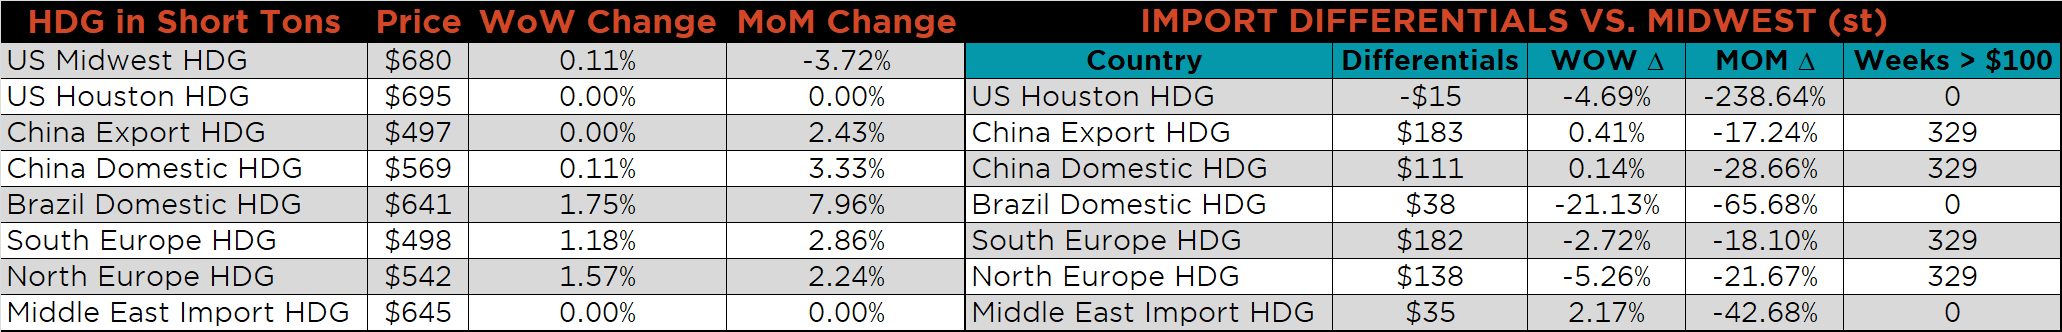
Below is the Midwest HRC price vs. each listed country’s export price using pricing from SBB Platts. We have adjusted each export price to include any tariff or transportation cost to get a comparable delivered price. All the global differentials continue to decrease, as global prices rise and the U.S. price falls.
SBB Platt’s HRC, CRC and HDG pricing is below. The Midwest HRC and CRC prices were down 1.6% and 1%, respectively, while the HDG price was up 0.1%. Globally, the Turkish export HRC price was up, 5.9%.
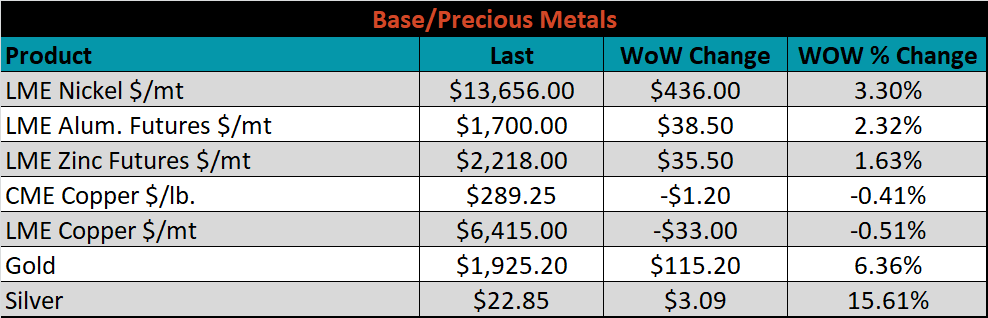
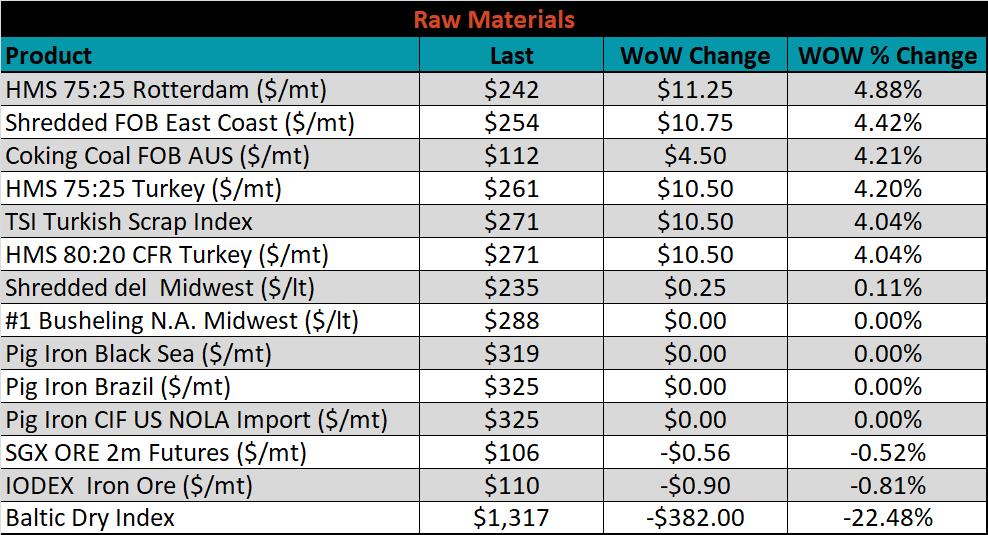
Raw material prices were mixed. Rotterdam HMS was up 4.9%, while the IODEX was down 0.8%.
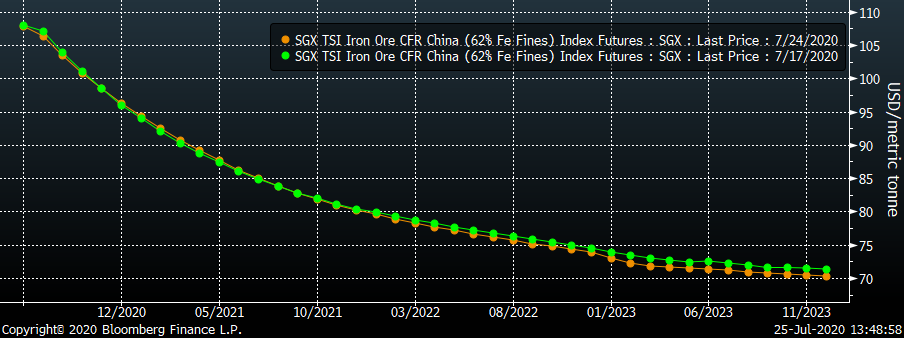
Below is the iron ore future curve with Friday’s settlements in orange, and the prior week’s settlements in green. The curve was only slightly lower.
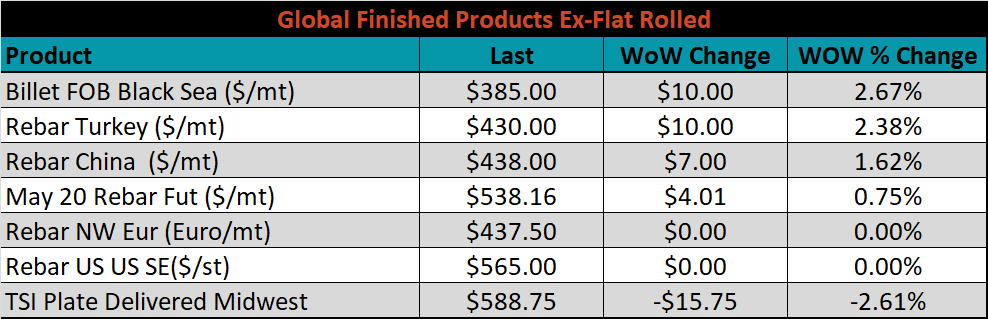
The ex-flat rolled prices are listed below. In a similar dynamic to flat rolled products, global prices have been firm, while U.S. domestic prices have recently decreased.

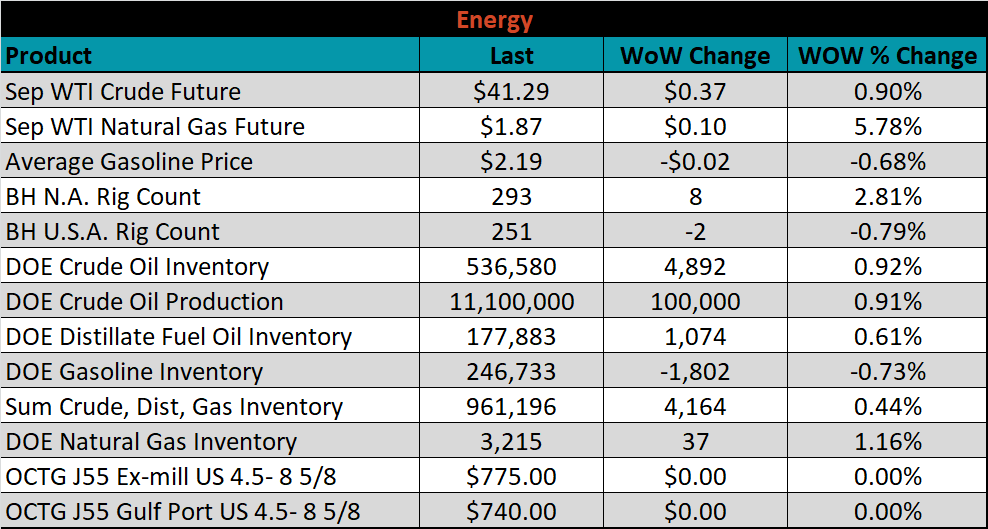
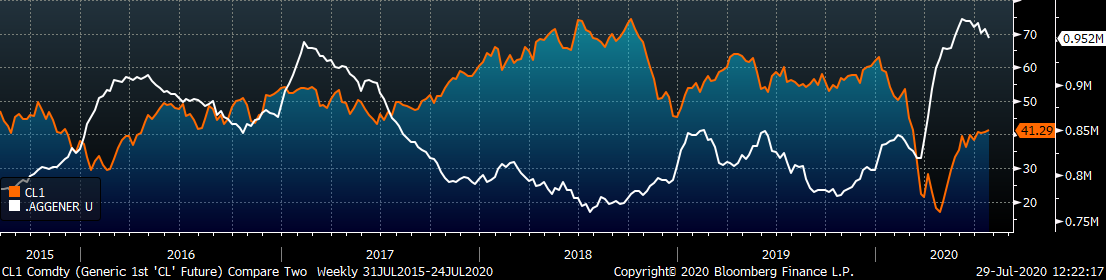
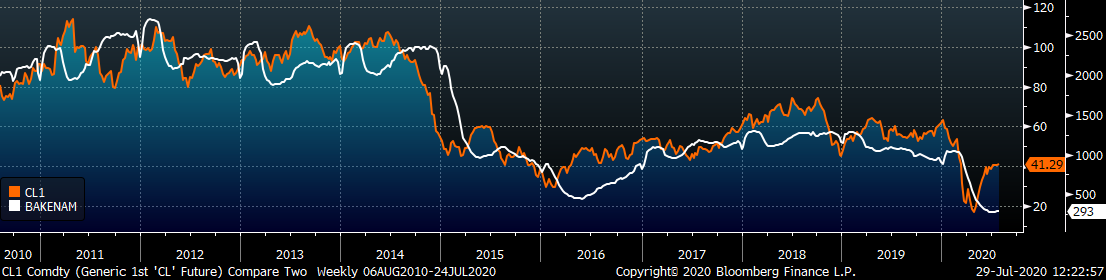
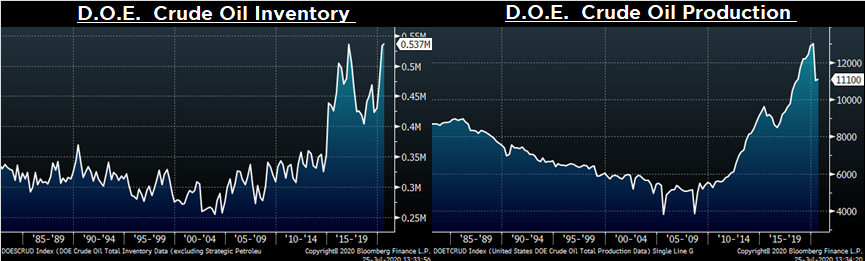
Last week, the September WTI crude oil future gained $0.37 or 0.9% to $41.29/bbl. The aggregate inventory level was up 0.4%, while crude oil production increased to 11.1m bbl/day. The Baker Hughes North American rig count was up eight rigs, while the U.S. rig count was down another two rigs.
The list below details some upside and downside risks relevant to the steel industry. The orange ones are occurring or look to be highly likely. The upside risks look to be in control.
Upside Risks:
Downside Risks: