Content
-
Weekly Highlights
- Market Commentary
- Upside & Downside Risks


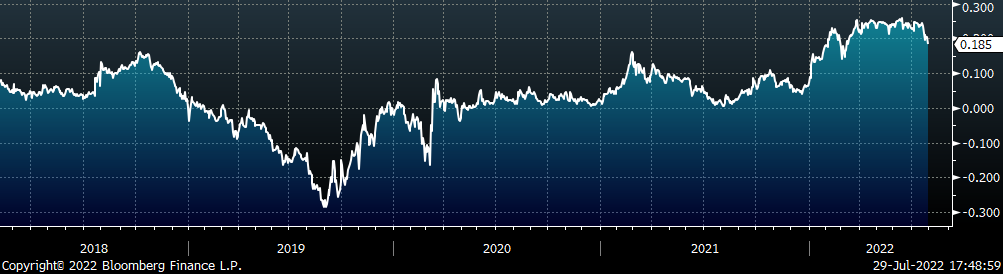
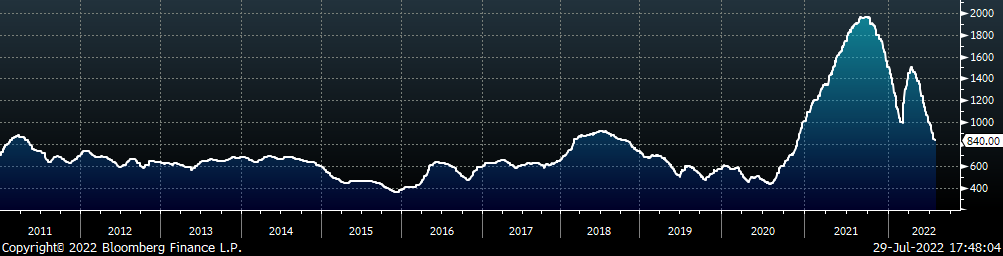
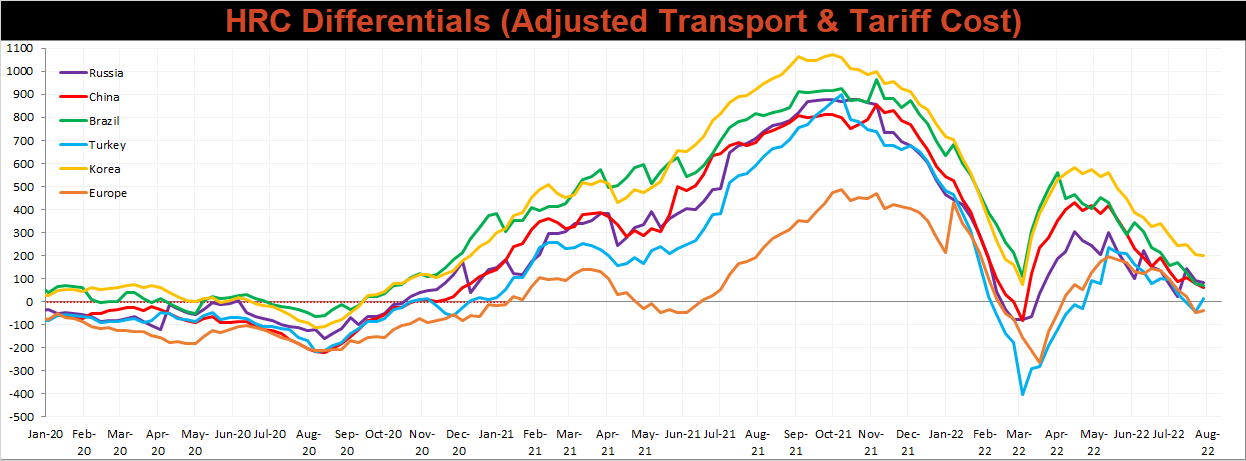
Last week, we looked at some of the fundamentals behind the Chinese steel market, this week we will turn back to the U.S. domestic market as we finish the month of July and look forward to the new data released in August. The chart below shows the global price differentials including transportation and applicable tariffs, going back to 2014.
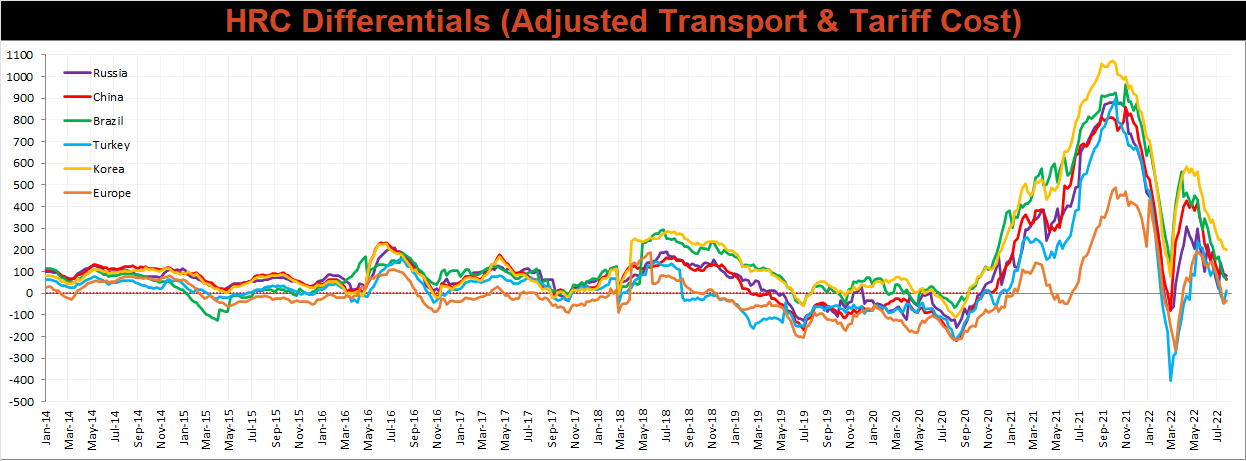
Historically when global prices are at parity with domestic prices, it sets a floor for the U.S. domestic price by signaling that imports have been priced out of the market in the short-term. This spread has been converging rapidly since the beginning of May, with the U.S. price outpacing most global prices lower. Over the last two weeks, the first global differentials turned negative (Europe & Turkey), and today the remaining countries have approximately $70 remaining in their differential spread.
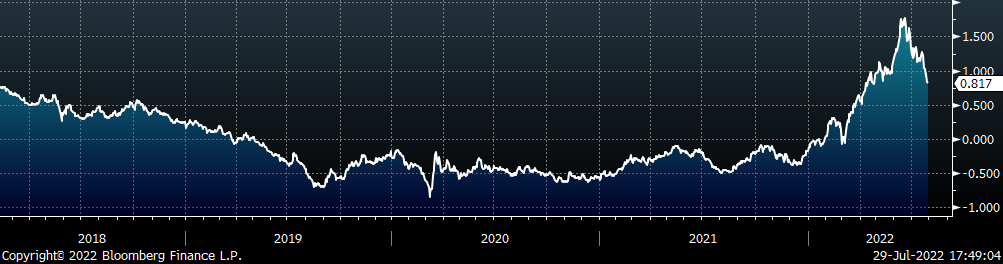
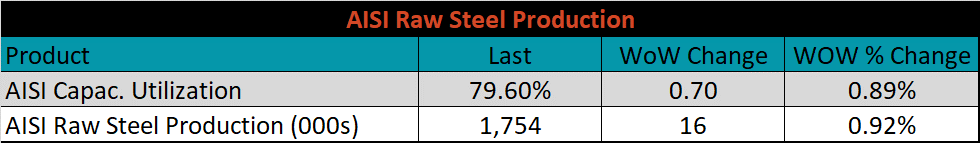
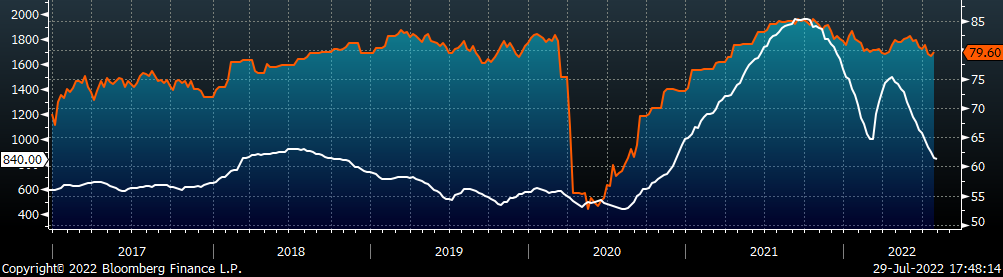
An additional signal we are always watching when the market is approaching a bottom is how much domestic mills have responded to the falling prices. The chart below shows capacity utilization in the U.S. which moved to its lowest level since April of 2021.
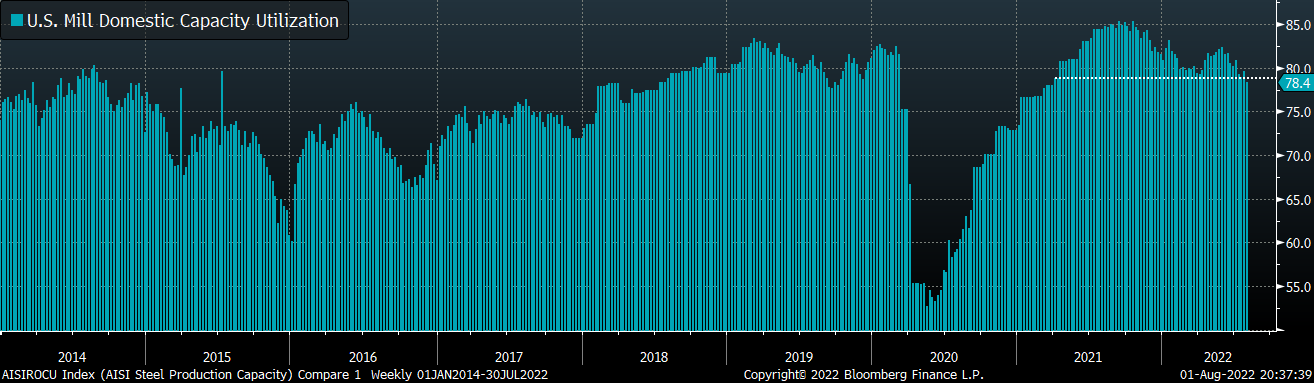
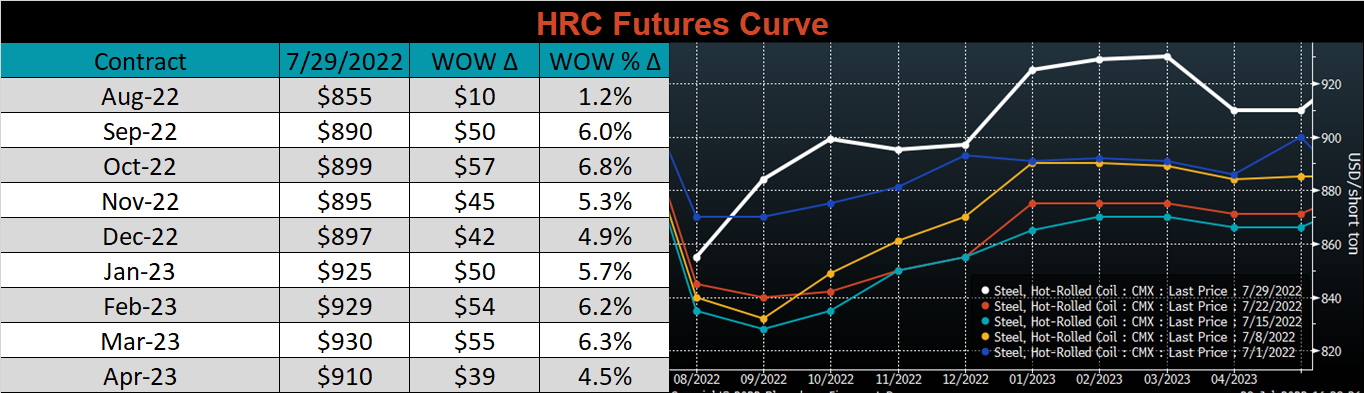
When looking at the two in concert, we can start to think about what the rebound will look like. While there are additional factors to consider, these two charts provide a good read on how supply is being rebalanced with demand. It is costly and time consuming for BOFs to pull production out of the market, but EAFs can adjust production levels up and down much more easily, potentially limiting the upside. If this is the bottom, it will be important to watch how quickly EAFs increase production as prices rise, since they were the first to throttle down. That question will be answered down the road, but the key takeaway for today is that the foundation for the next rally is already starting to be built, and as prices continue to fall, the benefit of waiting for a better deal is being diminished every day. As we will see below, the forward curve has already started to react, with January 2023 trading $70 higher than August.
Below are the most pertinent upside and downside price risks:
Upside Risks:
Downside Risks:
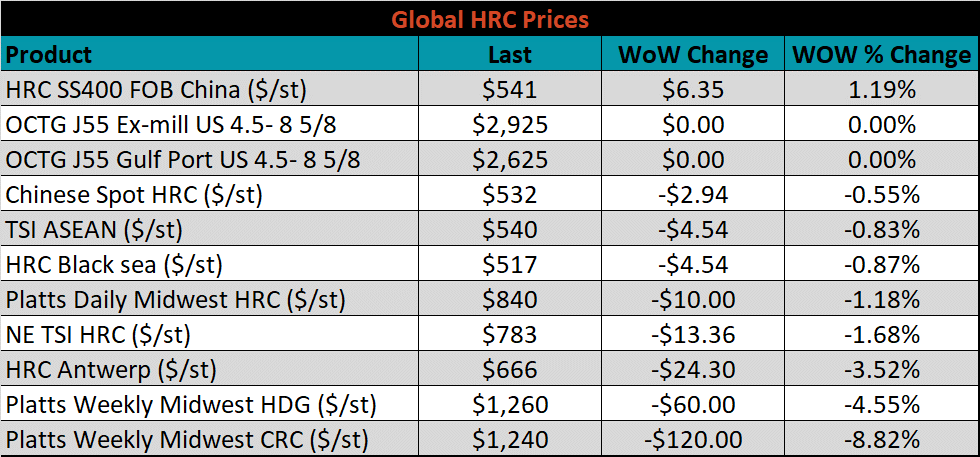
The Platts TSI Daily Midwest HRC Index fell $10 to $840.
The CME Midwest HRC futures curve is above last Friday’s settlements in orange. The entire curve shifted higher last week with each price (ex. August) at it’s highest level in the last 5 weeks.
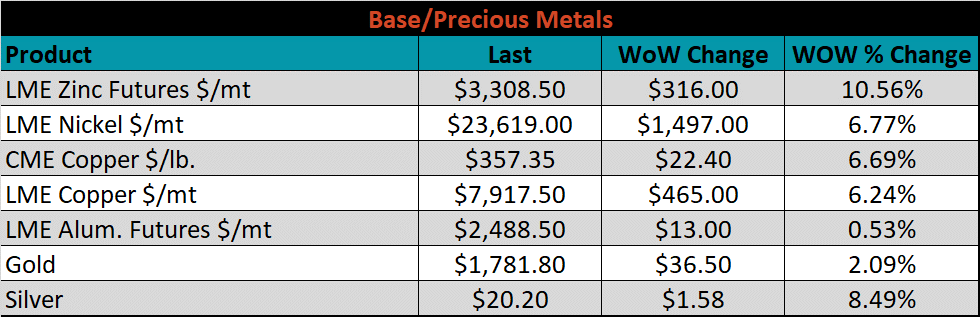
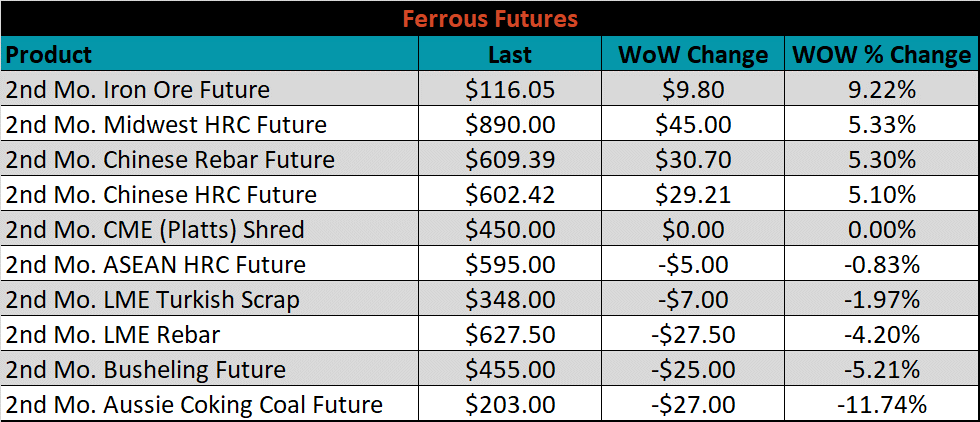
The 2nd month ferrous futures ended the week mixed, with iron ore up another 9.2%, while Aussie coking coal lost another 11.7%.
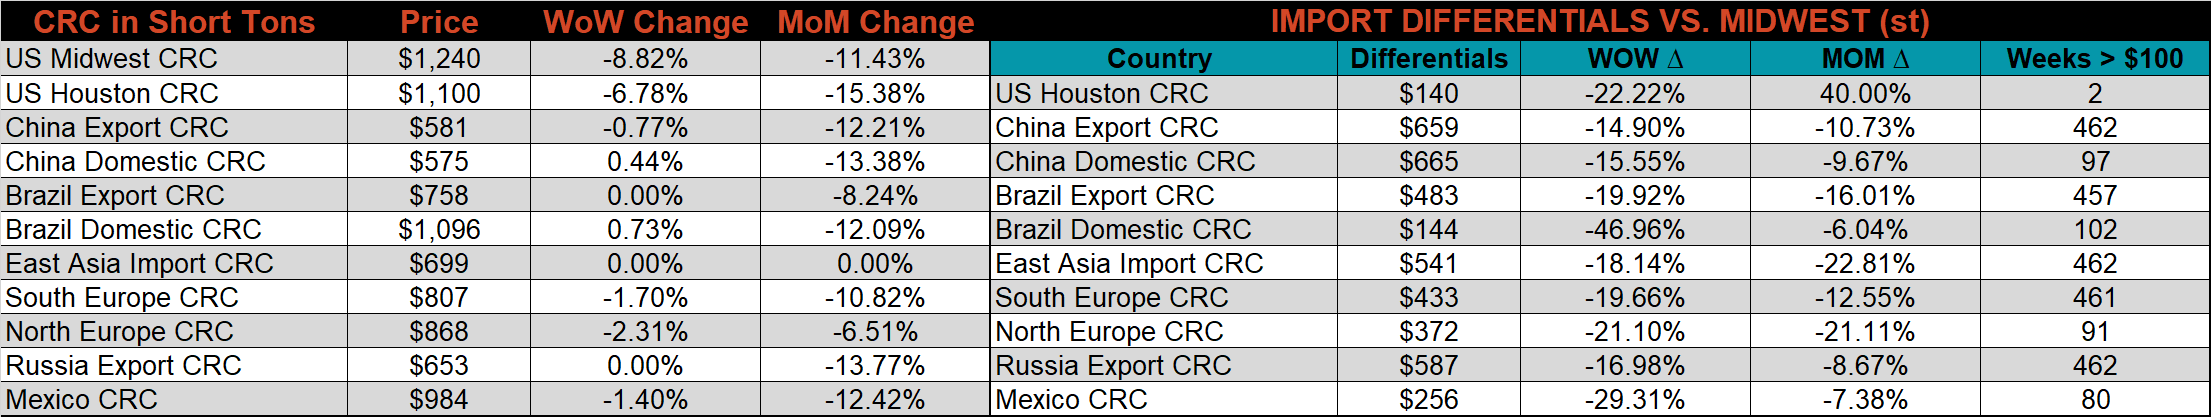
Global flat rolled indexes moved mostly lower, led by Midwest CRC down 8.8%, while Chinese export HRC gained 1.2%.
The AISI Capacity Utilization was up 0.9% to 79.6%. Slightly above the lowest level of utilization since the initial COVID recovery, in May of 2021.
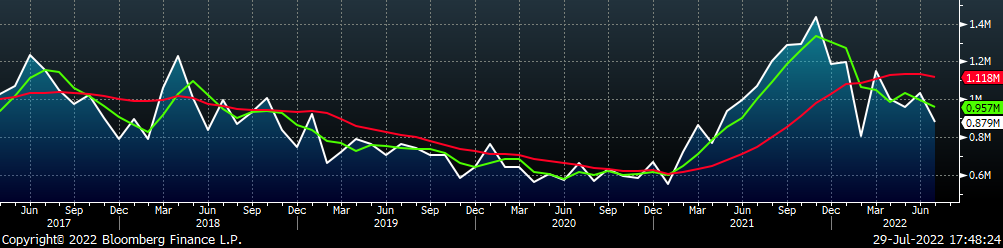
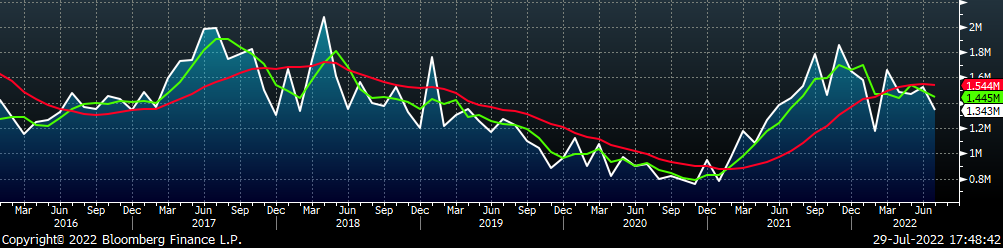
July flat rolled import license data is forecasting a decrease of 154k to 879k MoM.
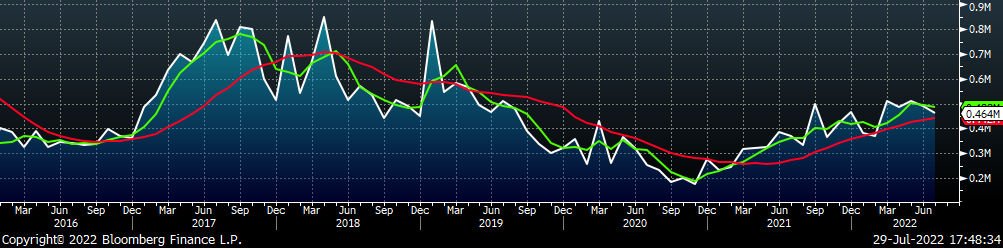
Tube imports license data is forecasting a decrease of 26k to 464k in July.
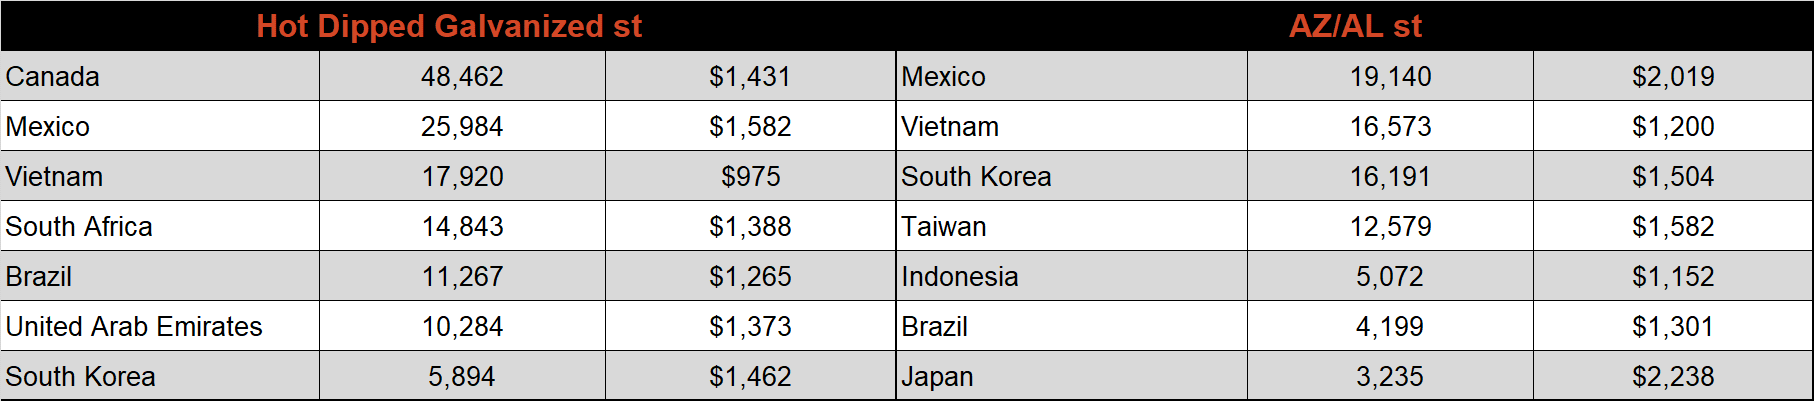
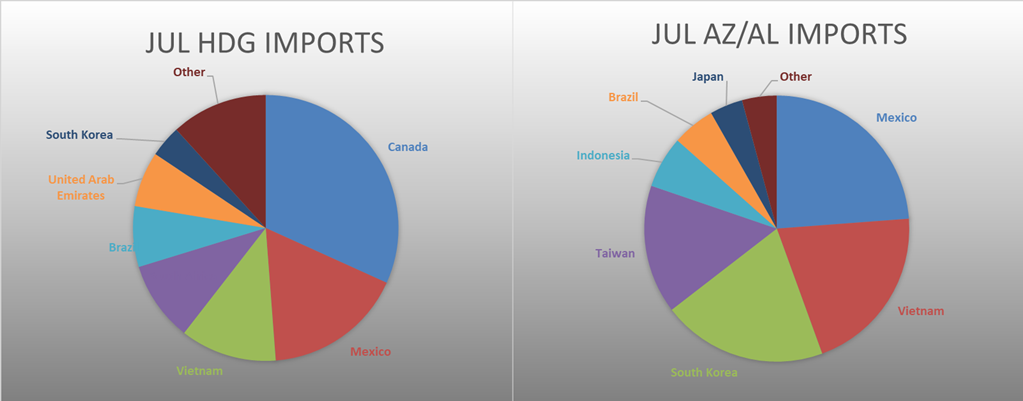
July AZ/AL import license data is forecasting a decrease of 10k to 90k.
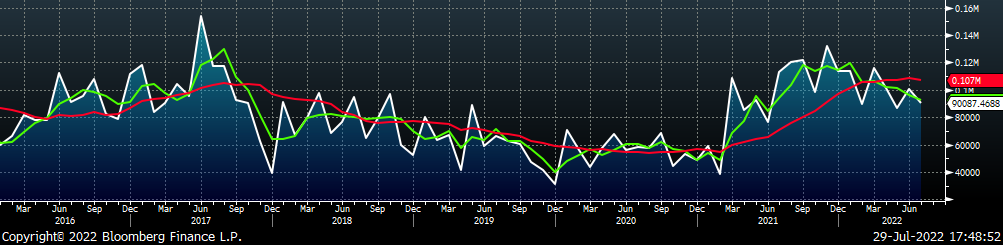
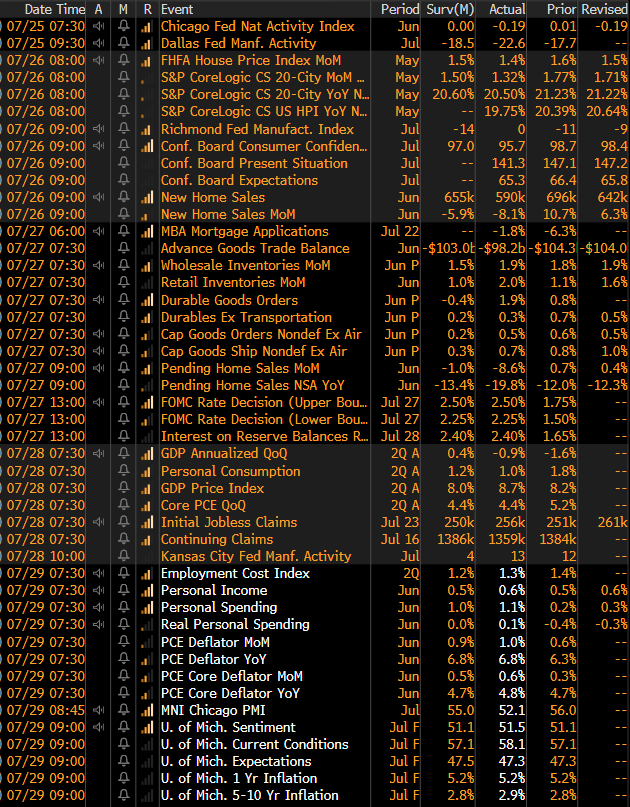
Below is July import license data through July 25th, 2022.
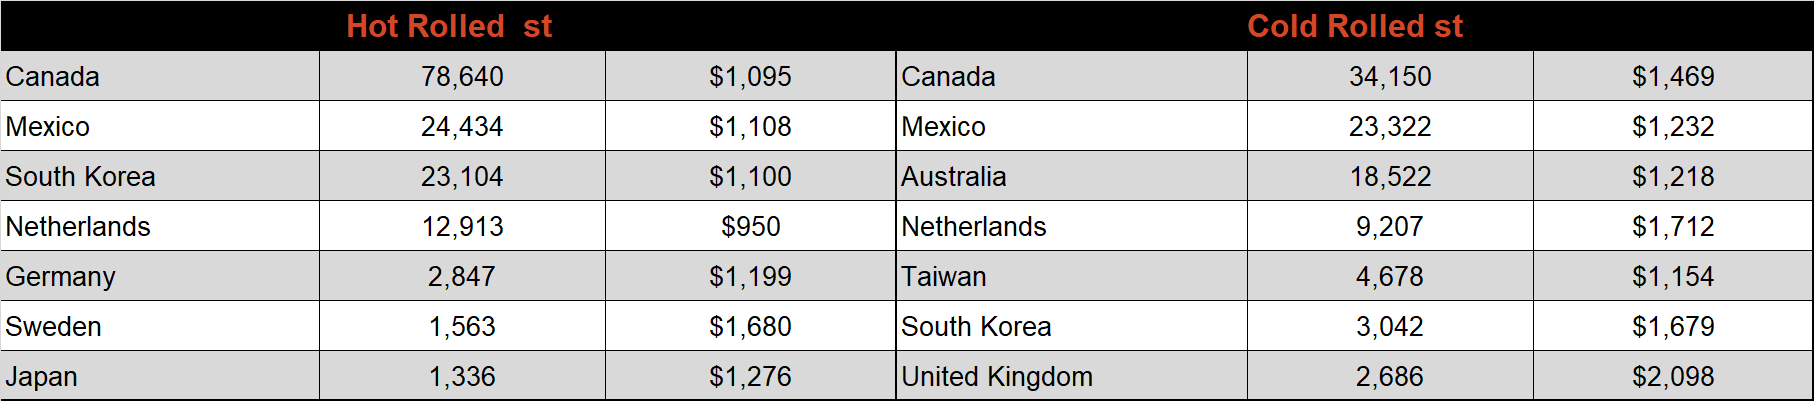
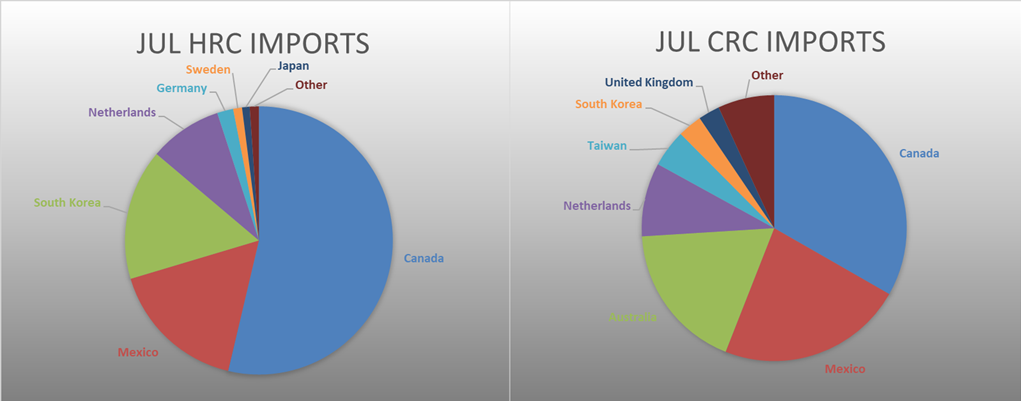
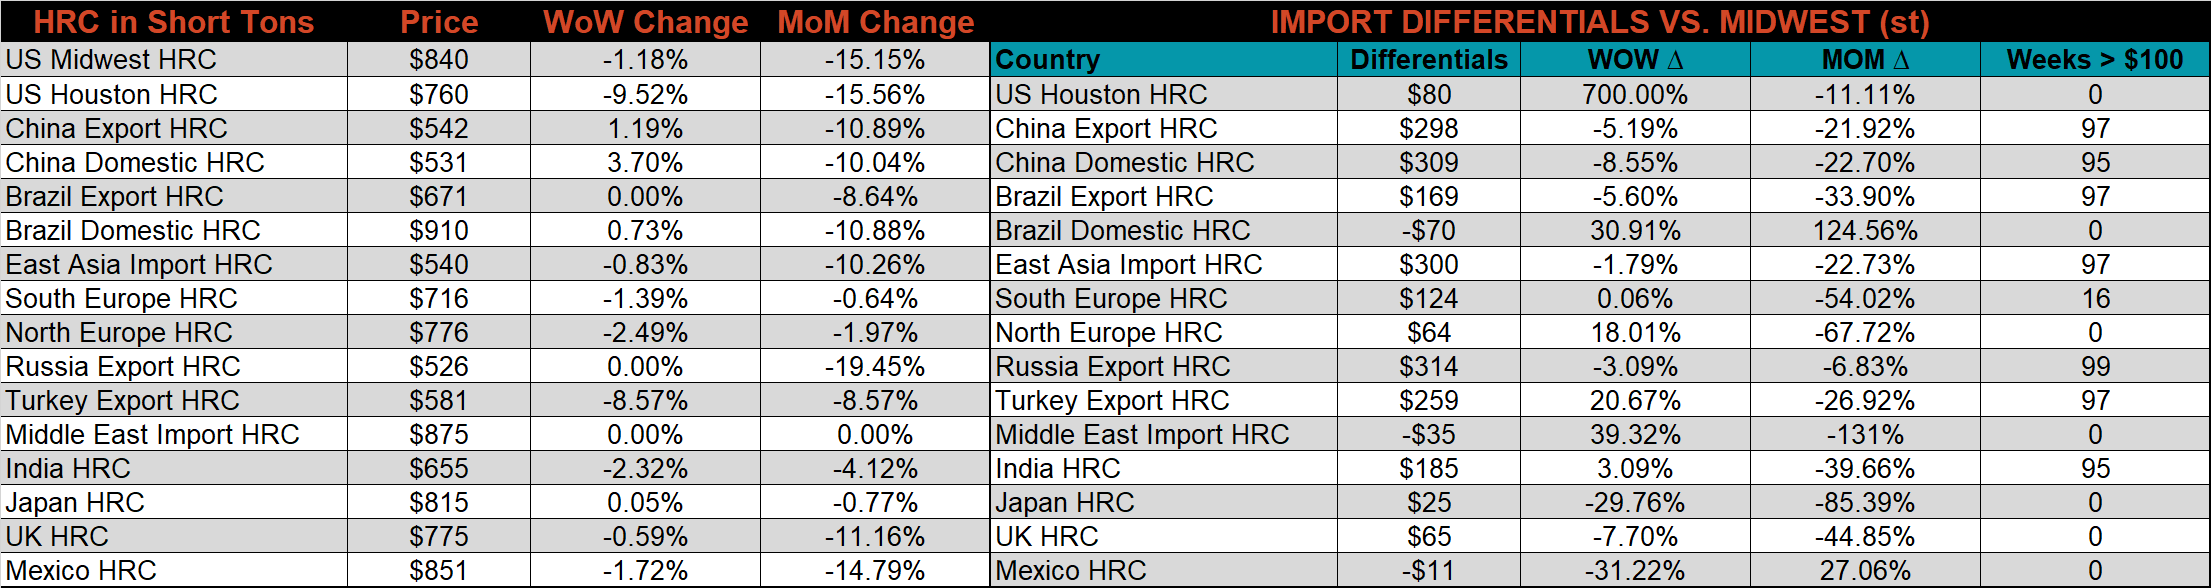
Below is the Midwest HRC price vs. each listed country’s export price using pricing from SBB Platts. We have adjusted each export price to include any tariff or transportation cost to get a comparable delivered price. Differentials increased for Turkey and Europe but continued to trend lower for the rest of the world.
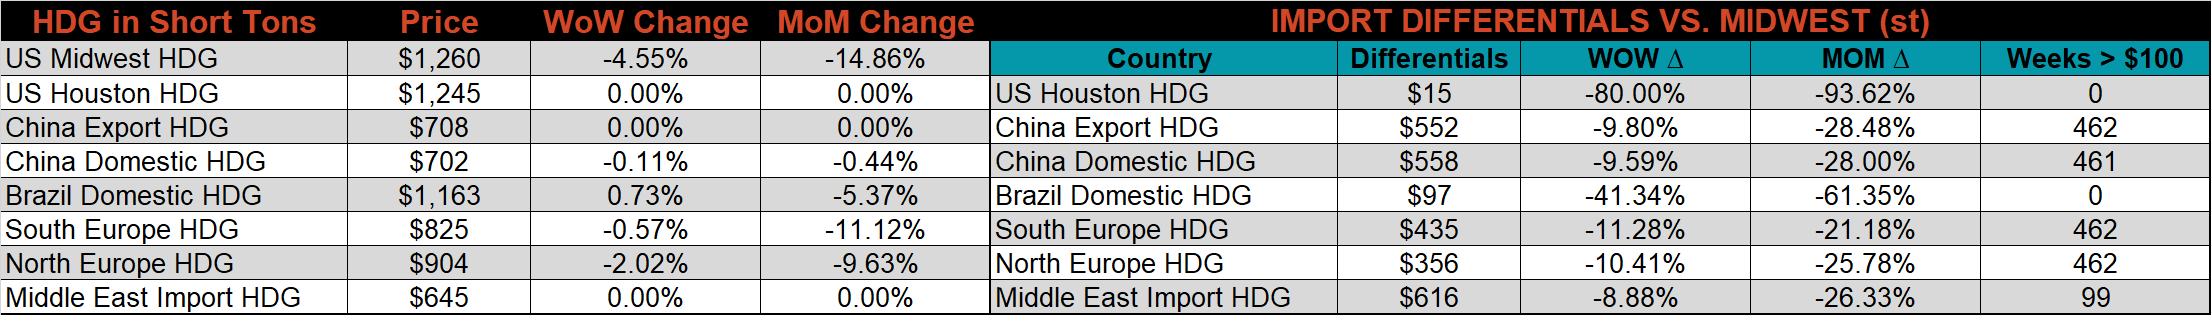
SBB Platt’s CRC, HDG, and HRC pricing is below. The Midwest CRC price was down 8.8%, HDG fell 4.6%, and HRC fell 1.2%.
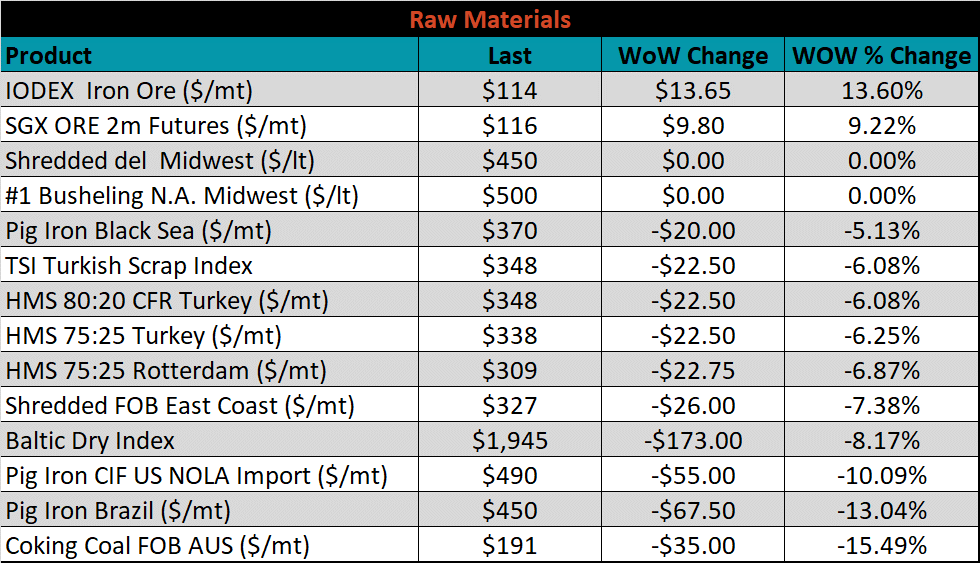
Raw material prices moved mostly lower last week with losses led by Aussie coking coal, down 15.5%, while the IODEX iron ore index was up 13.6%
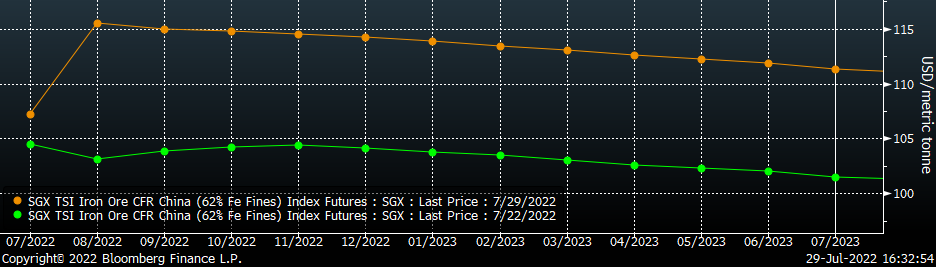
Below is the iron ore future curve with Friday’s settlements in orange, and the prior week’s settlements in green. Last week, the entire curve shifted sharply higher, most significantly in the front.
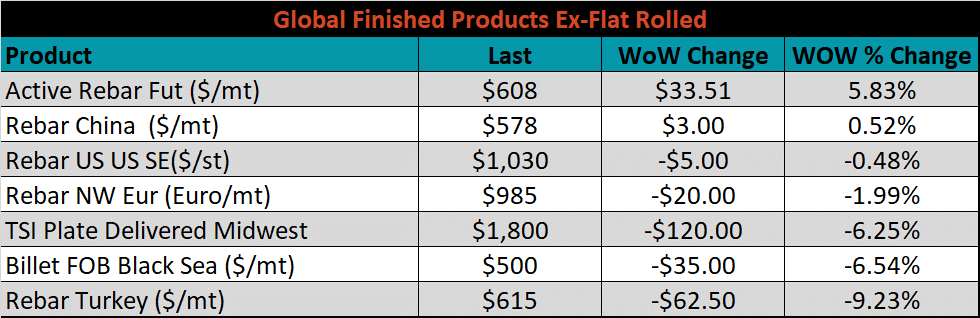
The ex-flat rolled prices are listed below.

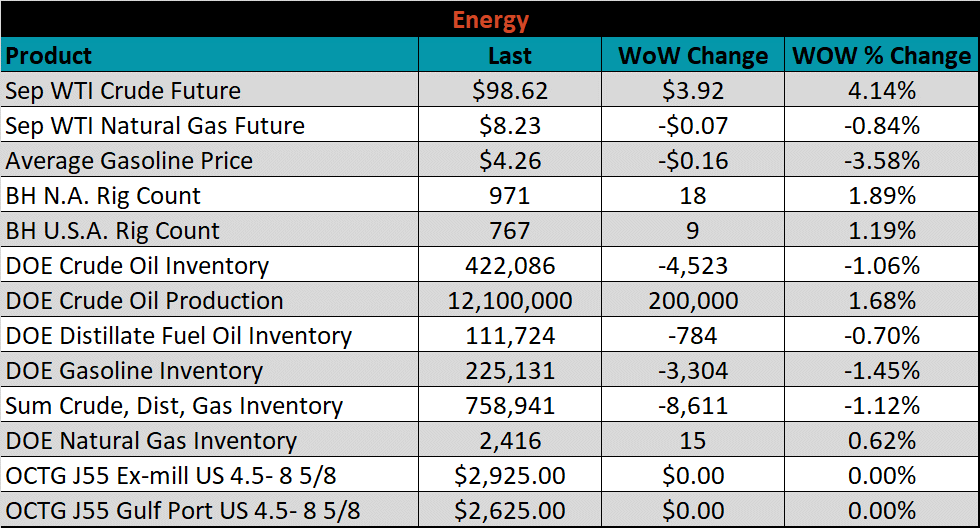
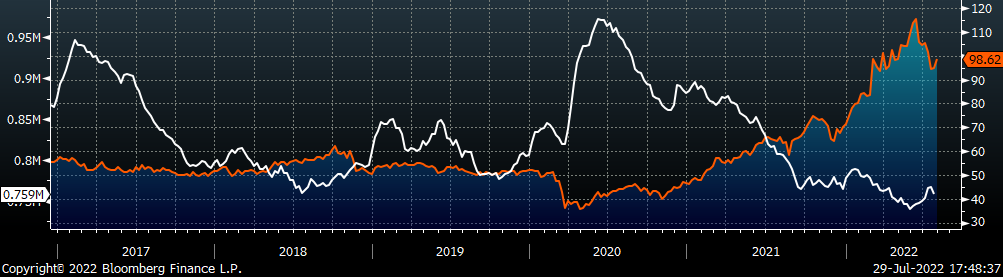
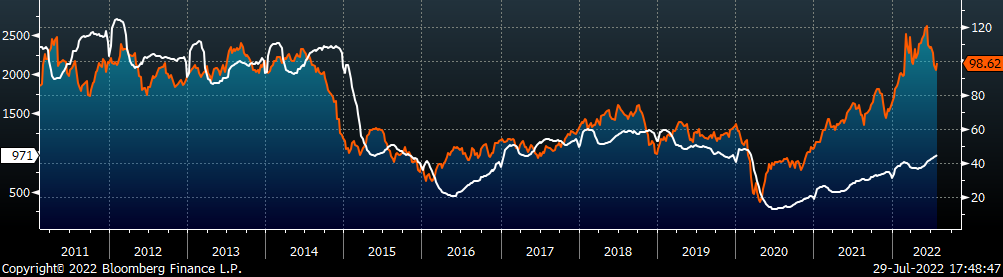
Last week, the September WTI crude oil future rose $3.92 or 4.1% to $98.62/bbl. The aggregate inventory level decreased 1.1%. The Baker Hughes North American rig count increased 18 rigs, while the U.S. rig count increased 9 rigs.
The list below details some upside and downside risks relevant to the steel industry. The bolded ones are occurring or highly likely.
Upside Risks:
Downside Risks: