Content
-
Weekly Highlights
- Market Commentary
- Risks


For the seventh straight week, spot HRC prices declined to a new low for the year and to the lowest levels since early 2016. Spot transactions, while still scarce, are occurring slightly below $450/st, but may have found a short-term bottom as mills have pulled back from negotiating below that level. Near the end of last week, there were rumors of a possible price increase from Nucor, signaling the mini mills also saw justification in their order books for higher prices. This rumor never materialized into an announcement, leaving questions about the strength of the market and the likelihood that this bottom will hold. This week, we will discuss the factors that are contributing to the upward price pressure, and whether they are enough to put in a bottom and drive spot prices higher.
The below dynamics, which also appear in our upside price risks listed below, have all grown in influence over the past two months:
While no individual factor above will stop the current decline, together they begin to build the case for the bottom being near. However, the spot price has steadily declined even while these upside risk existed over the past month. These factors may support the recent price increases and higher offers from mills, but mills are likely just posturing as they focus on index prints during the second week of the month, which sets the price for the majority of their contract sales. The price for these contracts will likely be slightly below the levels of July, but this expected price has fallen over the past few weeks, leading us to believe that buyers have likely placed August contract tonnage amounts closer to their minimum required for the month. Therefore, it is doubtful that there will be significant restocking to shore up weak order books. Additionally, the scrap outlook for August is showing another decline, which will also weigh on finished product prices. Until we see the scrap market turn around and lead times push out, it is unlikely that we will see a long-term price bottom form.
With that being said, the upside price pressure grows stronger the longer spot prices remain depressed, increasing the magnitude of the next price rally. When steel prices increase, they tend to do so quickly, so make sure you take advantage of the historically low spot and curve prices while they are still available.
Below are the most pertinent upside and downside price risks:
Upside Risks:
Downside Risks:
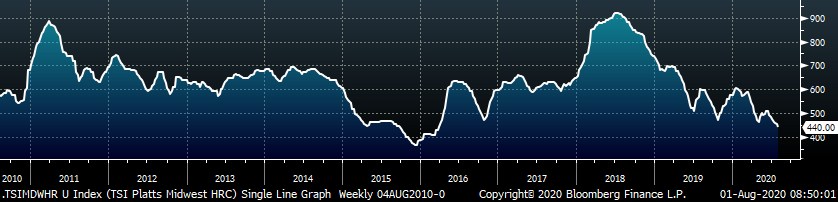
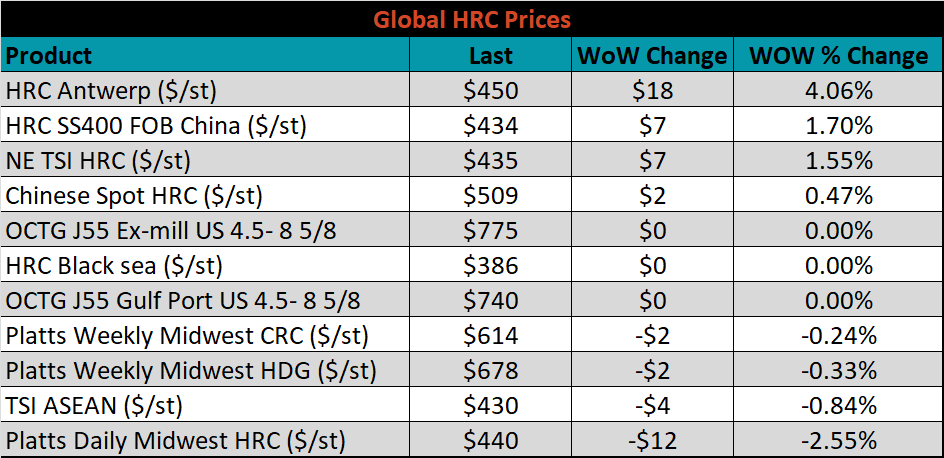
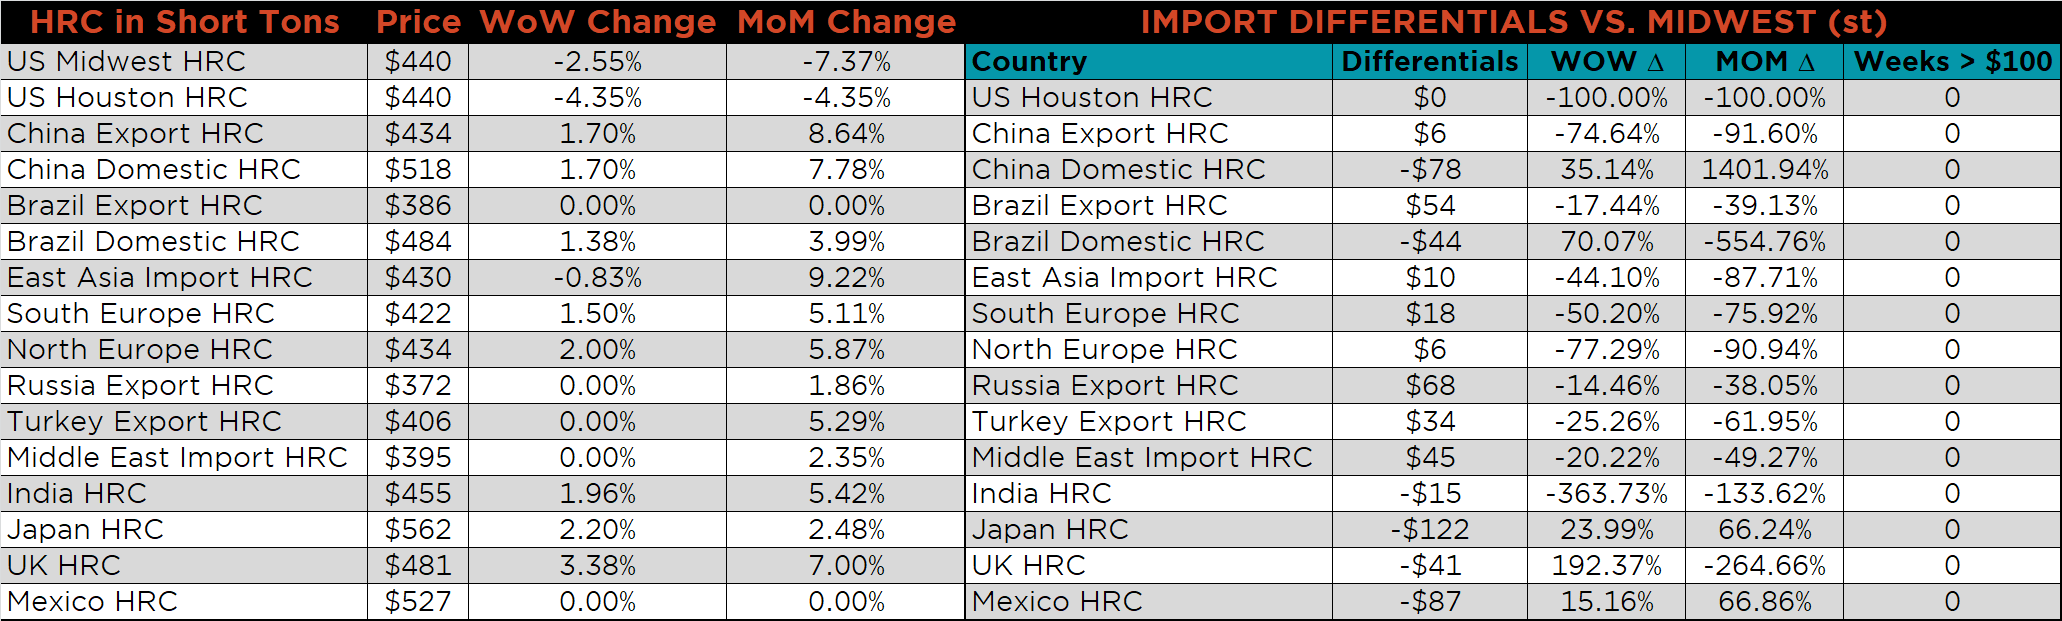
The Platts TSI Daily Midwest HRC Index was down $11.50 to $440.00.
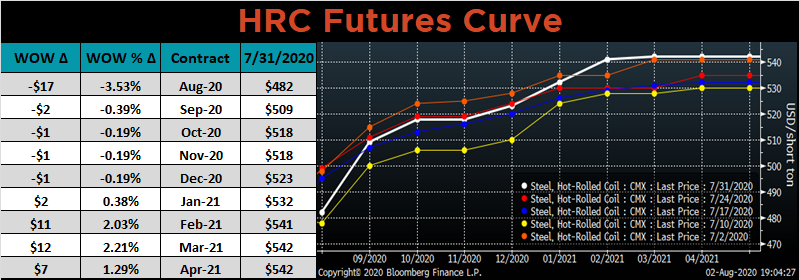
The CME Midwest HRC futures curve is below with last Friday’s settlements in white. Last week, the back of the curve shifted higher while the very front dropped.
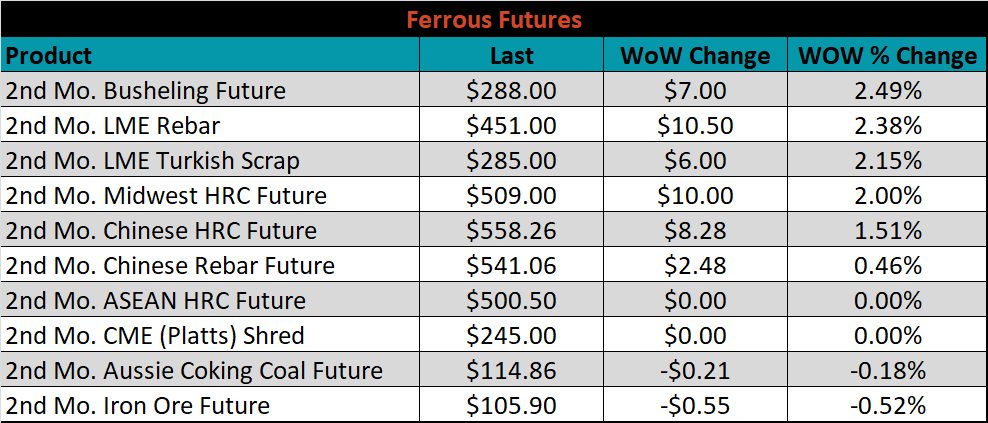
September ferrous futures were mostly higher, led by busheling, which gained another 2.5%.
The global flat rolled indexes were mixed. The TSI Antwerp HRC price was up 4.1%, while TSI Platts Midwest HRC was down 2.6%.
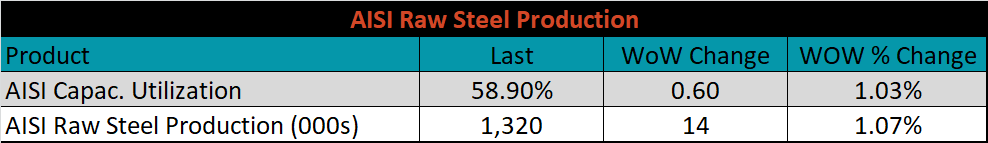
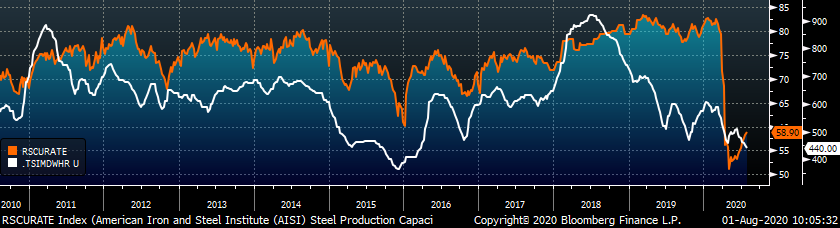
The AISI Capacity Utilization Rate continues to grind higher, up 0.6% to 58.9%.
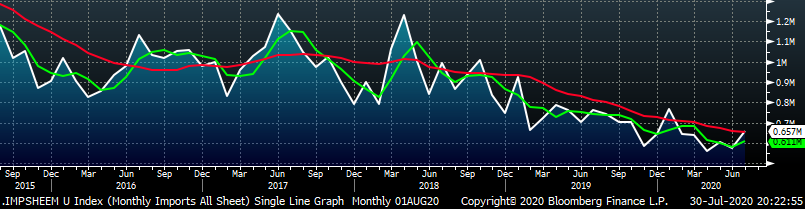
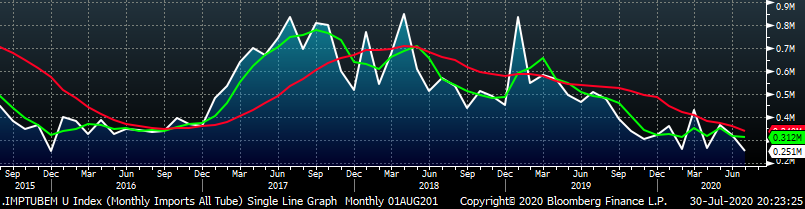
July flat rolled import license data is forecasting an increase of 83k to 657k MoM.
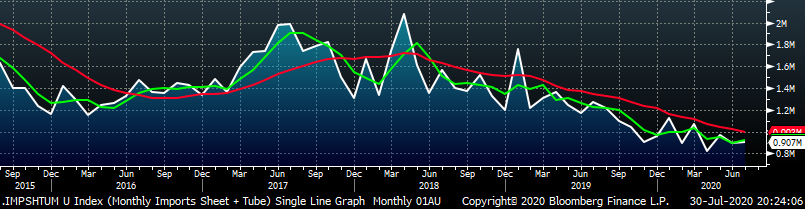
Tube imports license data is forecasting a MoM decrease of 72k to 251k tons in July.
AZ/AL import license data is forecasting a slight increase to 61k MoM.
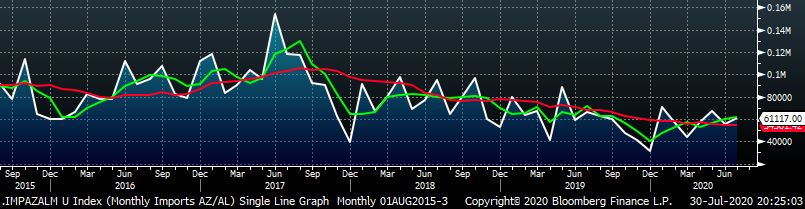
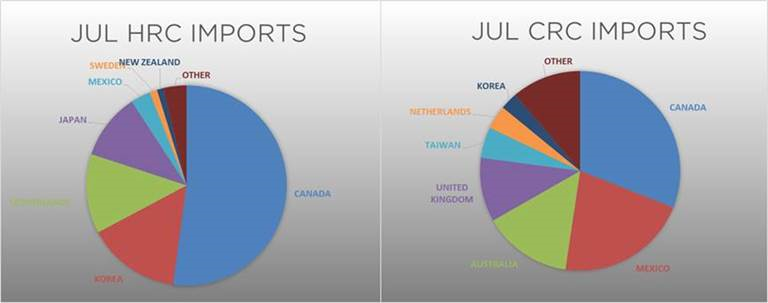
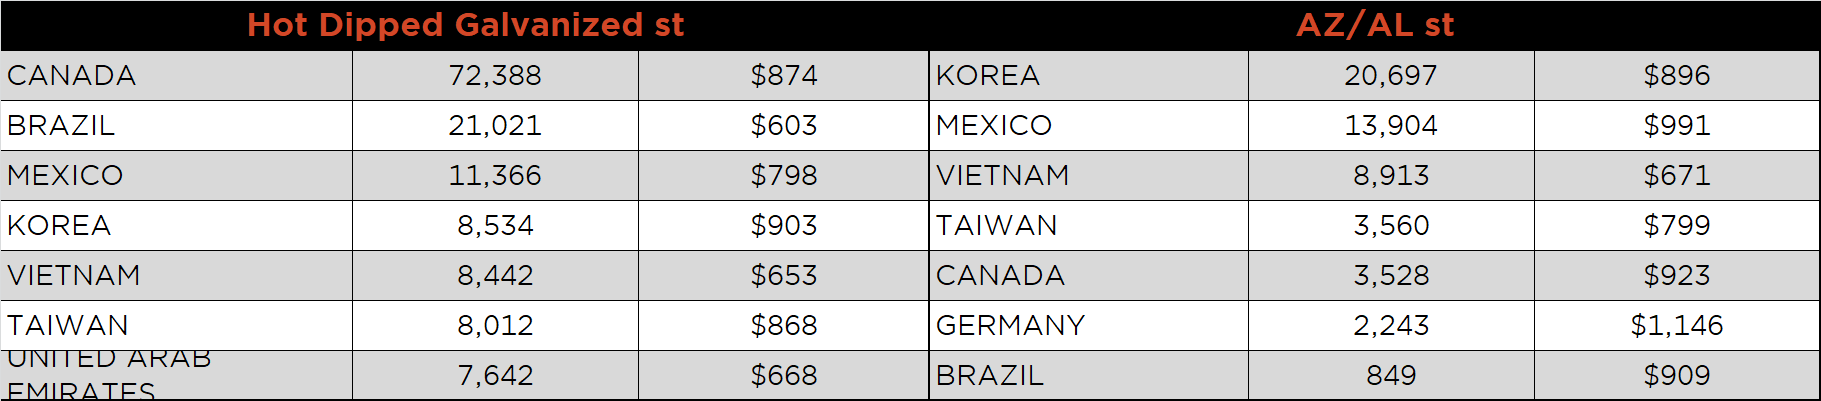
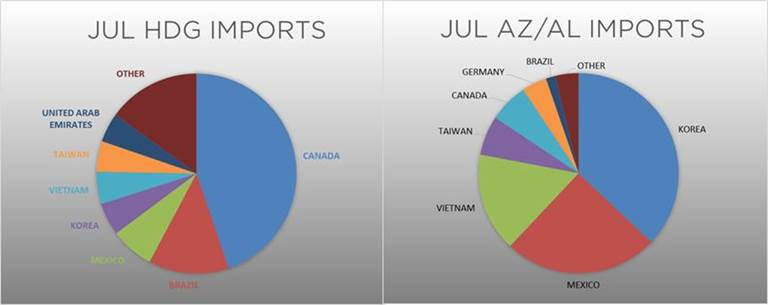
Below is July import license data through July 28, 2020.
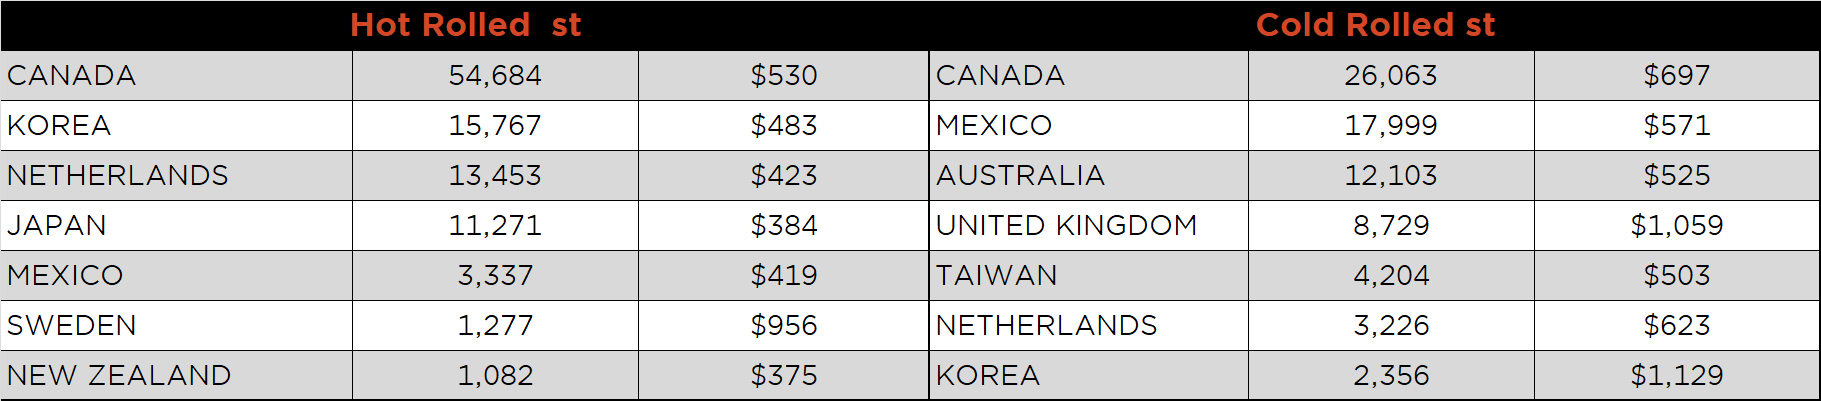
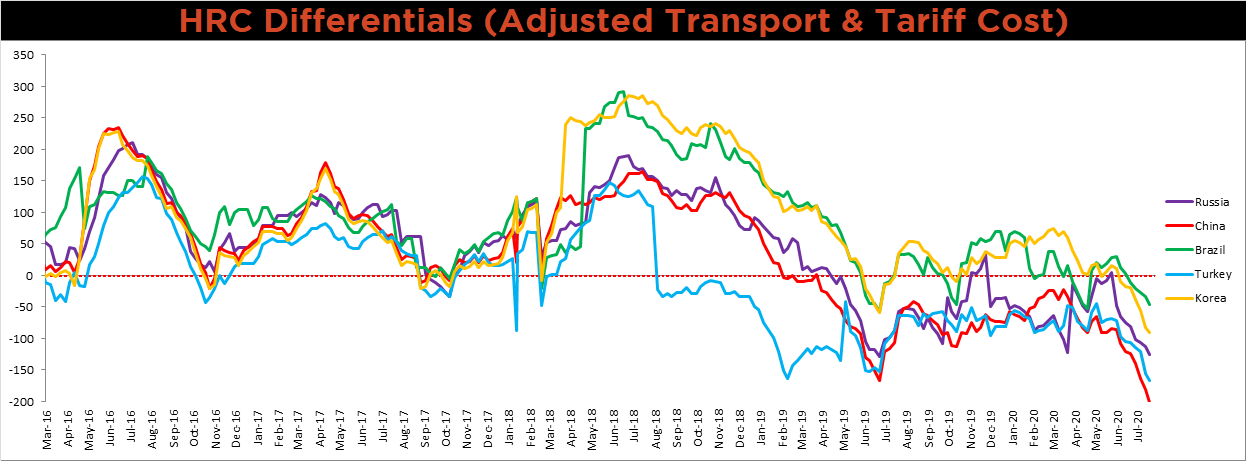
Below is the Midwest HRC price vs. each listed country’s export price using pricing from SBB Platts. We have adjusted each export price to include any tariff or transportation cost to get a comparable delivered price. All the global differentials continue to decrease to the lowest levels in recent history, as global prices rise and the U.S. price falls.
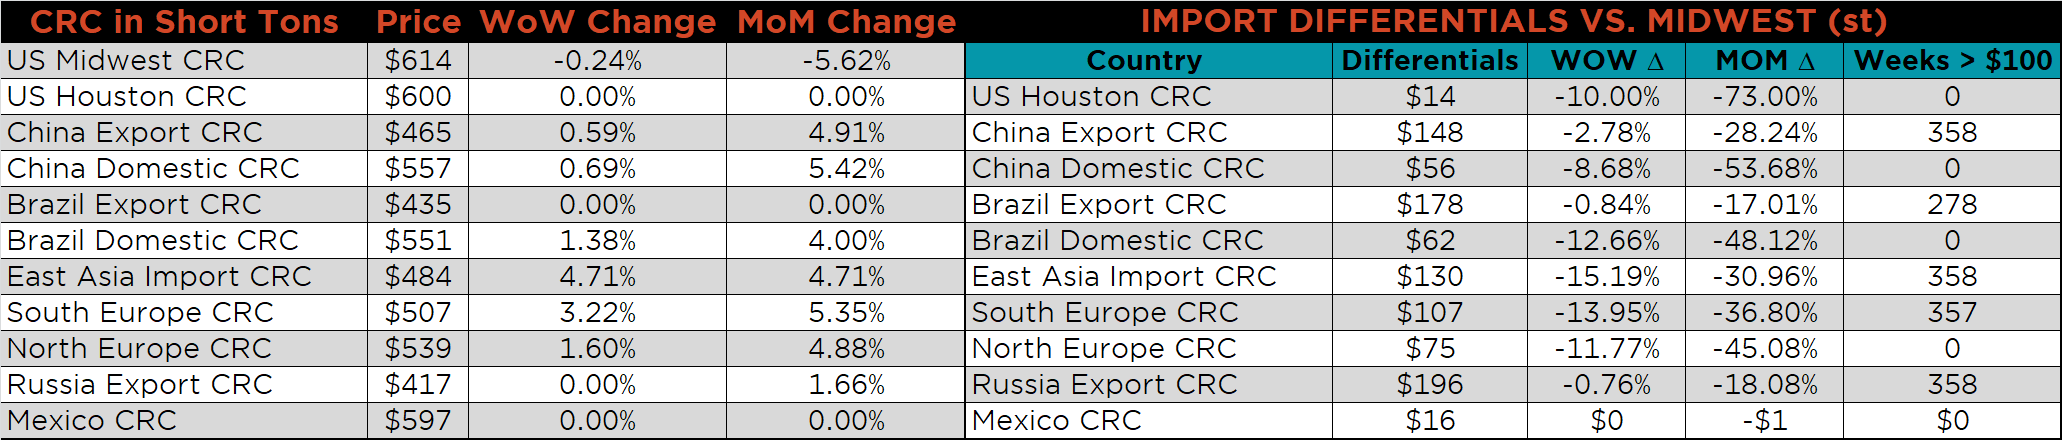
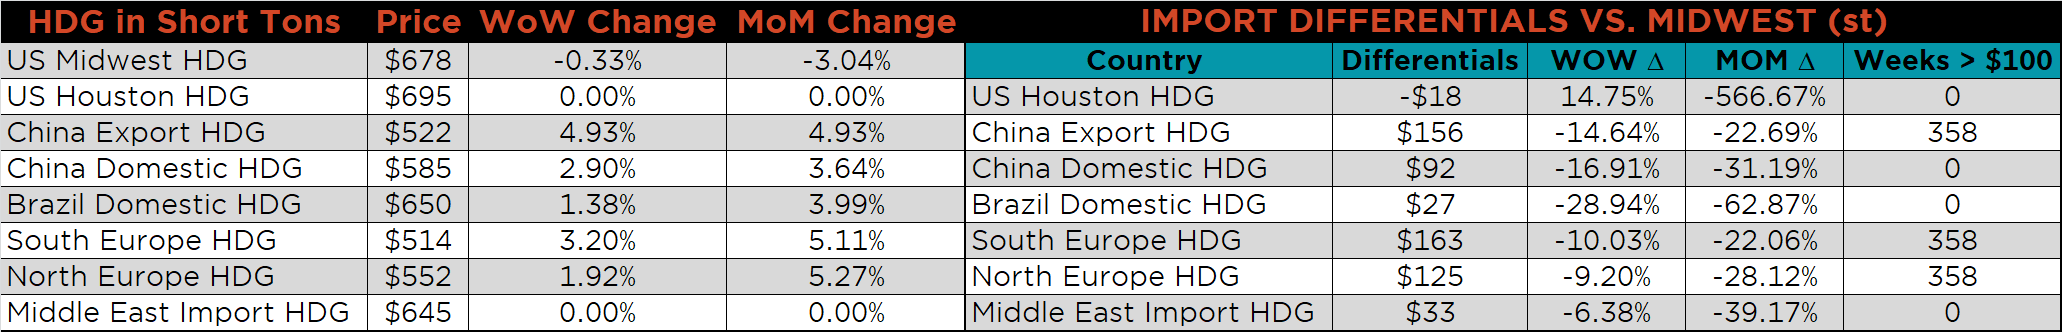
SBB Platt’s HRC, CRC and HDG pricing is below. The Midwest HRC, HDG, and CRC prices were down 2.6%, 0.3% and 0.2%, respectively. Globally, the China export HRC price was up another 1.7%.
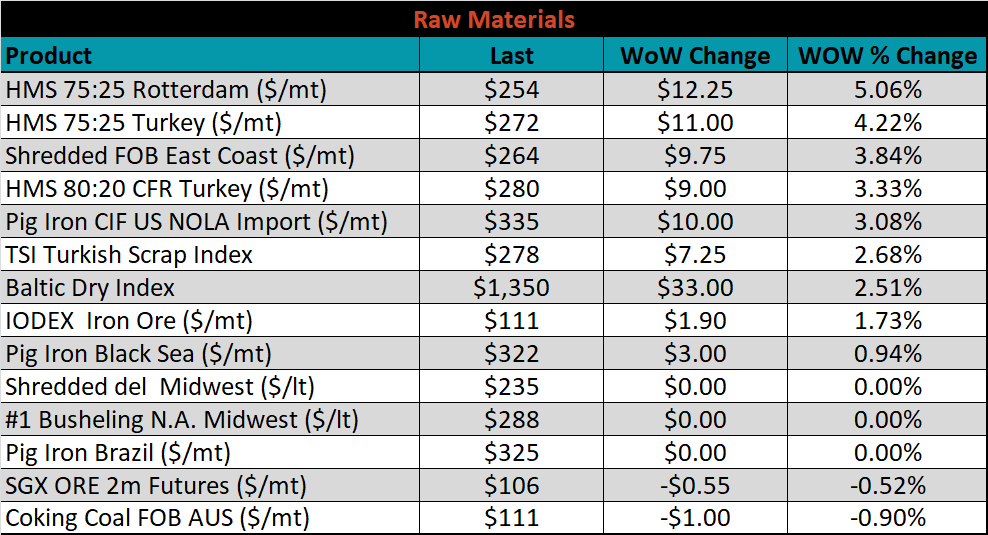
Raw material prices were mostly higher. Rotterdam HMS was up 5.1%, while Australian coking coal was down 0.9%.
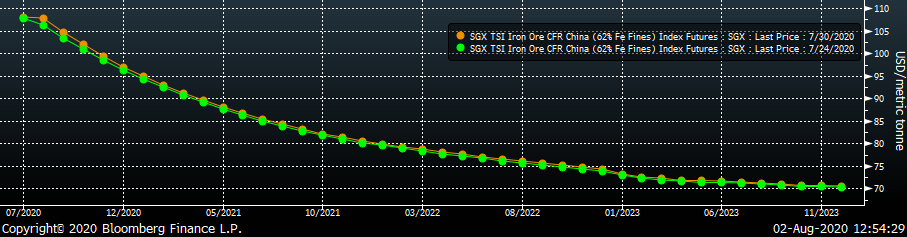
Below is the iron ore future curve with Friday’s settlements in orange, and the prior week’s settlements in green. The curve was slightly higher in the front.
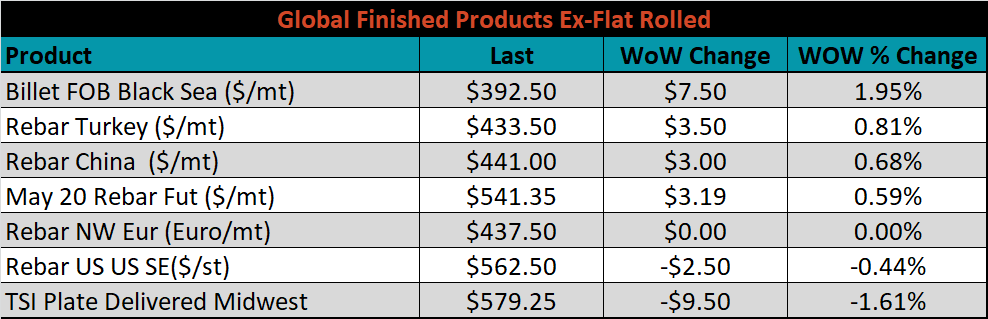
The ex-flat rolled prices are listed below.

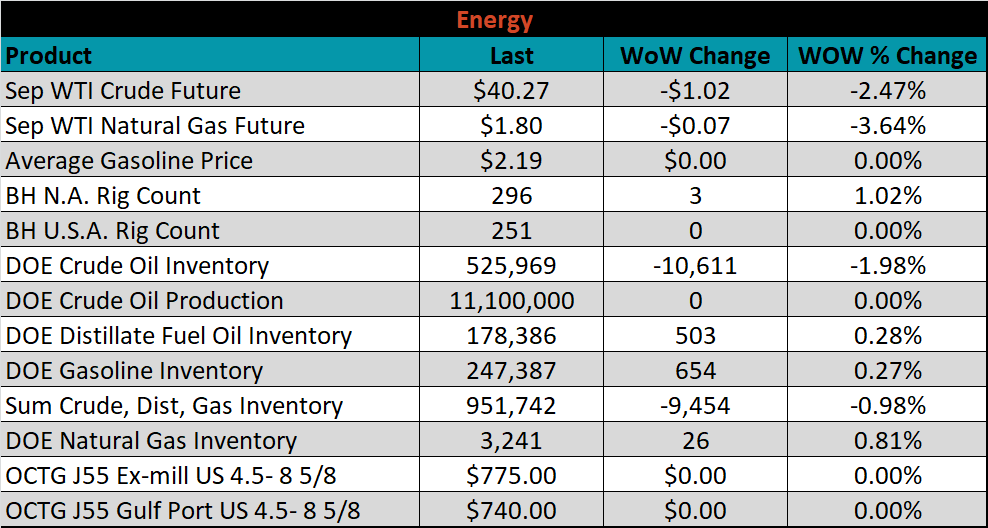
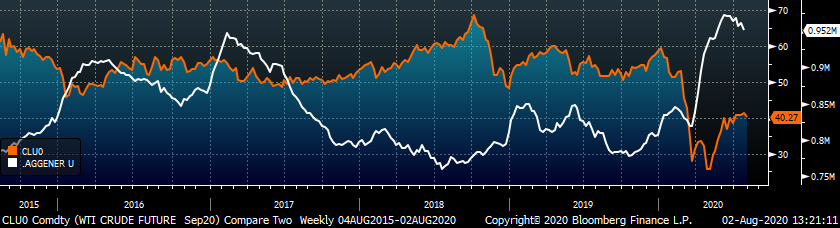
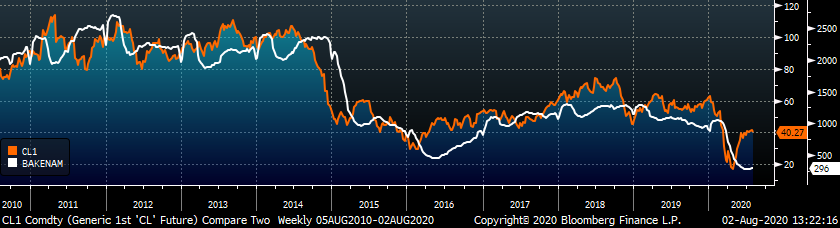
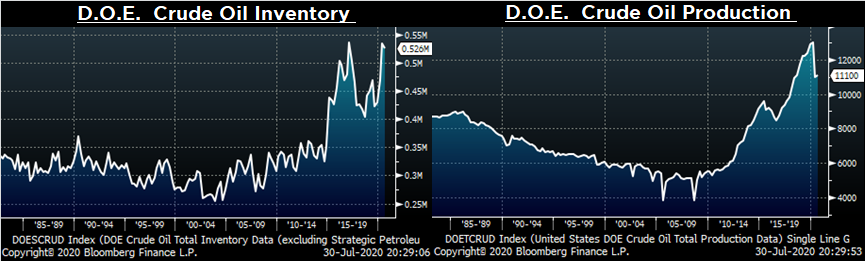
Last week, the September WTI crude oil future fell $1.02 or 2.5% to $40.27/bbl. The aggregate inventory level was down 1%, while crude oil production was flat at 11.1m bbl/day. The Baker Hughes North American rig count was up three rigs, while the U.S. rig count was flat.
The list below details some upside and downside risks relevant to the steel industry. The orange ones are occurring or look to be highly likely. The upside risks look to be in control.
Upside Risks:
Downside Risks: