

July 8, 2022

Market Commentary
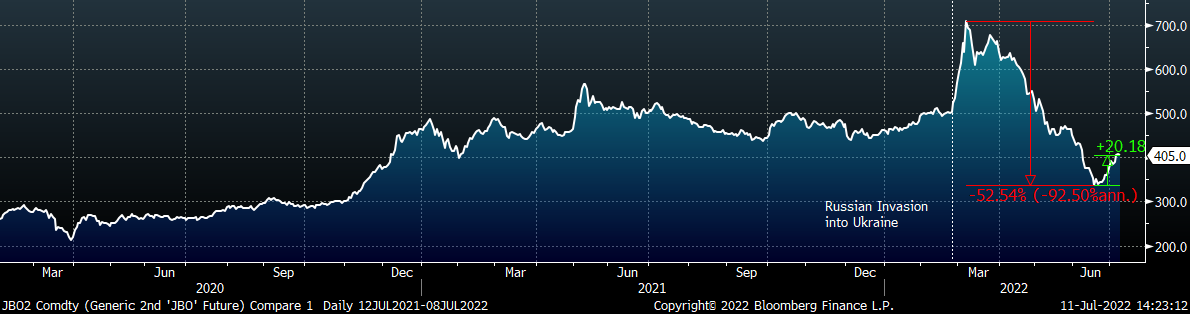
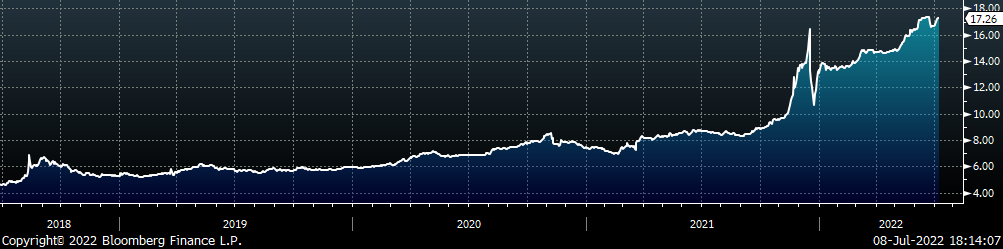
After an initial panic around a scrap shortage caused by the Russian Invasion into Ukraine, the price of Turkish scrap skyrocketed in the physical and financial markets along with every other commodity. Since late March, it steadily sold off until rebounding above the $350 level mid-June. Up to this point, the rally in Turkish Scrap has been an anomaly among the ferrous markets, as Turkish mills have recently needed to restock scrap amid an uptick in demand for rebar. The sustainability of the rally is highly uncertain, but it is an important reminder that each market will be impacted by both macro and domestic forces and that prices will not go down forever. The current price is 20% below pre-invasion levels, but it is 90% higher than its pre-COVID rally low in March of 2020.
Durable Goods
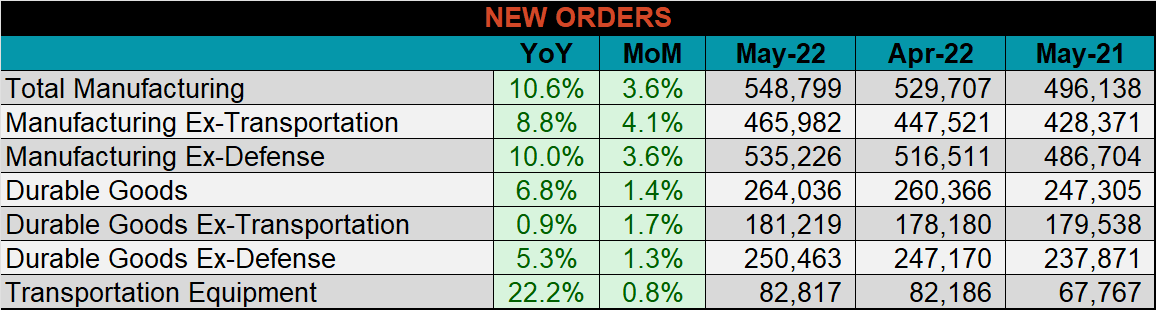
Below are final May new orders from the Durable Goods report (NSA), which were up compared to both April and May of last year. Transportation Equipment new orders were up 8.8% compared to April and 4.1% compared to May of last year.
May U.S. Durable Goods New Orders NSA
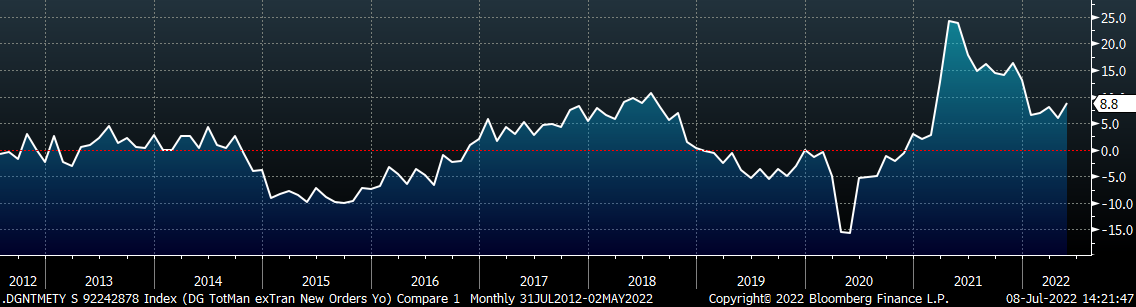
U.S. Total Manufacturing New Orders Ex-Transportation NSA YoY % Change
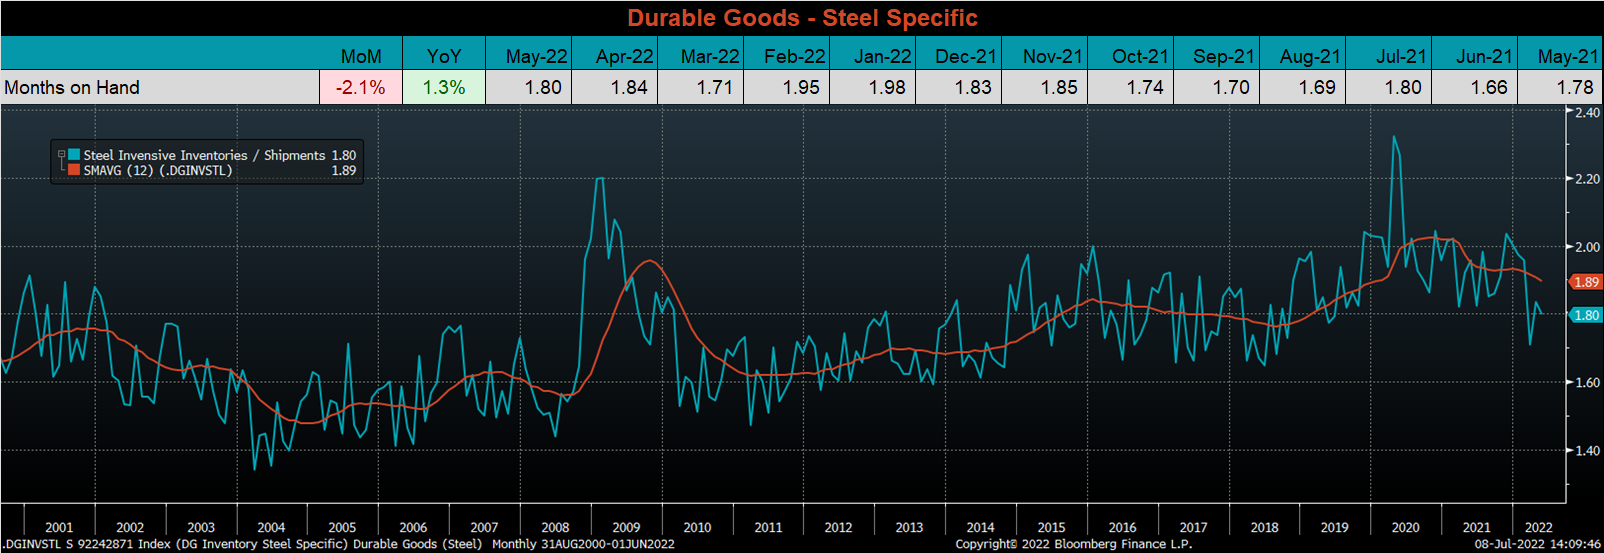
The chart looks at the months on hand (inventory divided by shipments) for durable goods categories that are steel intensive. The move lower occurred because of a more significant increase in shipments than inventories, each up 3.2% and 1.2%, respectively. A slowdown in activity could lead to a sharp increase in MoH, as inventory values have increased 16 out of the last 17 months.
Auto Sales
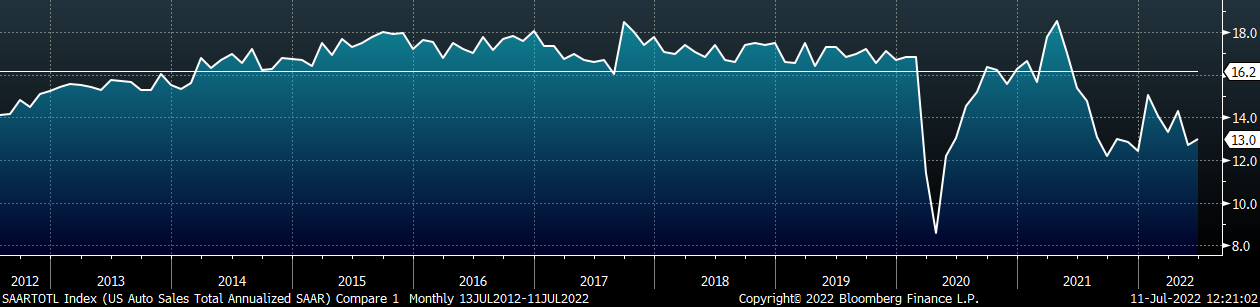
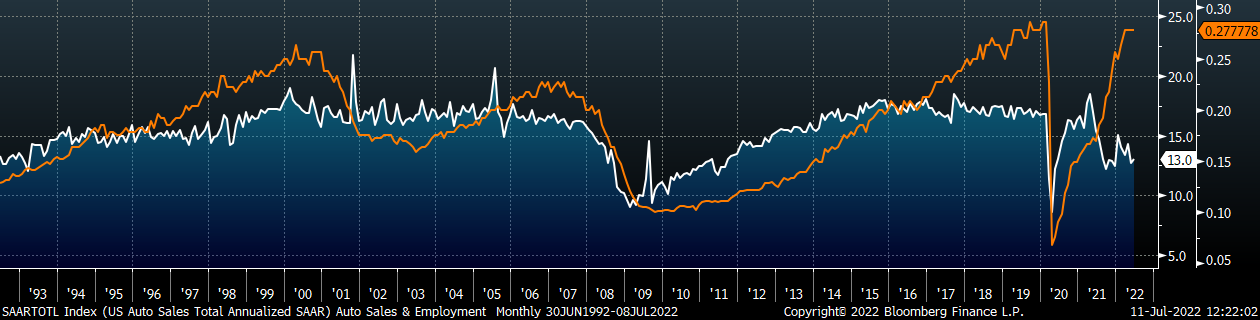
June U.S. light vehicle sales rose to a 14.3M seasonally adjusted annualized rate (S.A.A.R) they continued to be well below the 10-year average of 16.2m, as supply chain woes continue to impact both production and sales within the sector. The second chart shows the relationship between the unemployment rate and auto sales. The unemployment rate is inverted to show that declining unemployment typically leads to increasing auto sales. The labor market remains strong, and the unemployment rate was unchanged, which has led us to believe there will be a strong backlog for auto demand once the chip shortage is resolved. The gap between auto sales and the labor market continues to be historically wide driven by supply chain shortages.
June U.S. Auto Sales (S.A.A.R.)
June U.S. Auto Sales (orange) and the Inverted Unemployment Rate (white)
Risks
Below are the most pertinent upside and downside price risks:
Upside Risks:
- China reopening its economy with further stimulus measures
- Unplanned & extended planned outages, including operational issues leaving mills behind
- Seasonal pick-up in demand leading to regional shortages
- Easing supply chain restraints and labor shortages causing an increase in manufacturing activity
- Reluctance in placing import orders, leading to a dramatic reduction in arrivals later this year
Downside Risks:
- Decreasing input costs allowing mills to aggressively sell lower while remaining profitable
- Increased domestic production capacity leading to an increase in competitive pricing
- Steel consumers substitute to lower-cost alternatives
- Limited desire to restock at elevated prices and persistently short lead times causing a “Buyer’s Strike”
- Economic slowdown caused by increasing interest rates
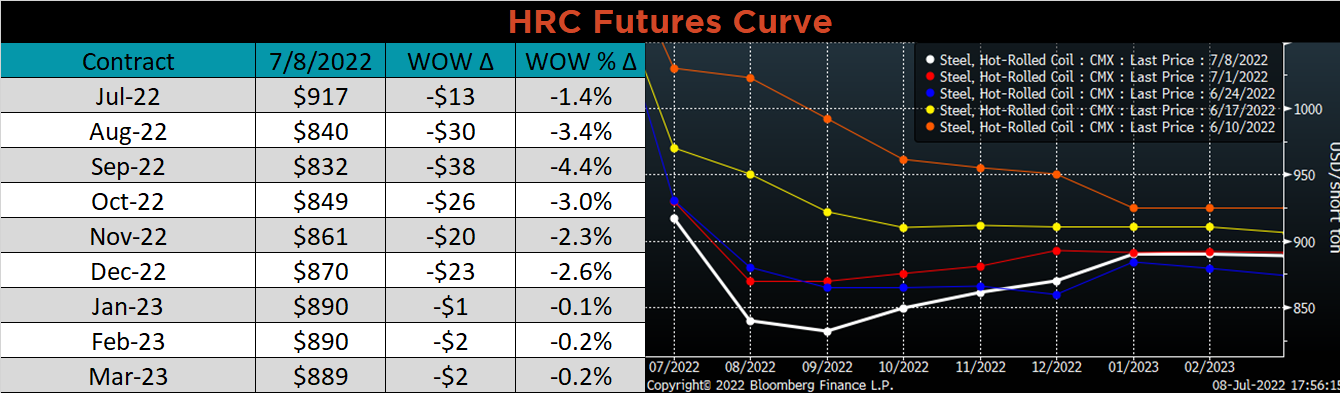
HRC Futures
All of the below data points are as of July 8, 2022.
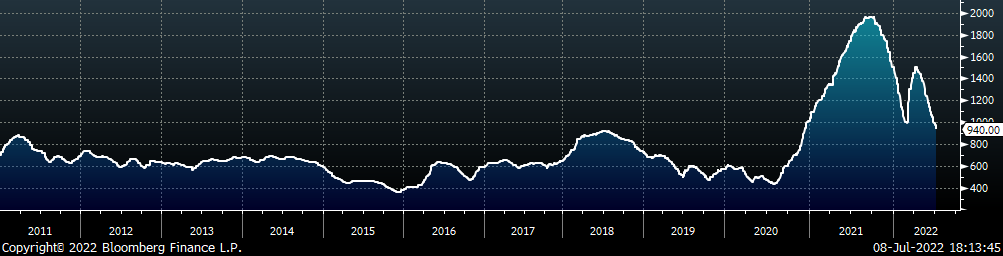
The Platts TSI Daily Midwest HRC Index was down $50 to $940.
Platts TSI Daily Midwest HRC Index
The CME Midwest HRC futures curve is below with last Friday’s settlements in red. The front of the curve was under the most pressure and the result was steeper contango, which suggests the market is currently oversupplied. This dynamic happened briefly in February, before the Russian invasion into Ukraine occurred.
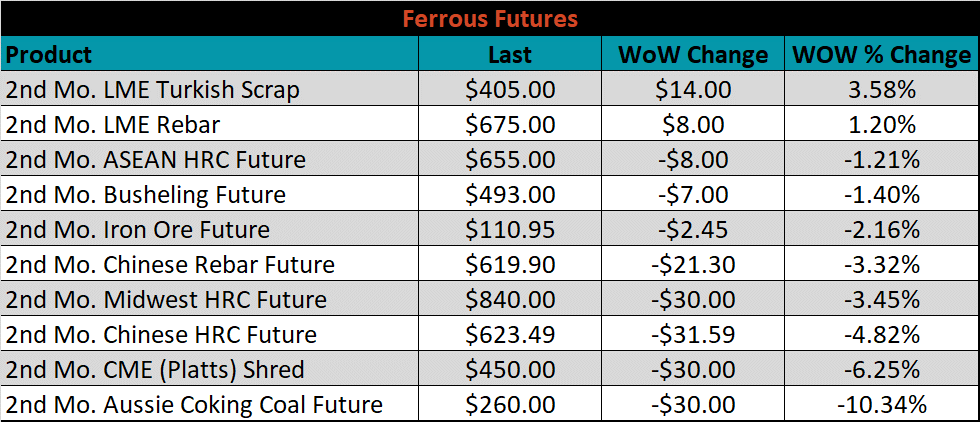
The 2nd month ferrous futures were mostly lower this week. Aussie Coking Coal fell once again, down 10.3% while LME Turkish Scrap gained for the second week, up 3.6%.
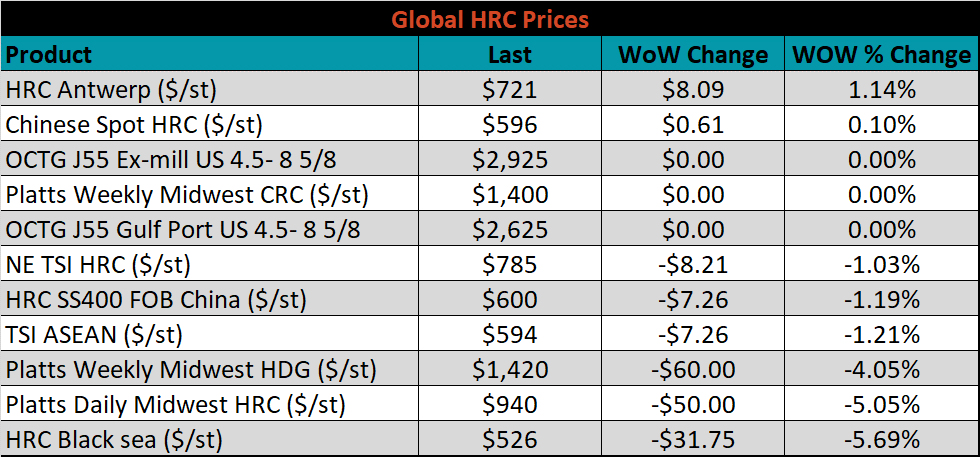
Global flat rolled indexes moved mostly lower, led again by HRC Black Sea, down 5.7%, while HRC Antwerp gained 1.1%.
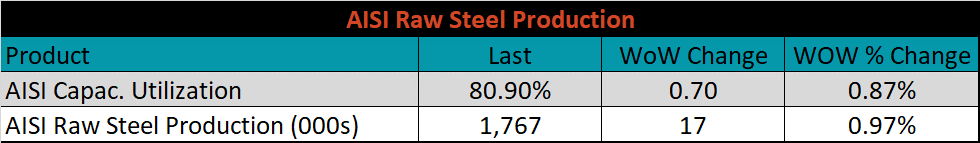
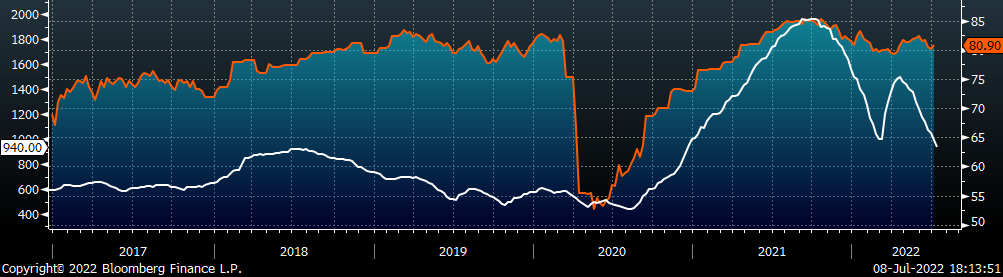
The AISI Capacity Utilization was up 0.9% to 80.9%.
AISI Steel Capacity Utilization Rate (orange) and Platts TSI Daily Midwest HRC Index (white)
Imports & Differentials
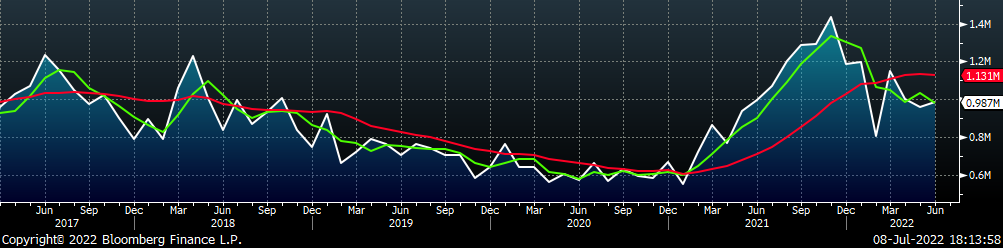
June flat rolled import license data is forecasting an increase of 29k to 987k MoM.
All Sheet Imports (white) w/ 3-Mo. (green) & 12-Mo. Moving Average (red)
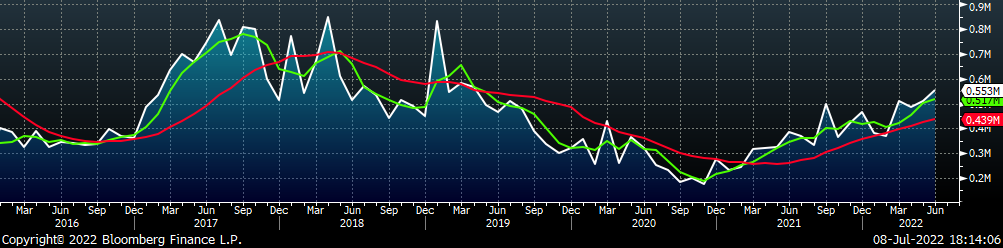
Tube imports license data is forecasting a decrease of 42k to 553k in June.
All Tube Imports (white) w/ 3-Mo. (green) & 12-Mo. Moving Average (red)
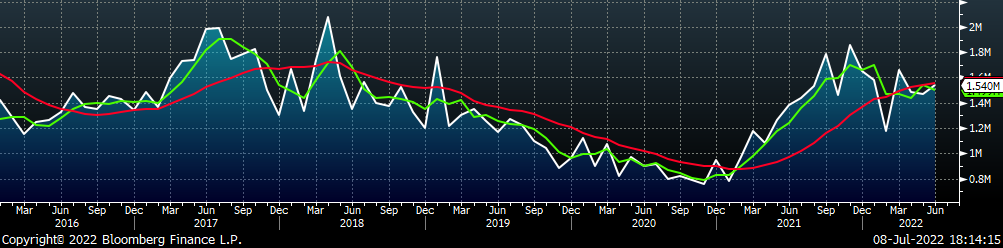
All Sheet plus Tube (white) w/ 3-Mo. (green) & 12-Mo. Moving Average (red)
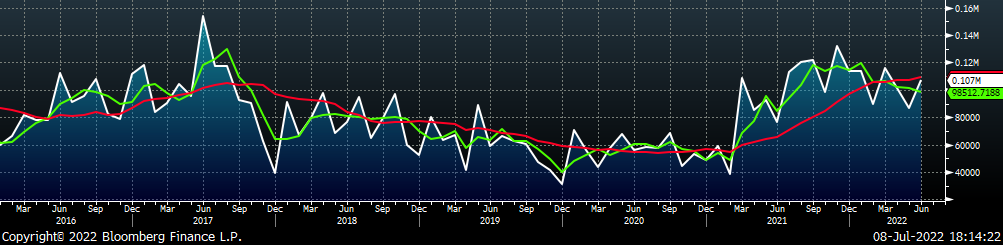
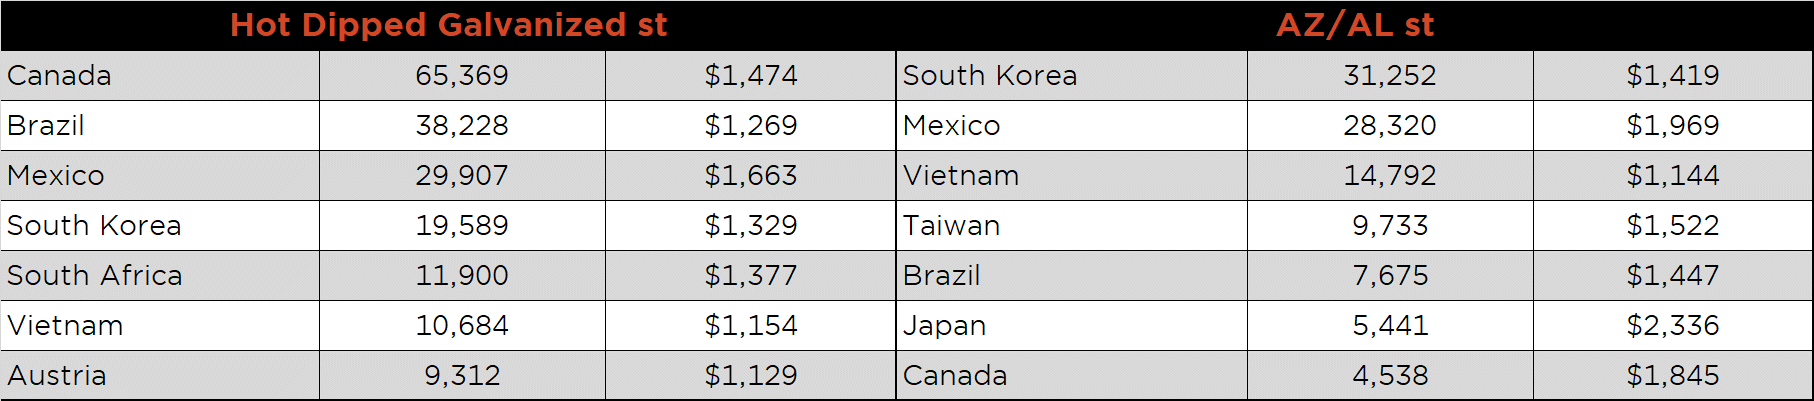
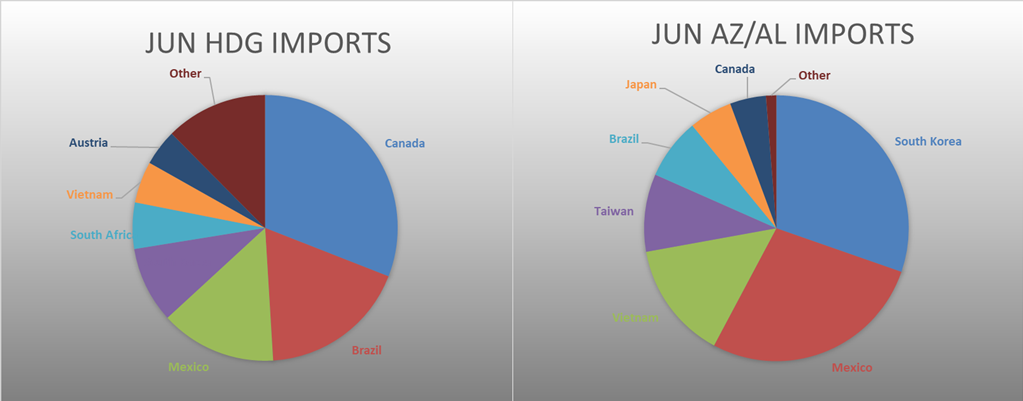
June AZ/AL import license data is forecasting an increase of 20k to 107k.
Galvalume Imports (white) w/ 3 Mo. (green) & 12 Mo. Moving Average (red)
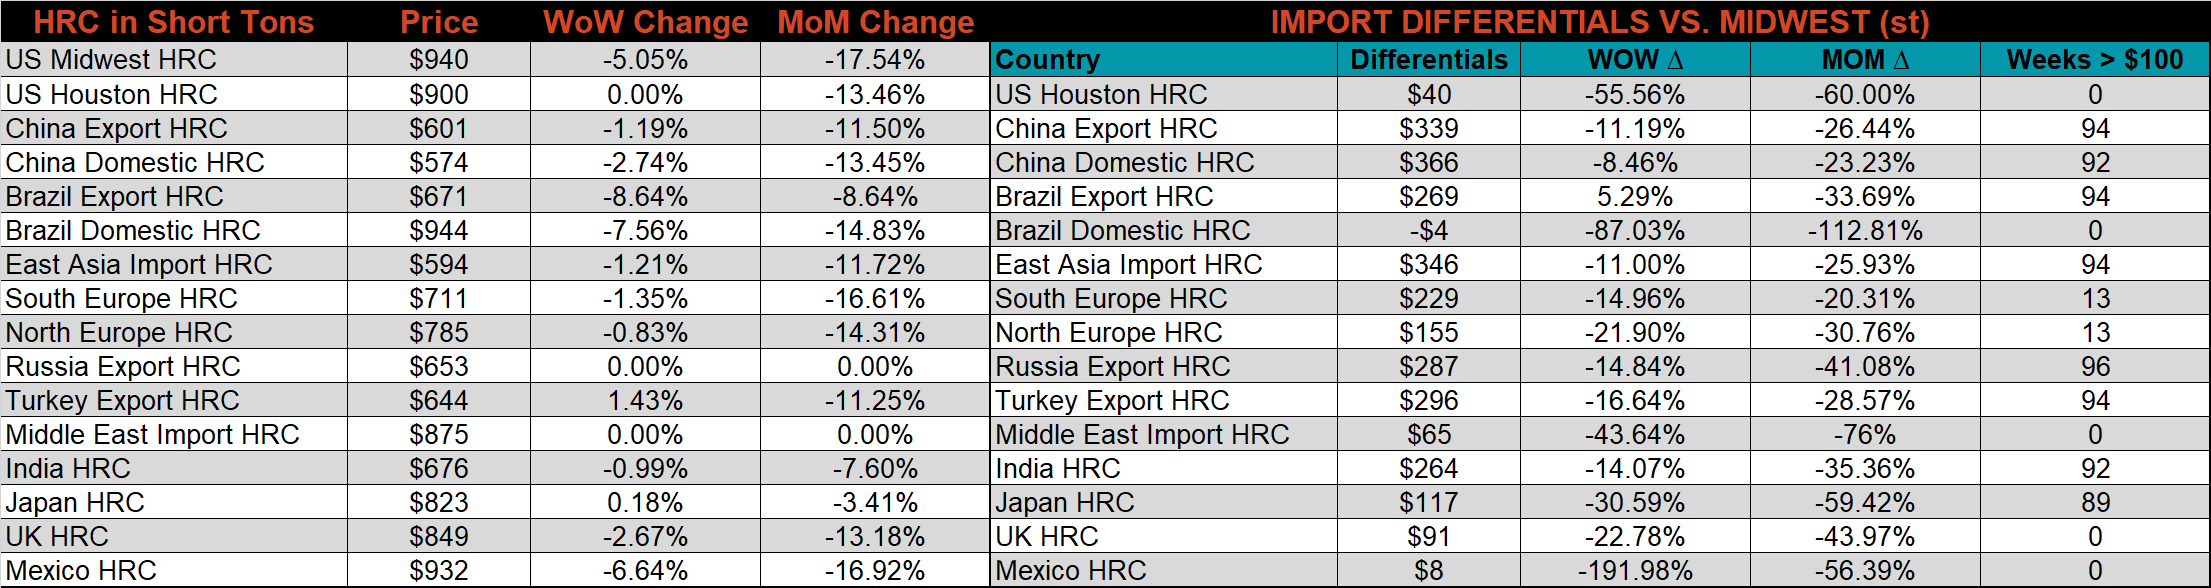
Below is June import license data through July 4th, 2022.
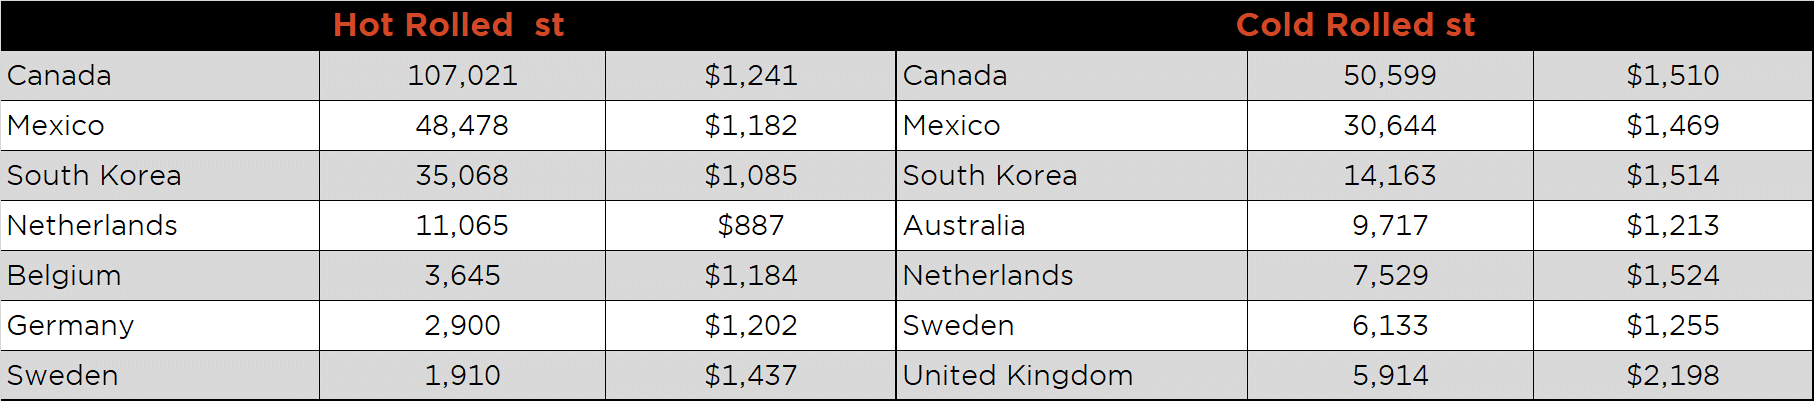
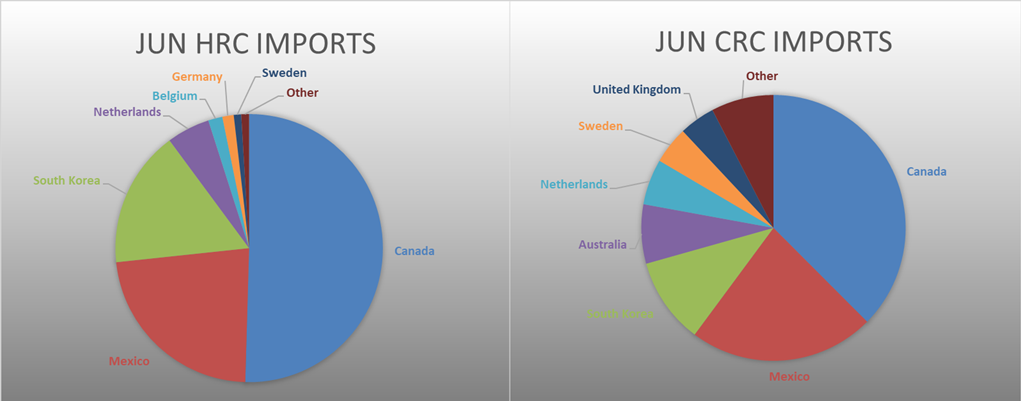
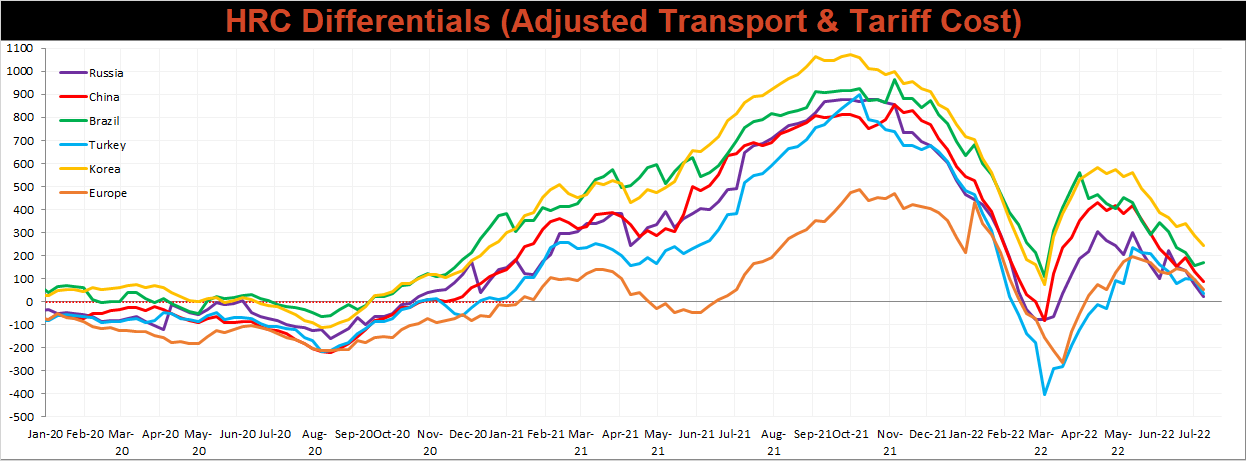
Below is the Midwest HRC price vs. each listed country’s export price using pricing from SBB Platts. We have adjusted each export price to include any tariff or transportation cost to get a comparable delivered price. Differential data moved lower across the board except for Brazil which gained 5.3%.
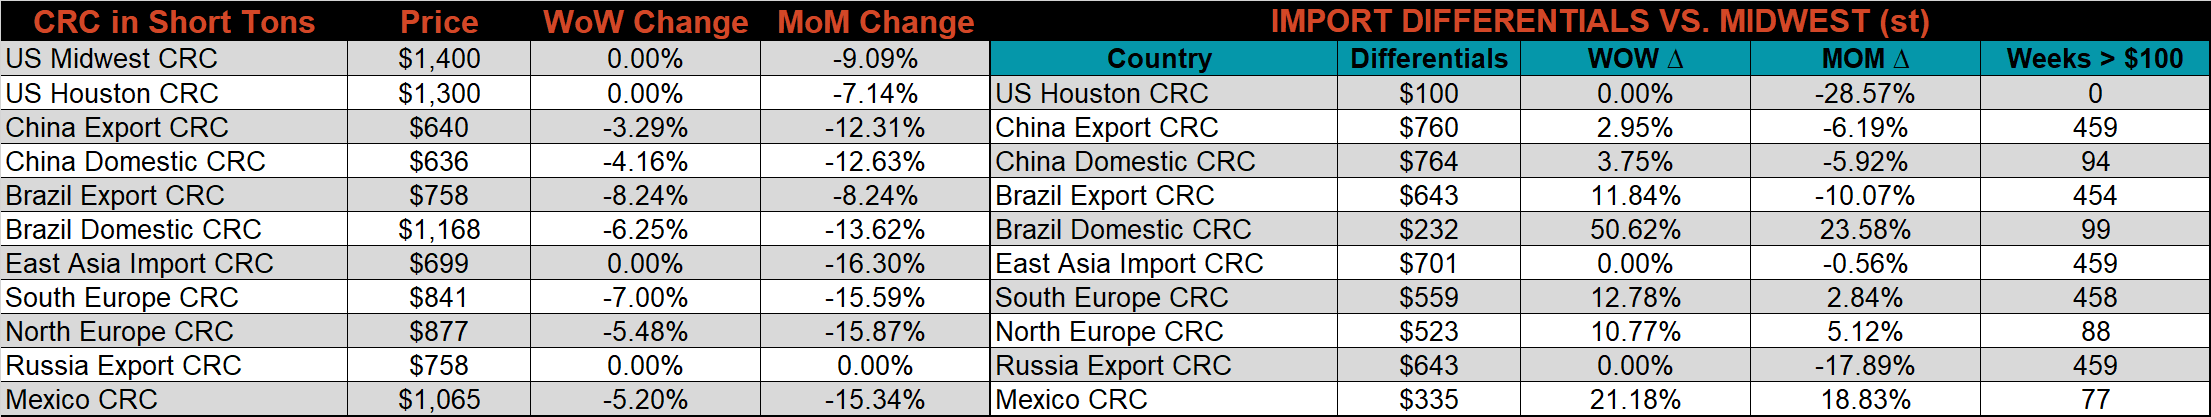
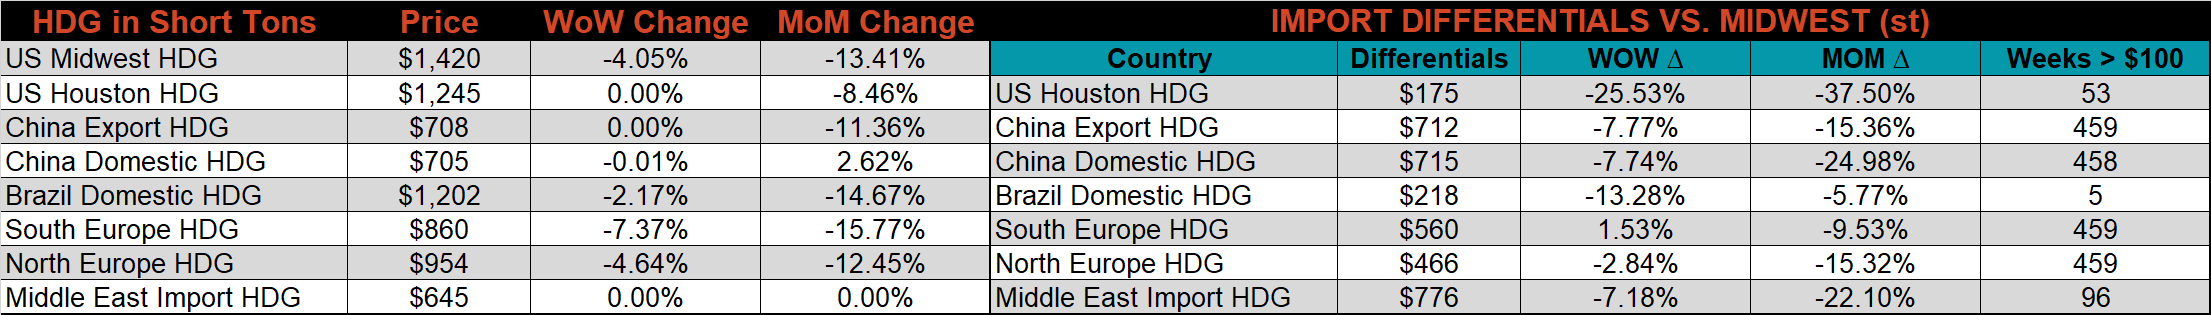
SBB Platt’s HRC, HDG, and CRC pricing is below. The Midwest HRC price was down 5.1%, HDG fell 4.1%, while CRC price remained flat. The Brazil HRC export price fell the most, down 8.6% WoW.
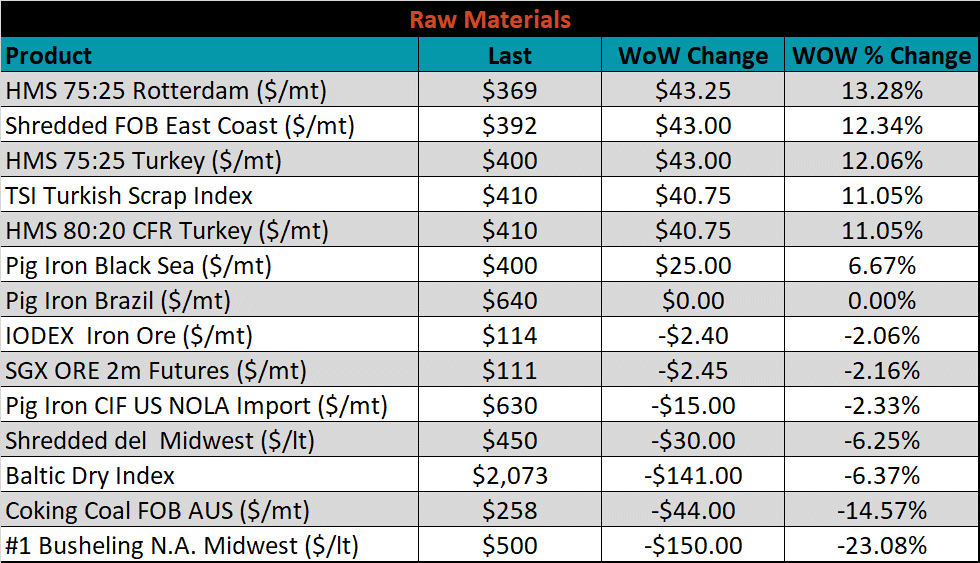
Raw Materials
Raw material prices remained mixed this week with gains led by HMS 75:25 Rotterdam, up 13.3%, and losses led by #1 Busheling N.A. Midwest, down 23.1%
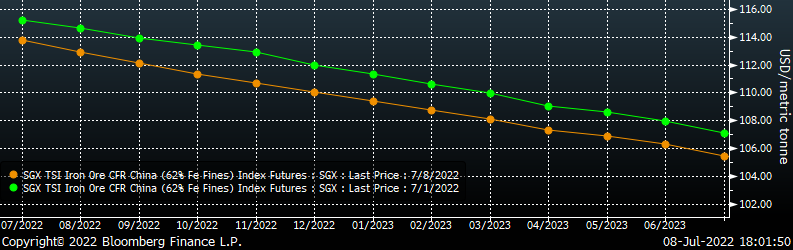
Below is the iron ore future curve with Friday’s settlements in orange, and the prior week’s settlements in green. Last week, the entire curve shifted slightly lower.
SGX Iron Ore Futures Curve
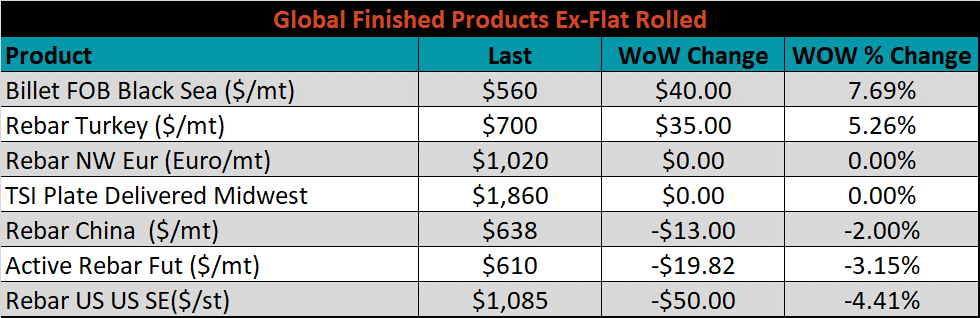
The ex-flat rolled prices are listed below.

Energy
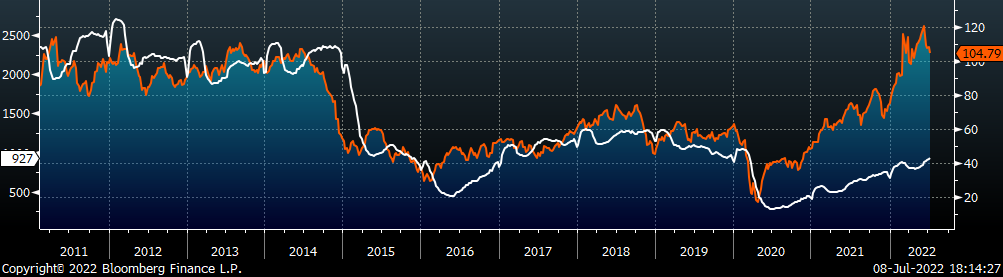
Last week, the August WTI crude oil future fell $3.64 or 3.4% to $104.79/bbl. The aggregate inventory level increased 0.6%. The Baker Hughes North American rig count increased 11 rigs, while the U.S. rig count increased 2 rigs.
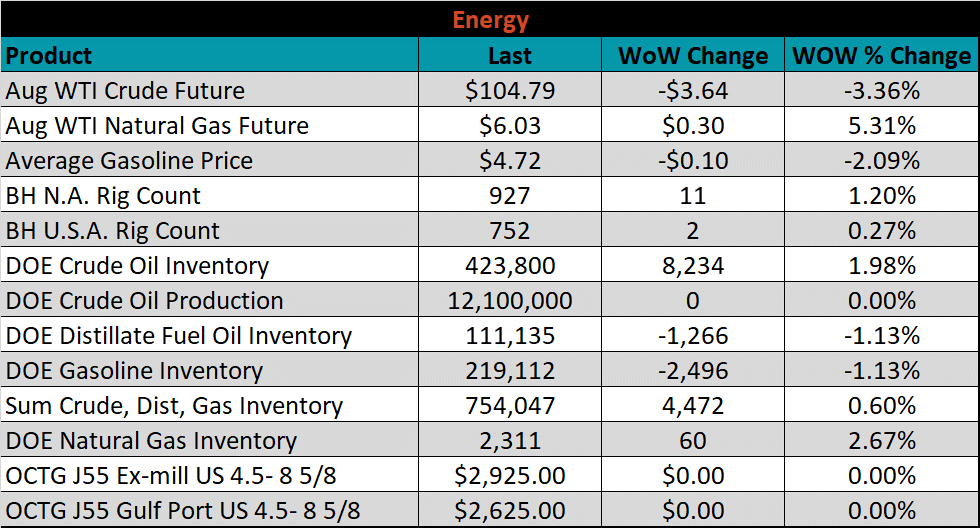
August WTI Crude Oil Futures (orange) vs. Aggregate Energy Inventory (white)
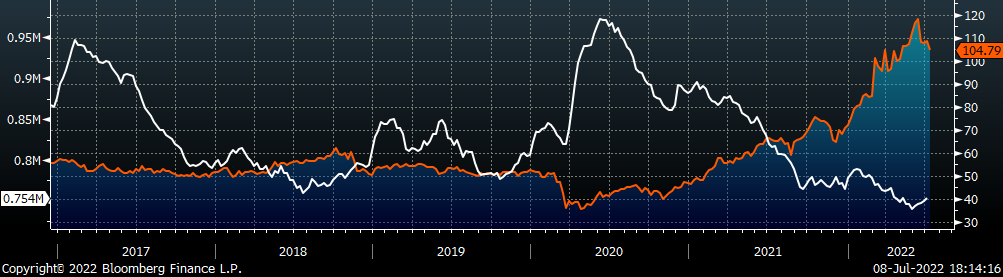
Front Month WTI Crude Oil Future (orange) and Baker Hughes N.A. Rig Count (white)
The list below details some upside and downside risks relevant to the steel industry. The bolded ones are occurring or highly likely.
Upside Risks:
- Inventory at end users and service centers below normal operational levels
- Higher share of discretionary income allocated to goods from steel intensive industries
- Changes in China’s policies regarding ferrous markets, including production cuts and exports
- Unplanned & extended planned outages, including operational issues leaving mills behind
- Energy & construction industry rebound
- Easing labor and supply chain constraints allowing increased manufacturing activity
- Mills extending outages/taking down capacity to keep prices elevated
- Global supply chains and logistics restraints causing regional shortages
- Fiscal policy measures including a new stimulus package
- Contentious union labor negotiations leading to supply disruption
- Fluctuating auto production, pushing steel demand out into the future
- Threat of further protectionist trade policies muting imports
Downside Risks:
- Increased domestic production capacity
- Elevated price differentials and hedging opportunities leading to sustained higher imports
- Steel consumers substitute to lower cost alternatives
- Steel buyer’s and consumers “double ordering” to more than cover steel needs
- Tightening credit markets, as elevated prices push total costs to credit caps
- Supply chain disruptions allowing producers to catch up on orders
- Limited desire to restock at elevated prices, causing a “Buyer’s Strike”
- Economic slowdown caused by the emergence of Coronavirus Variants
- Reduction and/or removal of domestic trade barriers
- Political & geopolitical uncertainty
- Chinese restrictions in property market
- Unexpected sharp China RMB devaluation