Content
-
Weekly Highlights
- Market Commentary
- Durable Goods
- Upside & Downside Risks


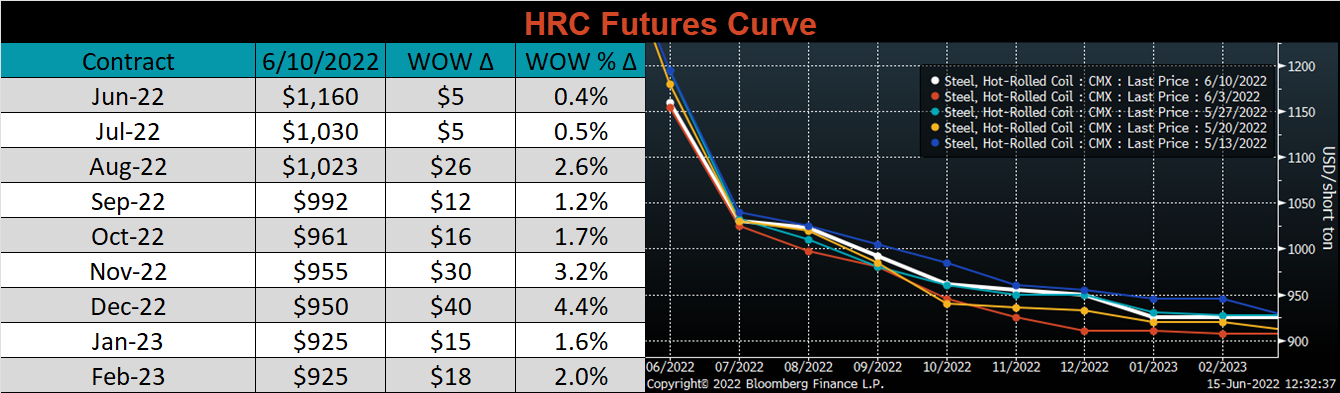
Global steel prices and raw materials continue to search for footing with many of these assessments breaching their pre-invasion levels over the last two weeks. While the US Domestic HRC market has held up better than other global ferrous contracts, we anticipate further downward pressure as mills continue to chase orders and sell spot tons. The chart below shows the respective forward curves from last Friday (teal), and Friday, February 18th (orange).
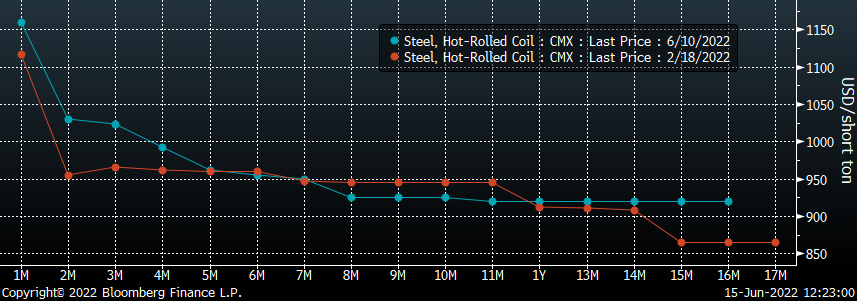
As we’ve discussed in the past, industry participants sometimes mistakenly view the forward curve as a predictor of prices. Rather than interpreting this chart as a prediction of flatlined pricing for 16 months, we view this as a confirmation that the physical market has in fact changed and higher prices will be supported. To be clear, we are not saying that HRC prices will never go below $900 again, rather that the fundamentals behind the consolidation of domestic mills as well as overarching global trends will establish price support markedly higher than it was in the last two decades. At the same time, the main difference between now and four months ago is that the global economic outlook has worsened, and sustained levels of high inflation have increased the risk a slowdown in demand. The tension between those risks and the structural changes to the industry will take time to play out, but one thing you should count on is more volatility to the up and downside, ahead. As for now recent data continues to show that stability in backlogs and growth in new orders compared to last year’s levels, with final durable goods data (below) confirming what we saw earlier in the month.
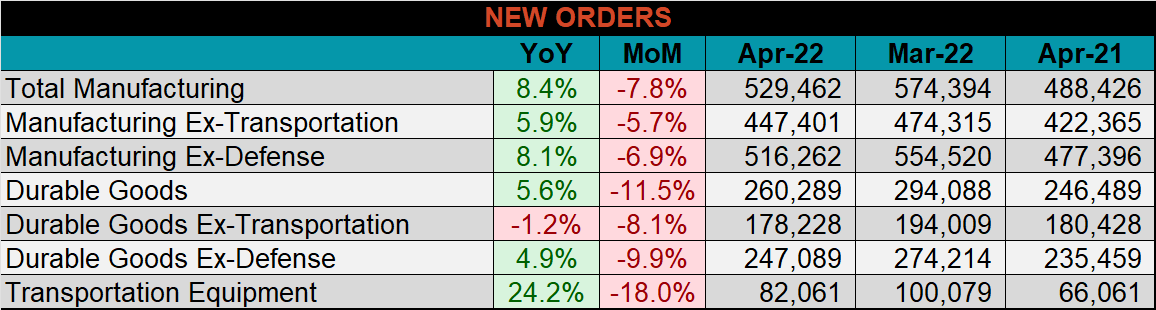
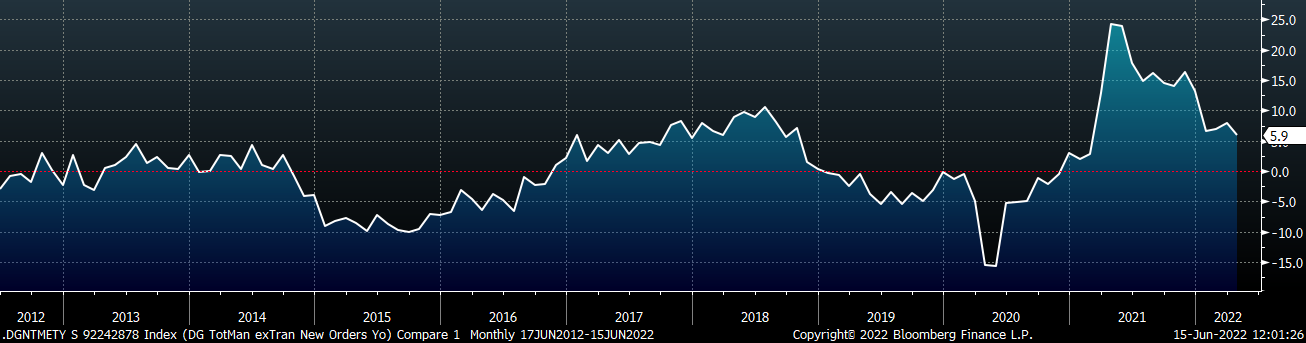
Below are final April new orders from the Durable Goods report, which were down compared to March, but show continued YoY growth in the manufacturing sector. Manufacturing ex-transportation new orders were down 5.7% MoM, but up 8.4% compared to April of last year.
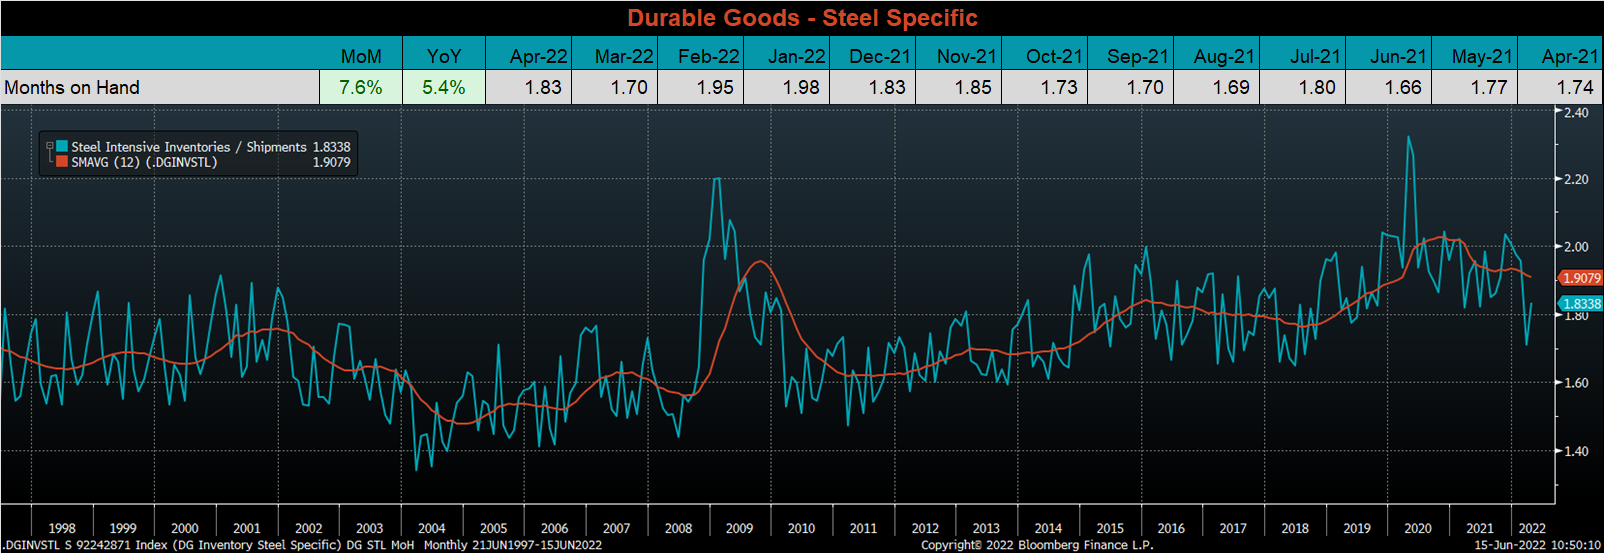
The chart looks at the months on hand (inventory divided by shipments) for durable goods categories that are steel intensive. The move higher was driven primarily by a decrease in shipments, down 5.4% this month, while inventories also increased slightly. The 12-month moving average continues to trend lower, but it remains elevated compared to historical levels.
Below are the most pertinent upside and downside price risks:
Upside Risks:
Downside Risks:
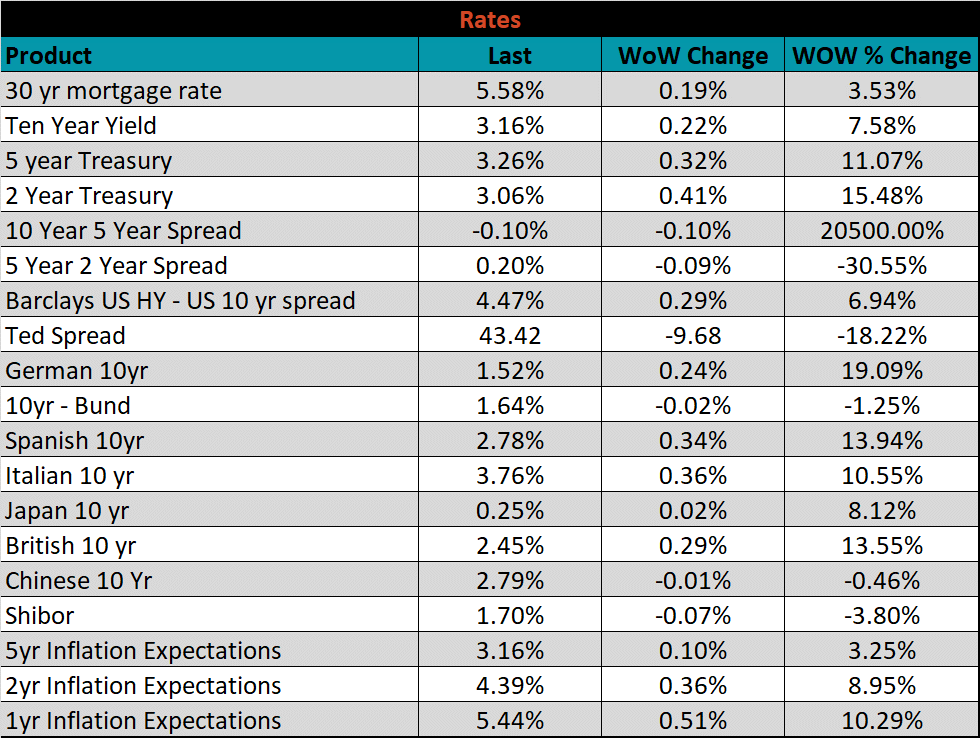
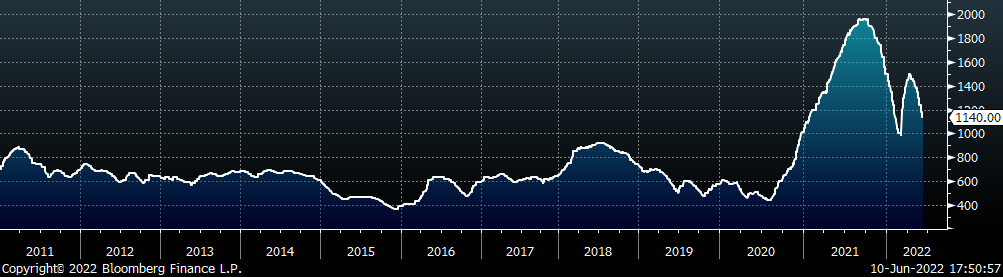
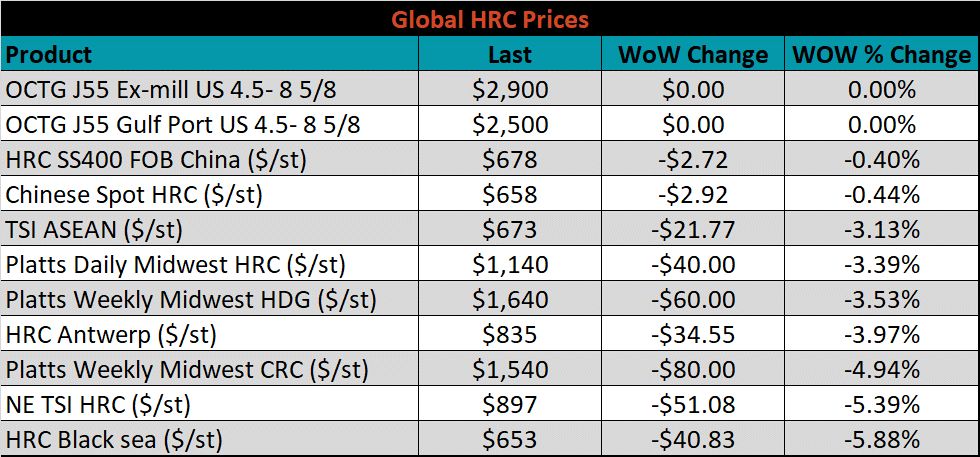
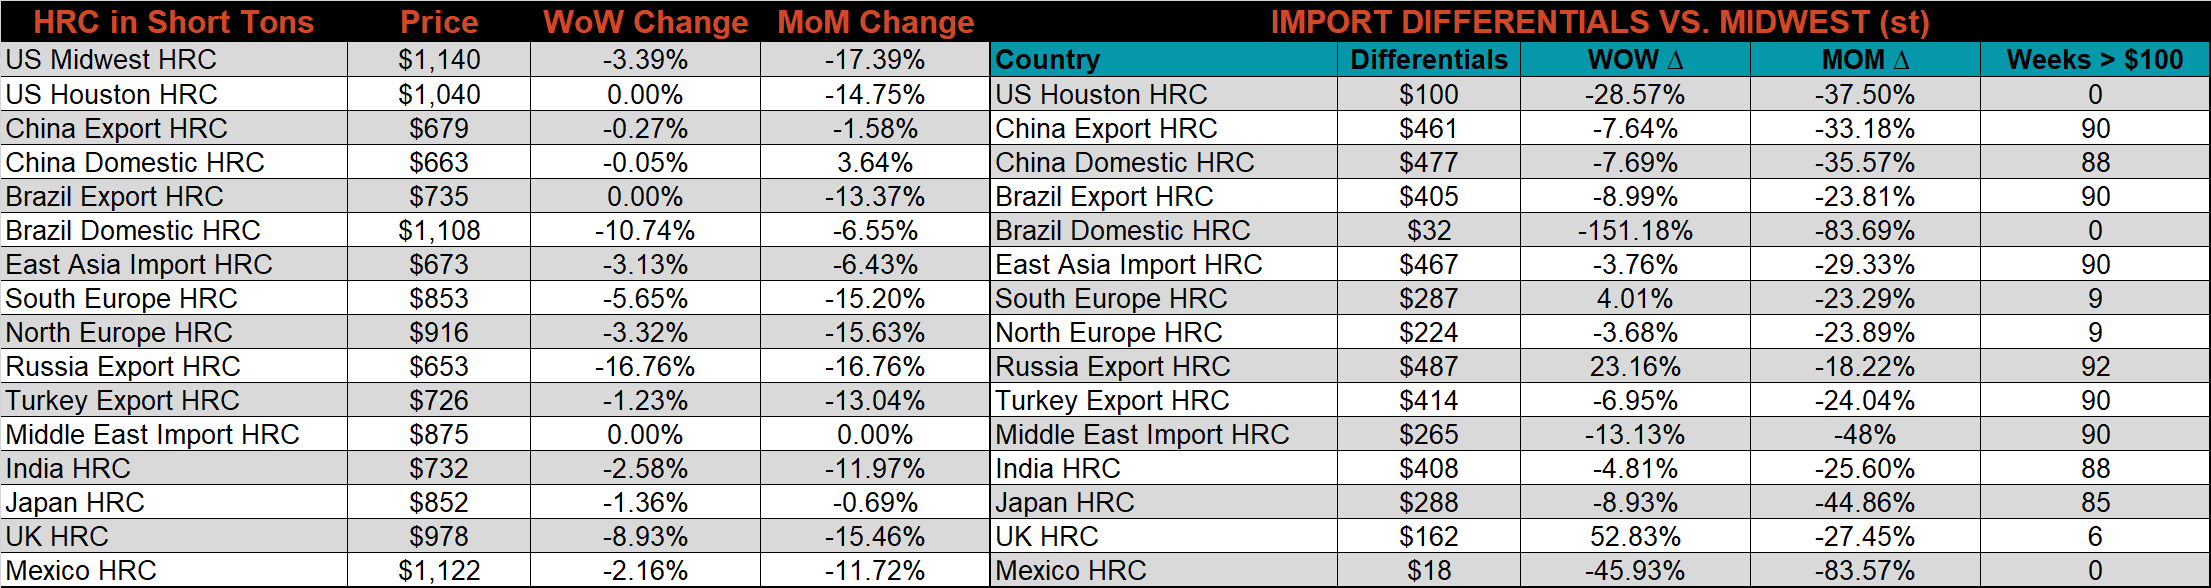
The Platts TSI Daily Midwest HRC Index was down another $40 to $1,140.
The CME Midwest HRC futures curve is below with last Friday’s settlements in white. The curve shifted slightly higher across all expirations.
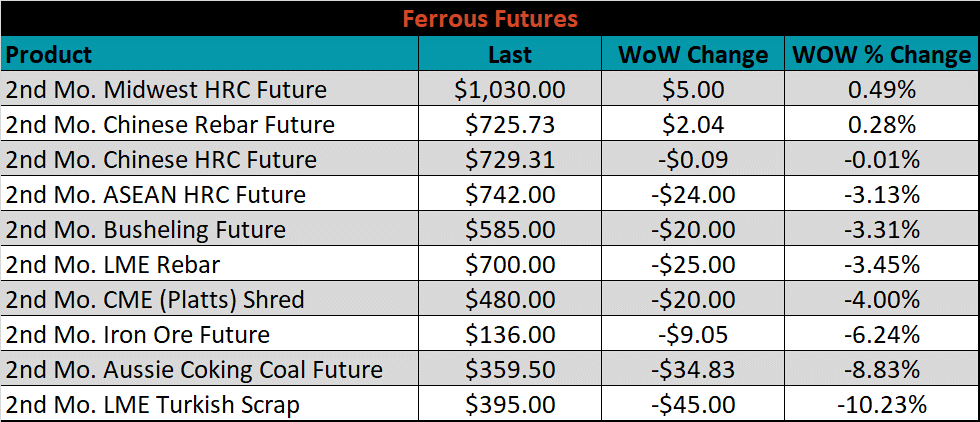
The 2nd month ferrous futures were mostly lower this week. Midwest HRC led, gaining 0.5%, while LME Turkish Scrap fell over 10.2%.
Global flat rolled indexes were mostly lower once again, led by HRC Black Sea, down 5.9%.
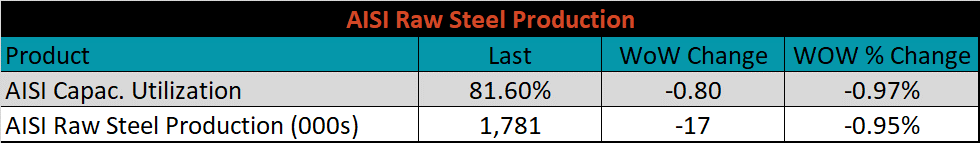
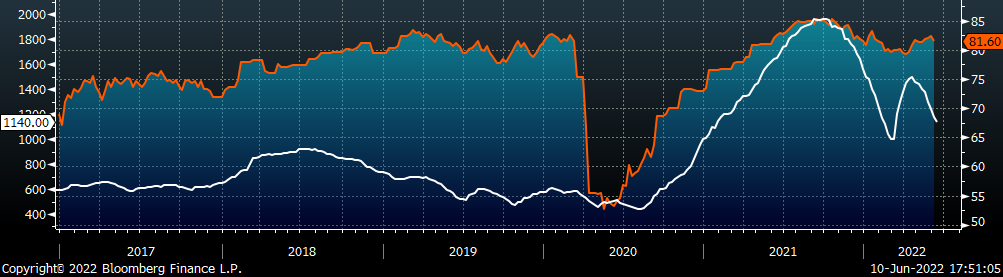
The AISI Capacity Utilization was down 0.8% to 81.6%.
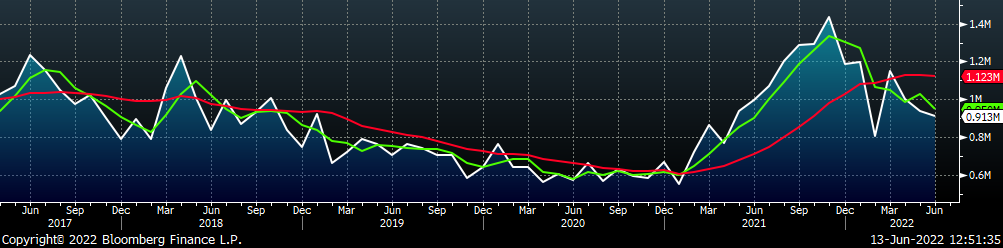
June flat rolled import license data is forecasting a decrease of 24k to 913k MoM.
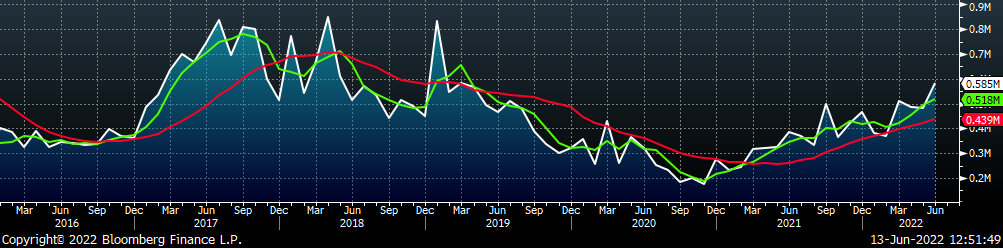
Tube imports license data is forecasting an increase of 102k to 585k in June.
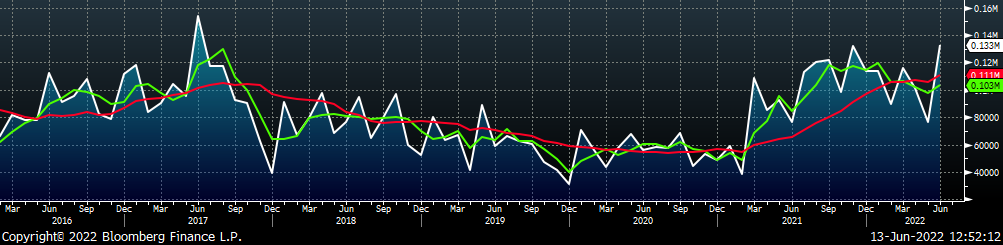
June AZ/AL import license data is forecasting an increase of 56k to 133k.
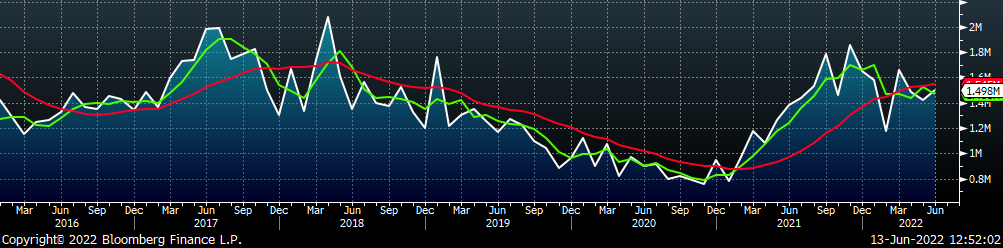
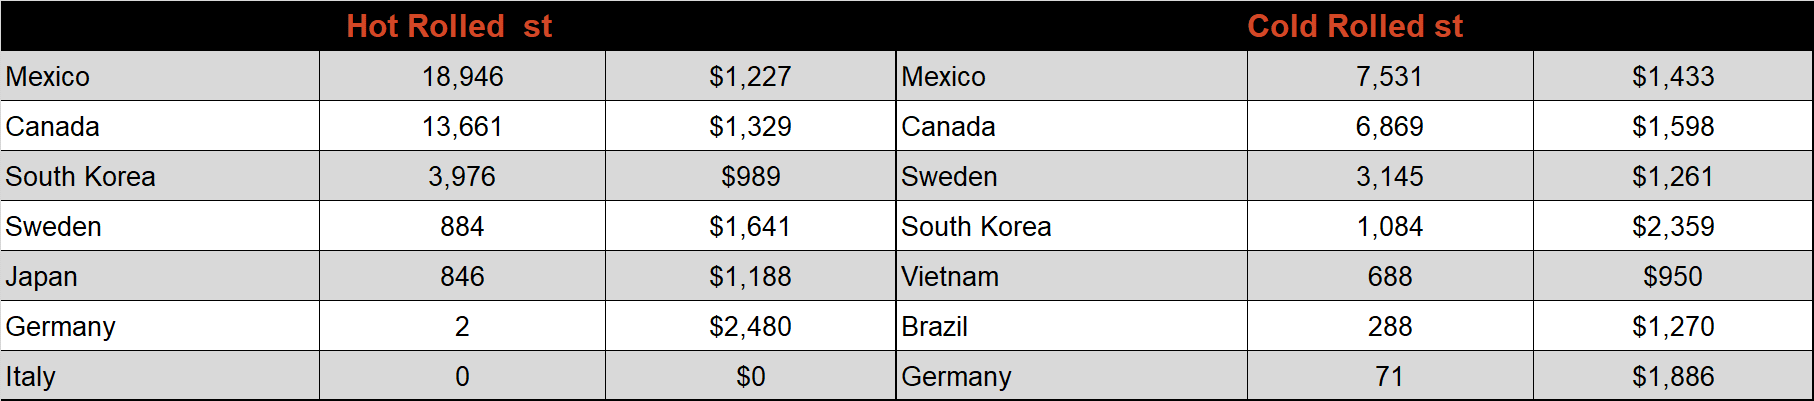
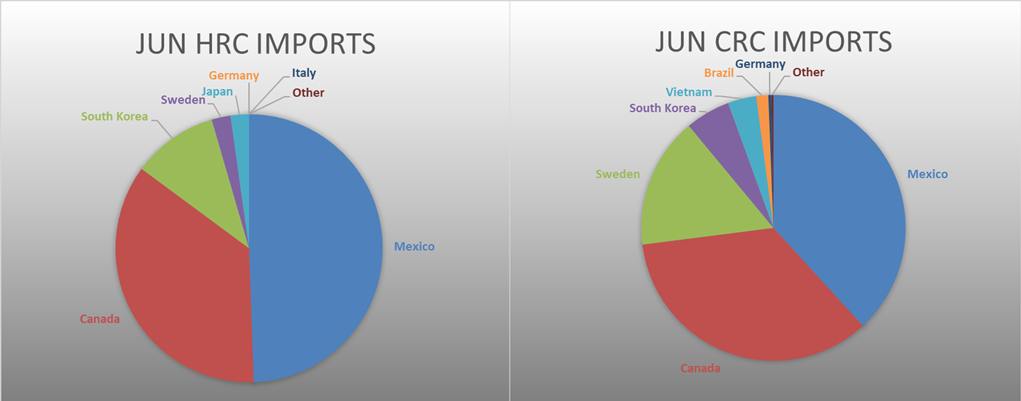
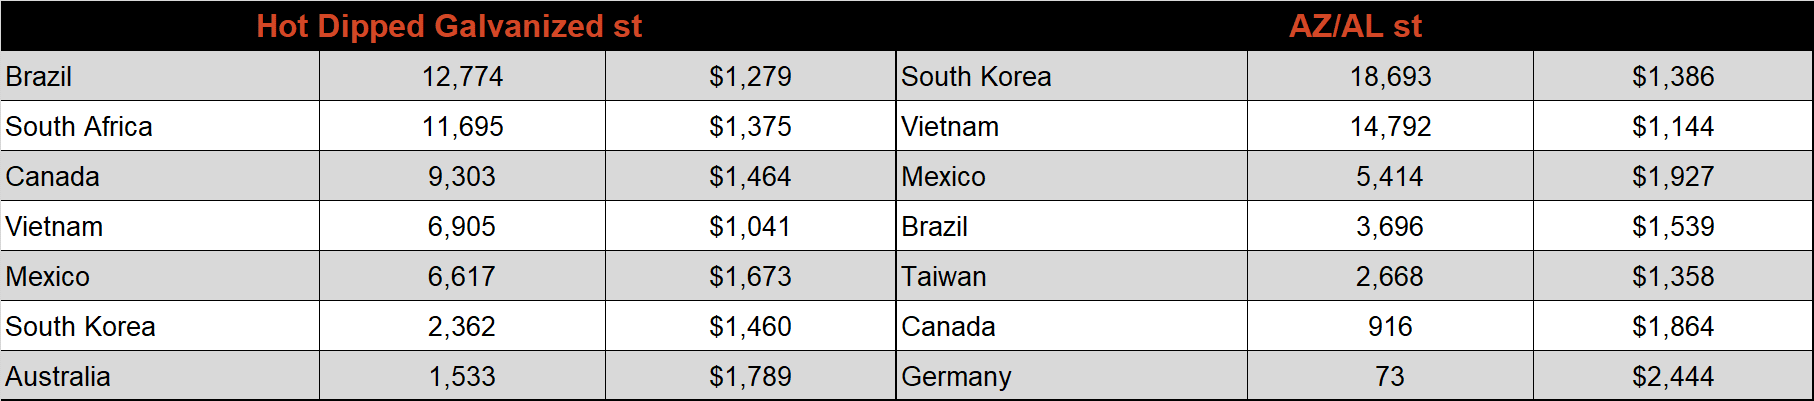
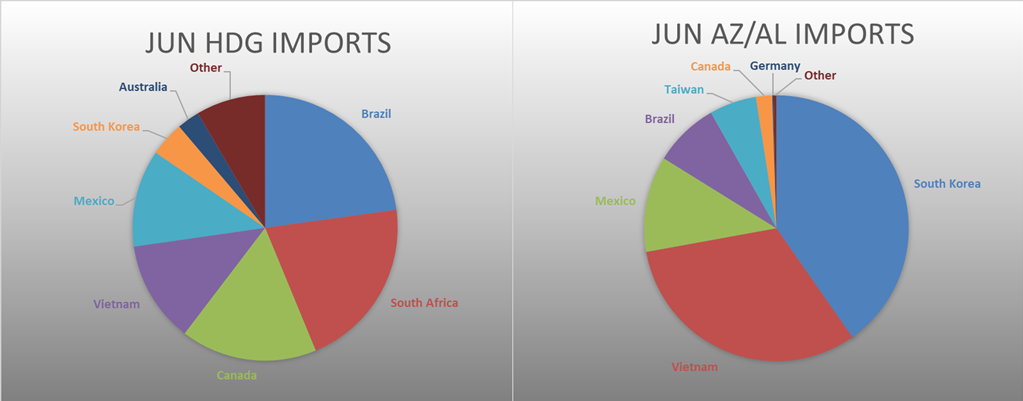
Below is May import license data through June 6th, 2022.
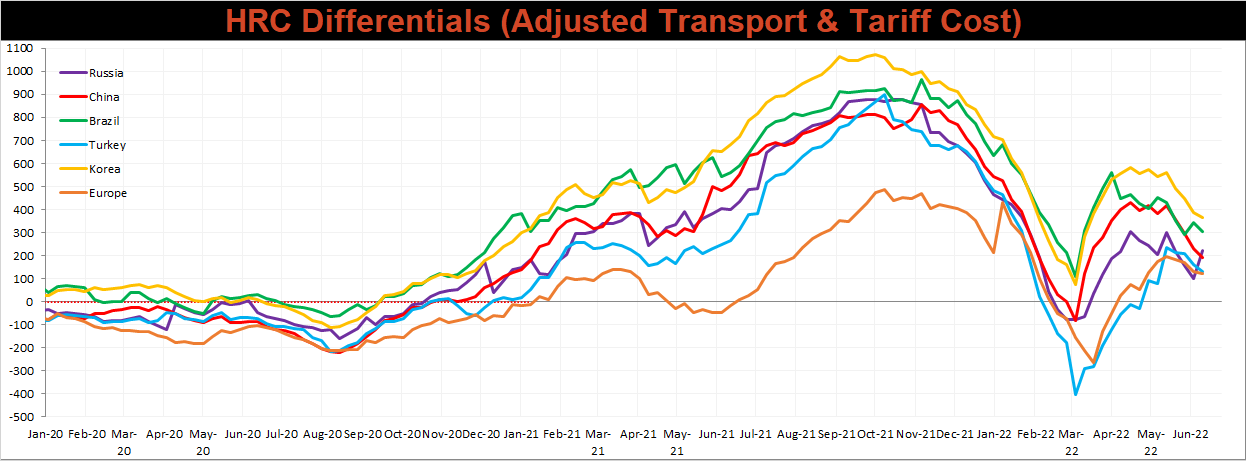
Below is the Midwest HRC price vs. each listed country’s export price using pricing from SBB Platts. We have adjusted each export price to include any tariff or transportation cost to get a comparable delivered price. Differentials decreased across the board less Russia, whose price decreased more than the U.S. price.
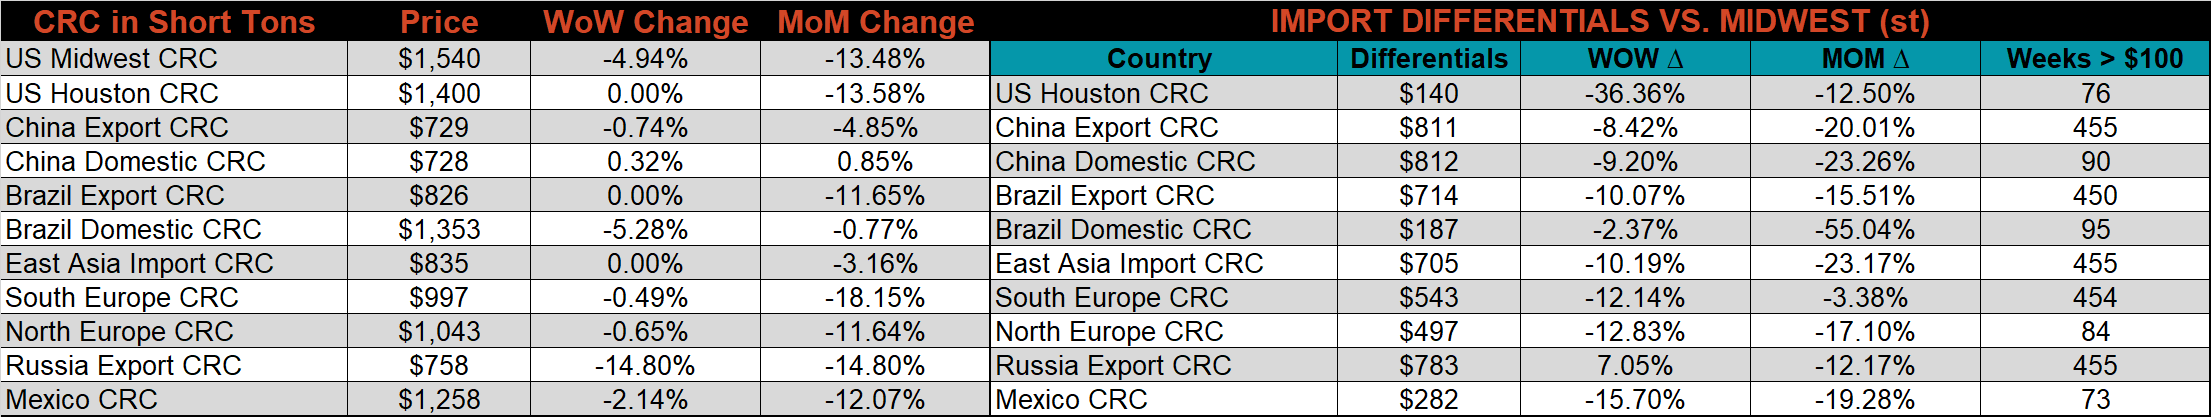
SBB Platt’s HRC, CRC and HDG pricing is below. The Midwest CRC, HDG & HRC prices were down 4.9%, 3.5%, & 3.4%, respectively. Outside of the U.S., the Russian HRC export price was down the most, down 16.8%.

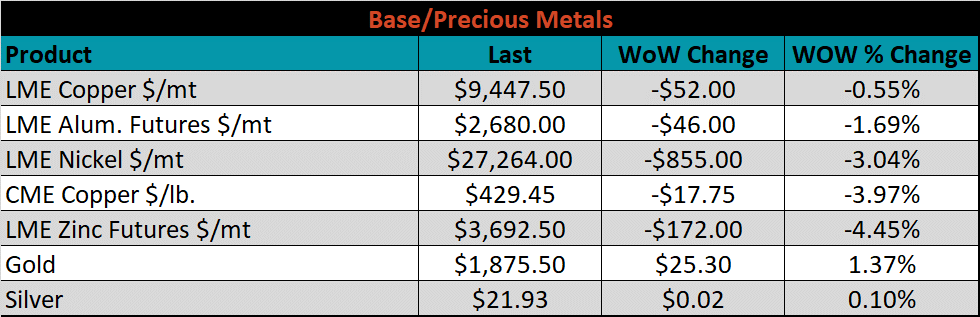
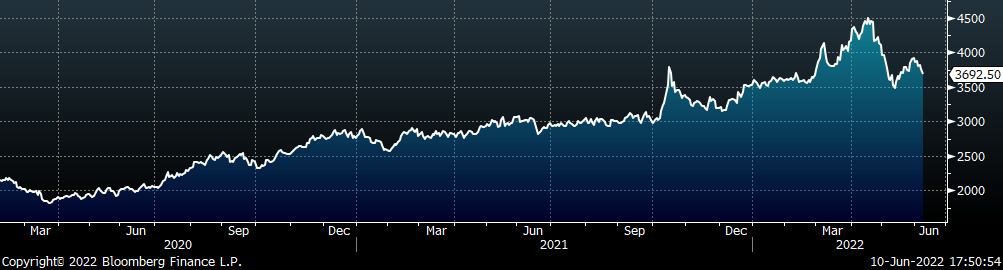
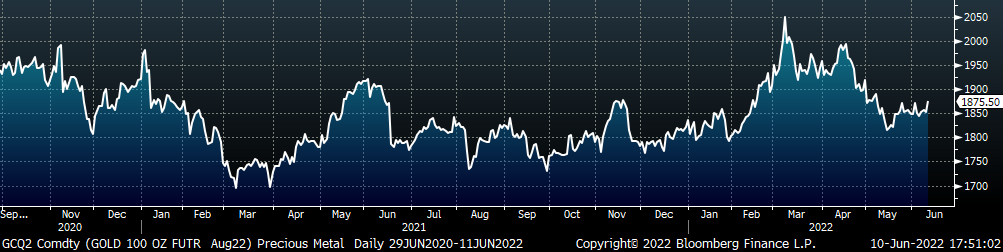
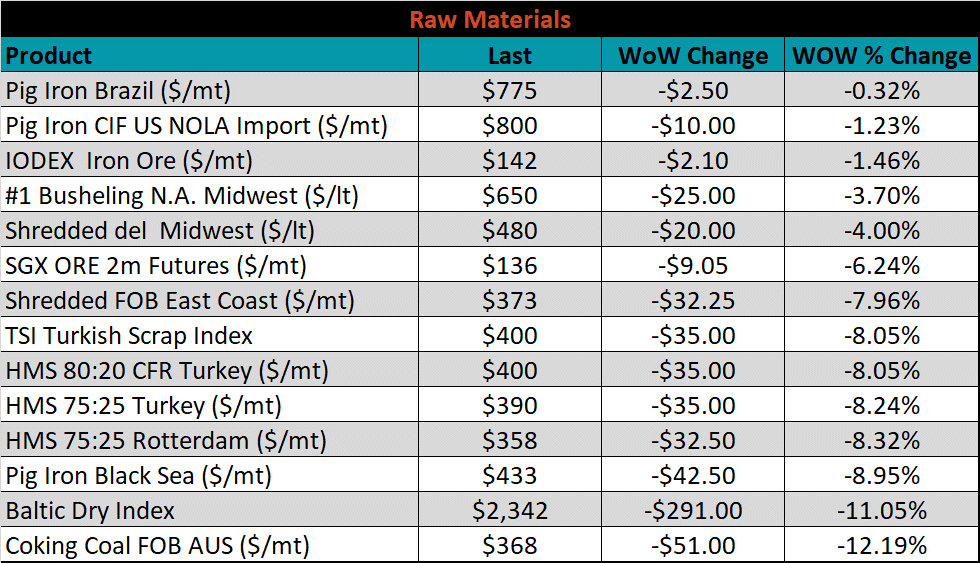
Raw material prices were all lower this week, led once again by coking coal, down 12.2%.
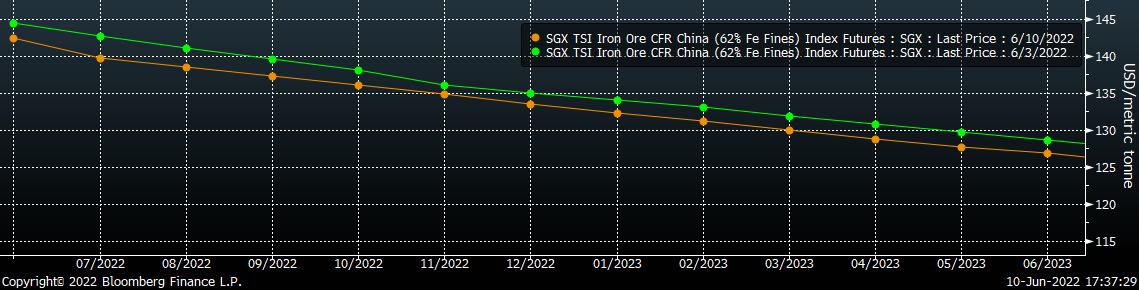
Below is the iron ore future curve with Friday’s settlements in orange, and the prior week’s settlements in green. Last week, the entre curve shifted slightly lower.
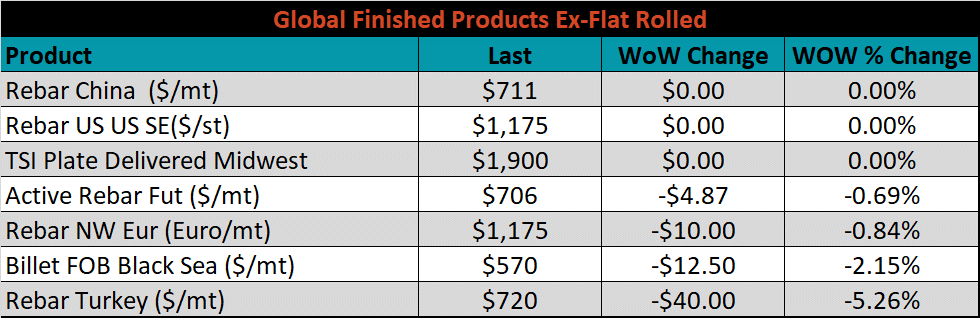
The ex-flat rolled prices are listed below.

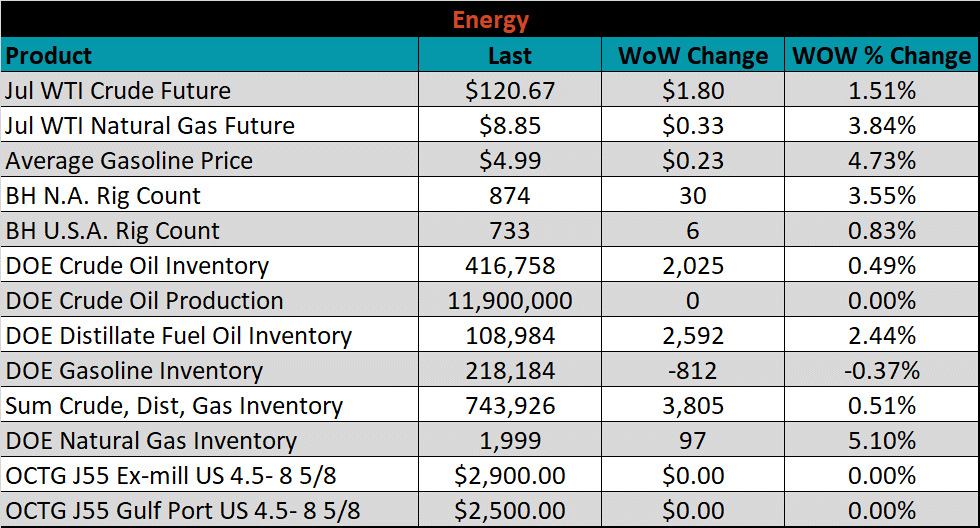
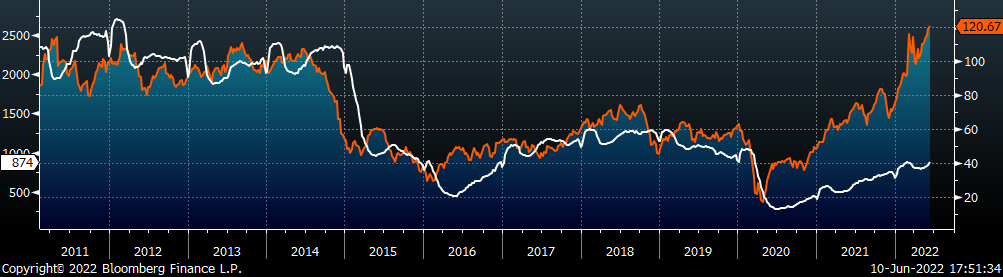
Last week, the July WTI crude oil future gained $1.80 or 1.5% to $120.67/bbl. The aggregate inventory level was up 0.5% and crude oil production was steady at 11.9m bbl/day. The Baker Hughes North American rig count was up 30 rigs, and the U.S. rig count was up 6.
The list below details some upside and downside risks relevant to the steel industry. The bolded ones are occurring or highly likely.
Upside Risks:
Downside Risks: