Content
-
Weekly Highlights
- Market Commentary
- Durable Goods
- Risks


Very little changed this week in the physical steel market, with mill offers and the spot price continuing to push higher and all eyes on the $1,700 level for HRC. Current momentum and our bullish outlook remain intact based on 8-week lead times now translating to early August delivery and foreign offers for late Q3/early Q4 coming in just below current spot levels. Additionally, demand for steel, the most important driver of price, continues to expand as the auto and energy sectors are beginning to ramp up. In contrast, a familiar dismissive tone from the analyst and prognosticator community has picked up over the last 2-3 weeks, as they continue to stick to outdated predictions that a collapse in the HRC price is right around the corner. If this sounds eerily familiar, it is probably because this dynamic has already played out repeatedly, and at significant cost to anyone who has chosen to ignore the facts on the ground. This week, we will shift our focus to the dynamics around next year’s mill contract negotiations, which will bring significant implications on next years’ prices.
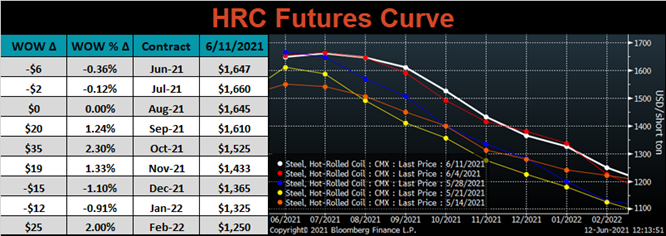
As referenced in last week’s report, we believe contract negotiations will be earlier than ever this year due to the vice grip mills currently have on the spot market. When negotiations complete, there will be a significant interest in the HRC futures curve in 2022 for those trying to understand next year’s price levels. Before that happens, a refresher on what the futures curve is, what it means, what it tells us, and importantly, what it does not mean, will be vital in making informed decisions. The futures market is where participants agree on a date and price at which they will buy and sell an asset. The corresponding curve represents the trade-offs those participants make when evaluating time, availability, financing, and storage costs among other factors. The futures curve is not a tool for prediction and provides no insight into where prices are going. If there are more sellers on the curve than buyers, they will undercut each other and the future price will decrease, while a surplus of buyers will have the opposite effect and push prices higher.
Therefore, the overall shape of the curve is simply an indication of buyers and sellers at each expiration into the future. What this really means is that the shape of the curve provides a snapshot of supply and demand in today’s spot market. If the market is undersupplied the futures curve will be in backwardation – meaning the price today is higher than it is in the future. When the market is oversupplied, the curve is in contango – where today’s prices are discounted compared to future expirations. Yet somehow, analysts continue to peddle the idea that the price for steel is going lower because the futures curve says it will. The curve has been in backwardation since Sep 25th, yet spot prices have only moved drastically higher as demand continues to outpace supply. Listening to incorrect interpretations of the curve have been extremely costly.
If you are going to buy steel next year, on a mill contract or in the spot market, then you are naturally short the curve. Last year, on June 11, 2020, you could have purchased the entire year of 2021 for $540 with futures. If you purchase 500 tons per month and failed to lock in that price, then the cost for your steel is $3.96 million dollars higher than it would have been. On top of that, this cost is only calculated through June, and we have another 6 months to go. Now, much like then, it appears demand for steel is being discounted by analysts and that imbalance could offer value to your business. More importantly, locking in a portion of next year’s price reduces your volatility, and would allow you to operate with stable costs in the future. If you missed out on these benefits last year, we encourage you not to make the same mistake twice.

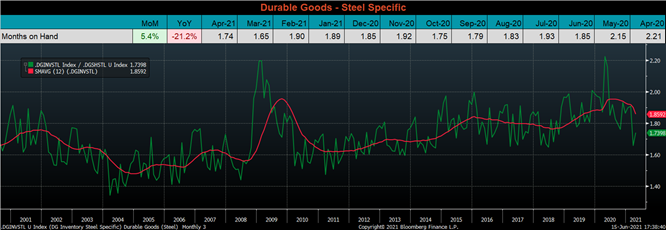
Below are final April new orders from the Durable Goods report. New orders for manufactured goods were up 37.4% compared to April 2020 and 0.1% higher than they were in April 2019, but down 7.7% compared to March 2021. Manufacturing ex-transportation new orders were up 24.1% compared to April 2020 and 5% compared to April 2019, but 3.9% lower than in March. The final chart looks at the months on hand (inventory divided by shipments) for durable goods categories that are steel intensive. MOH rebounded compared to March, but it remains well below the 12-month moving average. The slight increase was caused by a slowdown in shipments and an increase in inventories.



Below are the most pertinent upside and downside price risks:
Upside Risks:
Downside Risks:

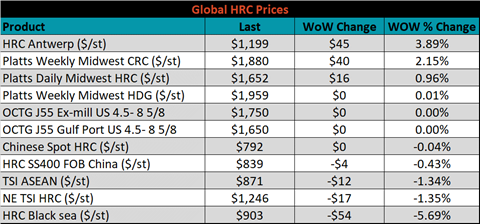
The Platts TSI Daily Midwest HRC Index increased by $15.75 to $1,652.

The CME Midwest HRC futures curve is below with last Friday’s settlements in white. Last week, the curve steepened, as the front and middle expirations were firm, and December and January moved slightly lower.
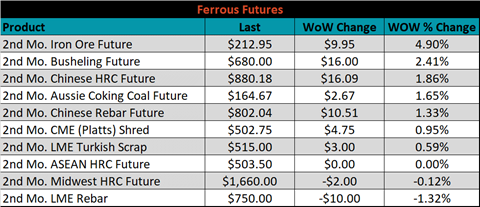
July ferrous futures were mixed. Iron ore gained another 4.9%, while LME rebar was down 1.3%.
Global flat rolled indexes were mixed. Antwerp HRC was up 3.9%, while Black Sea HRC was down 5.7%.
The AISI Capacity Utilization rate increased 0.8% to 82.3%.


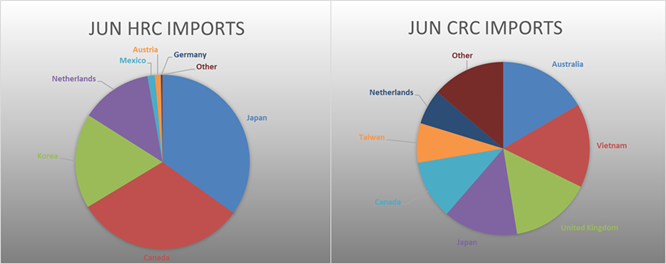
June flat rolled import license data is forecasting a decrease of 30k to 900k MoM.

Tube imports license data is forecasting an increase of 52k to 390k in June.


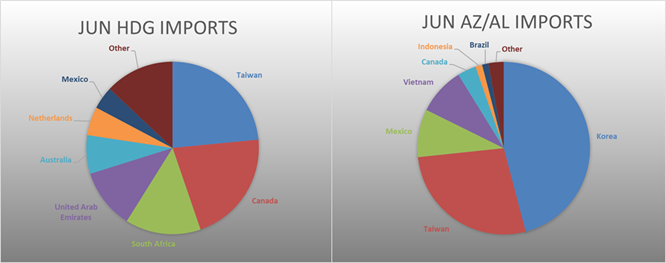
June AZ/AL import license data is forecasting an increase of 12k to 102k.

Below is June import license data through June 7th, 2021.


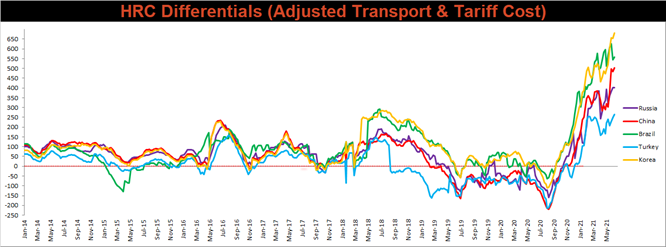
Below is the Midwest HRC price vs. each listed country’s export price using pricing from SBB Platts. We have adjusted each export price to include any tariff or transportation cost to get a comparable delivered price. The differentials increased for all watched countries increased this week, as the increasing Midwest HRC price outpaced their respective domestic prices.
SBB Platt’s HRC, CRC and HDG pricing is below. The Midwest CRC & HRC prices were up, 2.2% and 1%, respectively, while the HDG price did not change. Globally, the Mexican domestic HRC price was up 4.7%.


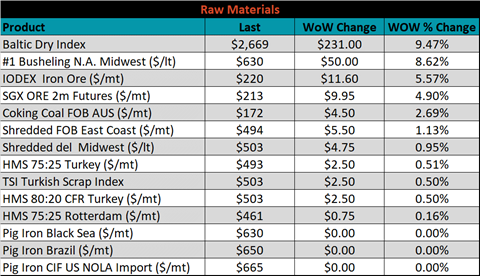
Raw material prices were mostly higher, led by busheling, up 8.6%.
Below is the iron ore future curve with Friday’s settlements in orange, and the prior week’s settlements in green. Last week, the entire curve shifted higher.

The ex-flat rolled prices are listed below.


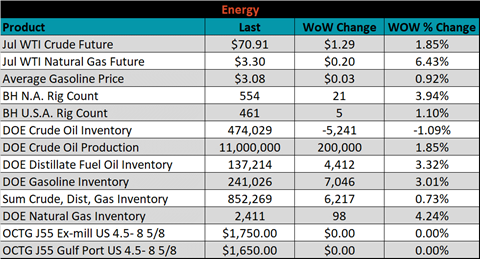
Last week, the July WTI crude oil future was up another $1.29 or 1.9% to $70.91/bbl. The aggregate inventory level was up 0.7%, and crude oil production was up to 11m bbl/day. The Baker Hughes North American rig count was up 21 rigs, and the U.S. rig count was up 5 rig.


The list below details some upside and downside risks relevant to the steel industry. The orange ones are occurring or look to be highly likely. The upside risks look to be in control.
Upside Risks:
Downside Risks: