Content
-
Weekly Highlights
- Market Commentary
- Risks


Last week, as the current rally in HRC prices officially became the longest rally on record, we saw further strength in the spot price with multiple transactions reported well above $1,700. Additionally, lead times appear to have pushed out this week, with most assessments now well into August for any new spot orders that become available. Recently, the idea that prices are going back to normal by early next year has started to resurface in the steel buying community. While this appears to be completely disconnected from the facts on the ground, it is not the first time a critical mass of participants and analysts have made this claim. The data and fundamentals that back up this theory remain largely flawed. However, this week we will look at how this off base prediction would play out relative to historical data.
To fully test this thesis, we will start by assuming the 10-year historical average of ~$630/stn as what is being referred to as “normal,” and that early next year would be February (the middle of 1Q22). Additionally, we will assume a peak of $1,720 in July, which represents the most bearish view on record. The chart below is comprised of 3 theoretical downside moves with the aforementioned “back to normal” in orange, a replication of the 2008 collapse in black and the average historical decline over the last 20 years in blue.
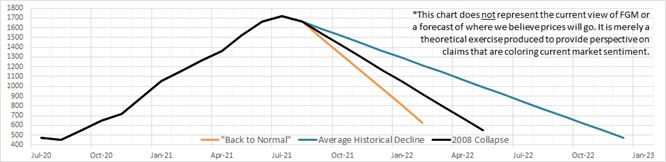
The takeaway here is clear, if you are betting on a return to $630 by early 2022, you are taking a longshot risk that defies historical data. For this to occur, the peak would happen in approximately two weeks and the collapse would be at a faster rate than in 2008, the worst financial and economic conditions for the steel market in generations. To be clear, we at Flack disagree with every aspect of this theory, our current outlook is that the peak remains out of focus and the structural shortage is as bad as it has ever been. Even the average historical decline requires changes in the physical market that have yet to surface. The most important upside risk to prices, which appears to be significantly discounted by bearish analysts, is that demand continues to outpace increasing supply. On top of that, inventories across the steel-intensive sectors are far below basic operating levels and will require restocking before the community can even think about holding out for lower prices. Holding off on purchasing with the belief that prices will normalize next year is as bad of a gamble today as it has been over the past 9 months.
Below are the most pertinent upside and downside price risks:
Upside Risks:
Downside Risks:
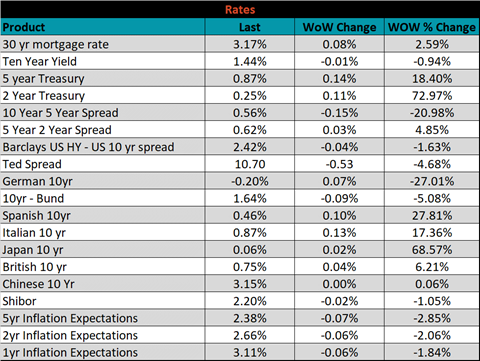
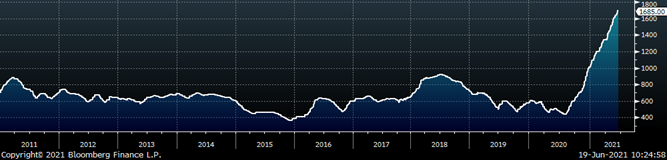
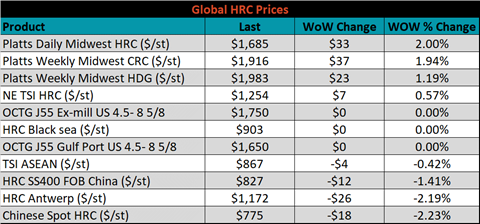
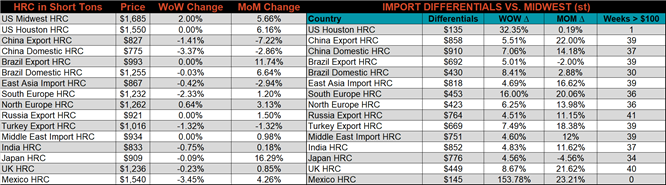
The Platts TSI Daily Midwest HRC Index increased by $33 to $1,685.
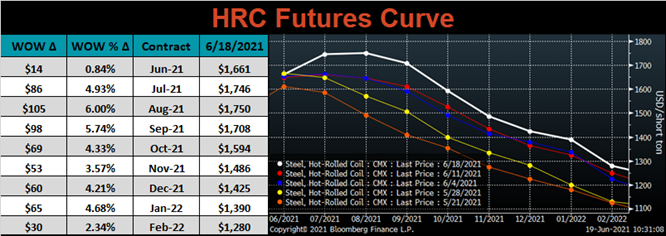
The CME Midwest HRC futures curve is below with last Friday’s settlements in white. Last week, the entire curve shifted higher, most significantly in the front, causing the curve to steepen further into the most significant backwardation on record.
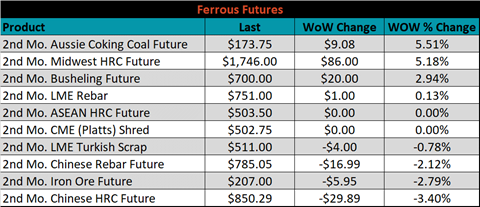
July ferrous futures were mixed. Aussie coking coal gained 5.5%, while Chinese HRC was down 3.4%.
Global flat rolled indexes were mixed. TSI Platts Midwest HRC was up 2%, while Chinese spot HRC was down 2.2%.
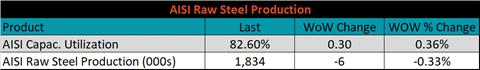
The AISI Capacity Utilization rate increased 0.3% to 82.6%.
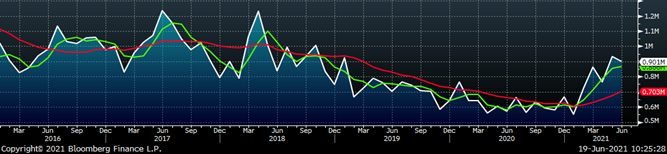
June flat rolled import license data is forecasting a decrease of 31k to 901k MoM.
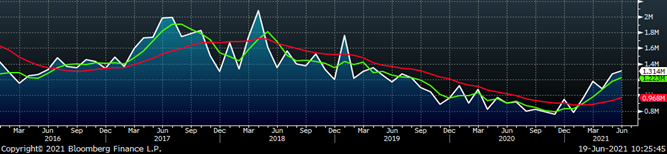
Tube imports license data is forecasting an increase of 75k to 413k in June.
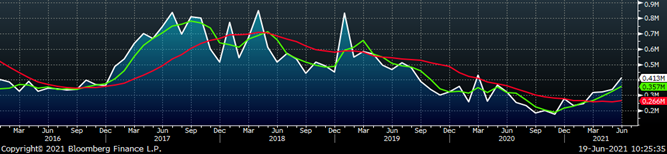
June AZ/AL import license data is forecasting a decrease of 4k to 86k.
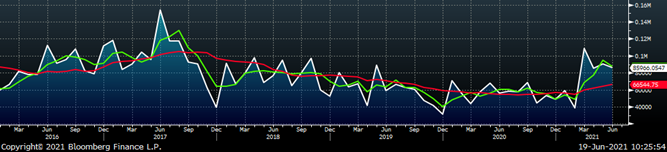
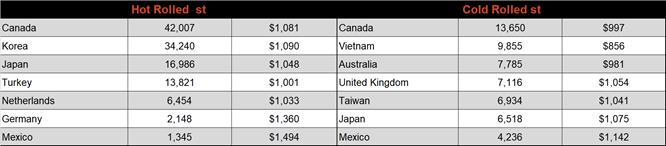
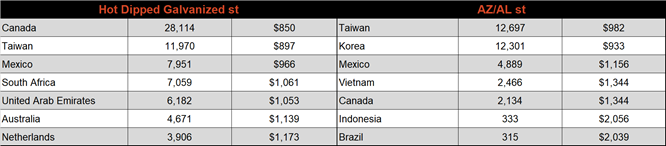
Below is June import license data through June 15th, 2021.
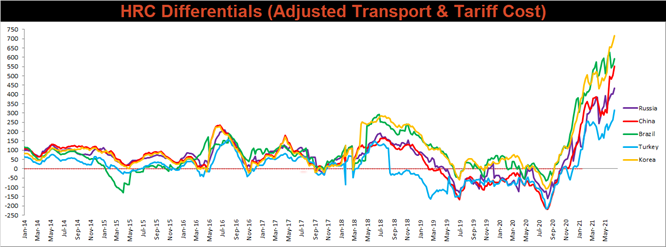
Below is the Midwest HRC price vs. each listed country’s export price using pricing from SBB Platts. We have adjusted each export price to include any tariff or transportation cost to get a comparable delivered price. The differentials increased for all watched countries this week, as the increasing Midwest HRC price outpaced their respective domestic prices.
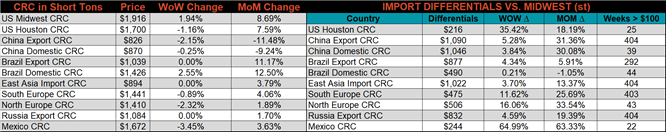
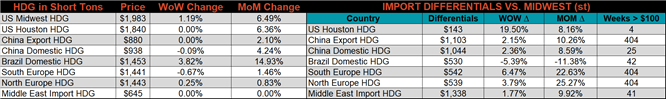
SBB Platt’s HRC, CRC and HDG pricing is below. The Midwest HRC, CRC, & HDG prices were up, 2%, 1.9% and 1.2%, respectively. Globally, the Mexican domestic HRC price was down 3.5%.
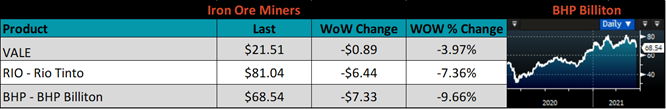
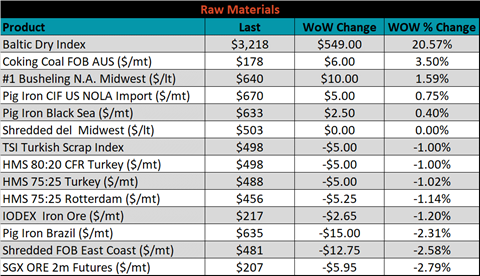
Raw material prices were mixed, with Aussie coking coal up 3.5%, while August iron ore futures were down 2.8%.
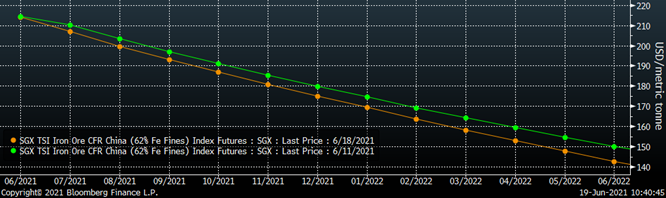
Below is the iron ore future curve with Friday’s settlements in orange, and the prior week’s settlements in green. Last week, the entire curve shifted lower, more significantly in the back.
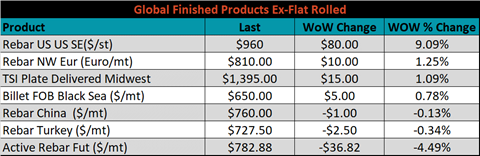
The ex-flat rolled prices are listed below.

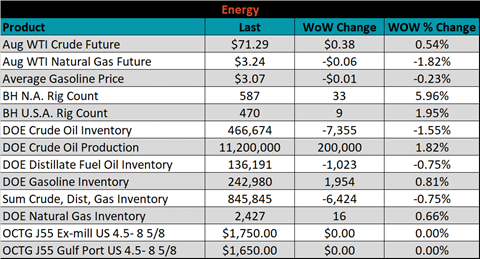
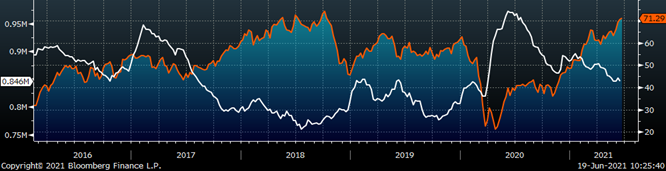
Last week, the August WTI crude oil future was up another $0.38 or 0.5% to $71.29/bbl. The aggregate inventory level was down 0.8%, and crude oil production was up to 11.2m bbl/day. The Baker Hughes North American rig count was up 33 rigs, and the U.S. rig count was up another 9 rigs.
The list below details some upside and downside risks relevant to the steel industry. The orange ones are occurring or look to be highly likely. The upside risks look to be in control.
Upside Risks:
Downside Risks: