Content
-
Weekly Highlights
- Market Commentary
- Risks


The physical steel market continued its climb higher this week, on the back of extended lead times and a lack of available spot material. Detailed analysis of the physical market continues to be hampered by lagged data and limited information that lacks sufficient context. Some mills are showing signs of catching up (which has been described as preemptive preparation for planned maintenance closures in early Q4), while news of unplanned maintenance outages has left other mills further behind than ever. It is important to note, that throughout these mixed signals, no more spot availability has shaken loose. For some buyers, this lack of a clear narrative may have lulled them into a false sense of security as buyers appear to have learned how to operate with the current supply side restrictions. With that in mind, demand remains well intact and appears to outpace the increased levels of production and imports, thus driving prices higher. This week, we received updated imports data through the end of May and will dig in to where things stand, and where they could go from here.
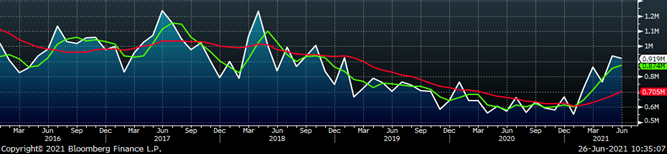
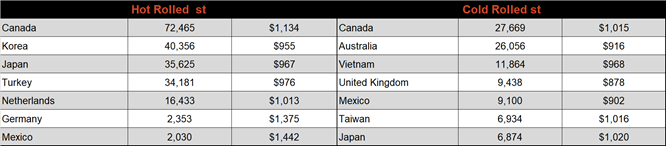
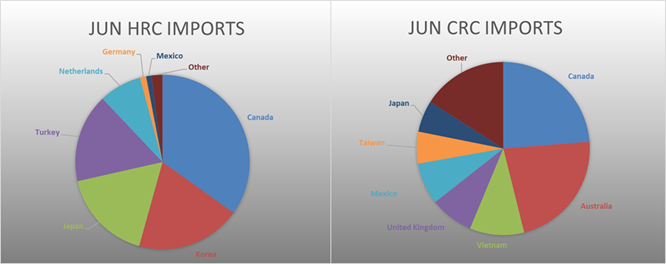
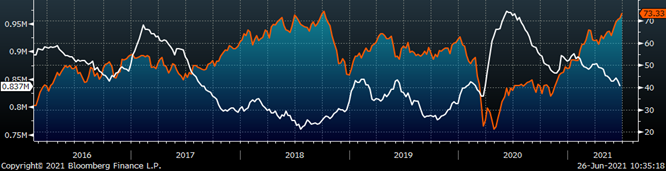
Early-on in our current rally, when it was clear that the U.S. price was outpacing the rest of the world, many participants believed that global differentials and the threat of imports would create a ceiling for how high mills would be willing to increase prices. The chart below is comprised of census data for flat rolled imports through the end May and current extrapolated import license data for June.
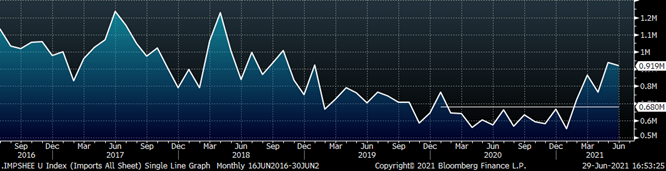
Now that we are 10-months into the rally, we see that imports are well above last year and at their highest sustained levels since 2018, which was supposed to kill the price rally. In contrast, all the current data (and our own experience) shows that inventories have, in fact, decreased significantly since January. The result up to this point is clear – Demand strength at high prices continues to be underestimated in analyst forecasts, and buyers’ inability to restock is causing a hand-to-mouth dynamic that is driving prices higher and inventories lower. To solve the structural shortage, sustained higher levels of imports are required. A risk to that occurring is the fact that imports tend to decrease going into the end of the year when taxes on inventory become a part of a steel buyer’s calculation. Operating in an unprecedented price environment increases uncertainty; however, the imbalance between supply and demand has driven the rally up to this point. Consumers not buying material that it is available when they have the backlog to support it will drive domestic prices higher by diminishing competition at the mills.
Below are the most pertinent upside and downside price risks:
Upside Risks:
Downside Risks:
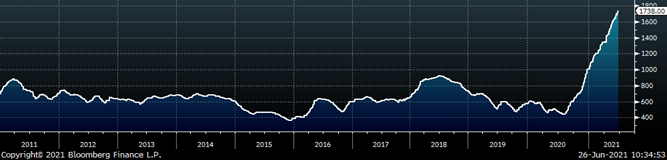
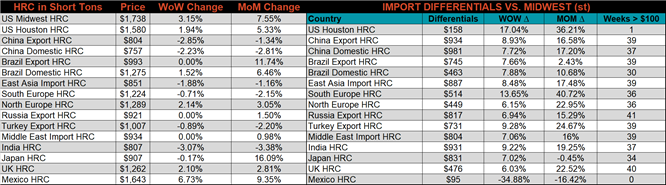
The Platts TSI Daily Midwest HRC Index increased by $53 to $1,738.
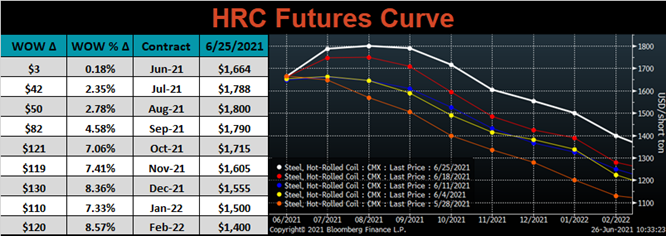
The CME Midwest HRC futures curve is below with last Friday’s settlements in white. Last week, the entire curve shifted higher, most significant in later months.
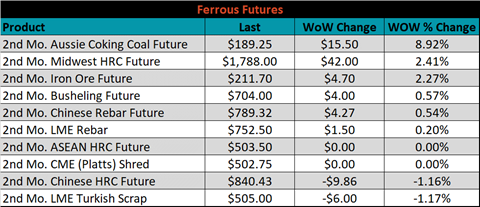
July ferrous futures were mixed. Aussie coking coal gained another 8.9%, while Turkish scrap was down 1.2%.
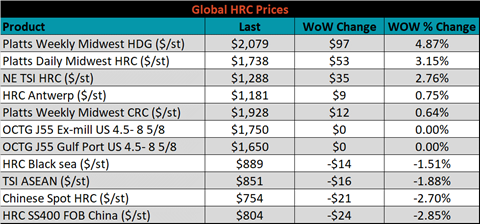
Global flat rolled indexes were mixed. TSI Platts Midwest HDG was up 4.9%, while the Chinese export HRC price was down 2.9%.
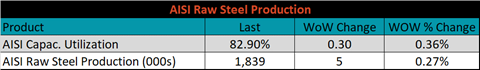
The AISI Capacity Utilization rate increased 0.3% to 82.9%.
June flat rolled import license data is forecasting a decrease of 17k to 919k MoM.
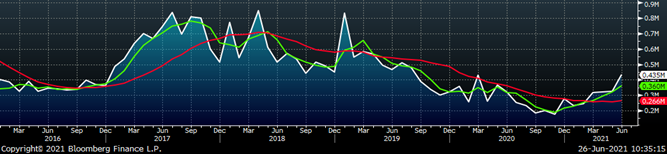
Tube imports license data is forecasting an increase of 109k to 435k in June.
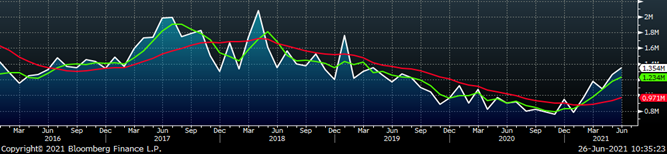
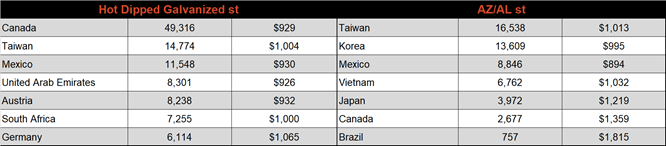
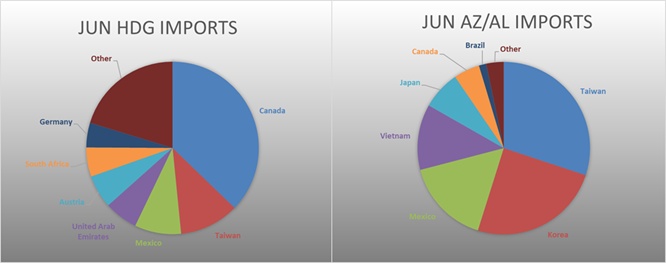
June AZ/AL import license data is forecasting a decrease of 17k to 76k.
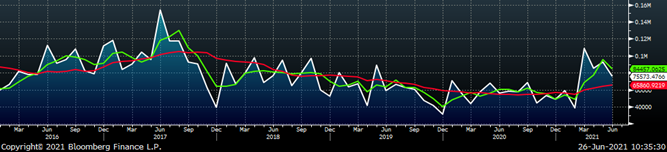
Below is June import license data through June 22nd, 2021.
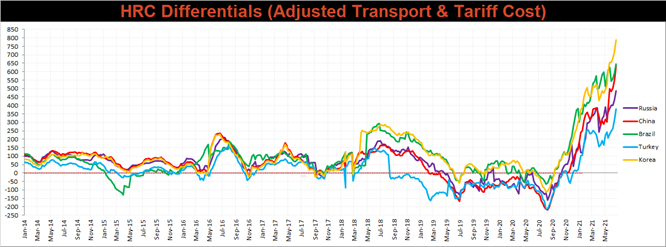
Below is the Midwest HRC price vs. each listed country’s export price using pricing from SBB Platts. We have adjusted each export price to include any tariff or transportation cost to get a comparable delivered price. This week, the overall trend of increasing differentials continued, as the increasing Midwest HRC price outpaced the rest of the world.
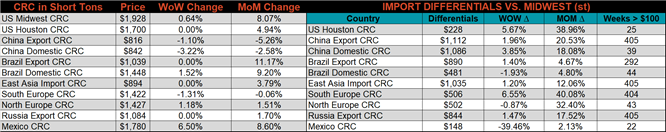
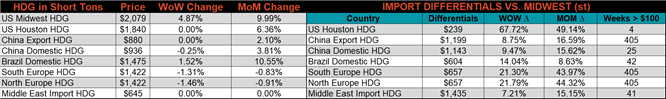
SBB Platt’s HRC, CRC and HDG pricing is below. The Midwest HDG, HRC, & CRC prices were up, 4.9%, 3.2% and 0.6%, respectively. Globally, the Mexican domestic HRC price was up 6.7%.
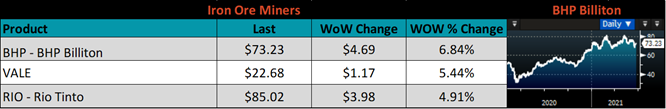
Raw material prices were mixed, with Aussie coking coal up another 4.2%, while Black Sea pig iron was down 4.4%.
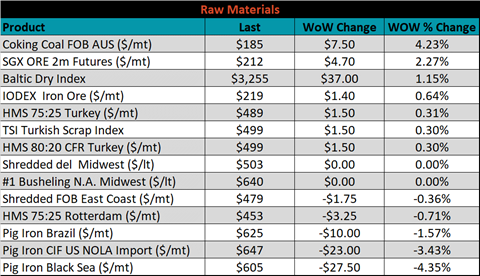
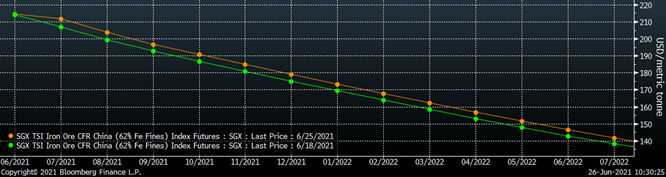
Below is the iron ore future curve with Friday’s settlements in orange, and the prior week’s settlements in green. Last week, the entire curve shifted slightly higher.
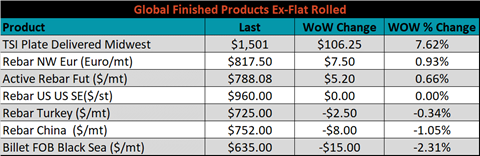
The ex-flat rolled prices are listed below.

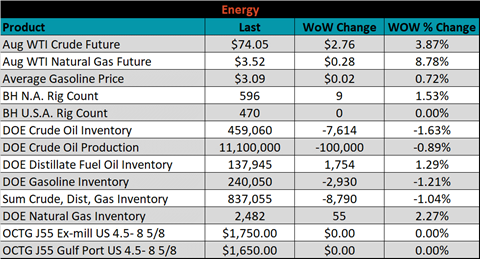
Last week, the August WTI crude oil future was up another $2.76 or 3.9% to $74.05/bbl. The aggregate inventory level was down 1%, and crude oil production was down to 11.1m bbl/day. The Baker Hughes North American rig count was up 9 rigs, and the U.S. rig count was unchanged.
The list below details some upside and downside risks relevant to the steel industry. The orange ones are occurring or look to be highly likely. The upside risks look to be in control.
Upside Risks:
Downside Risks: