

June 3, 2022

Market Commentary
As the spot pricing continues to deteriorate, many are pointing towards an economic slowdown or recession ahead to support bearish views. While economic growth has slowed from the high levels coming out of the pandemic among rate increases and inflation, we do not view a recession as likely in the coming months. Interestingly, several strong economic data points were released last week and are analyzed below. We maintain our view that spot prices will continue to decline, but elevated cost support and decreasing price differentials will provide support into the end of the year as inventories decline and imports slow. The back end of the forward curve provides an attractive opportunity to buy tons at a discount to the spot price.
ISM PMI
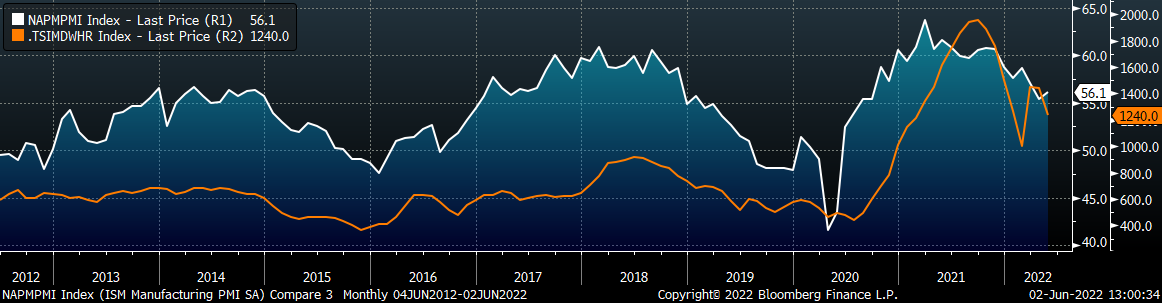
The chart below is the Platts Midwest HRC index (orange) and the ISM Manufacturing PMI (white). The topline ISM Manufacturing PMI index beat expectations and moved higher into expansion territory, while the Midwest HRC price fell in May.
The May ISM Manufacturing PMI and subindexes are below.
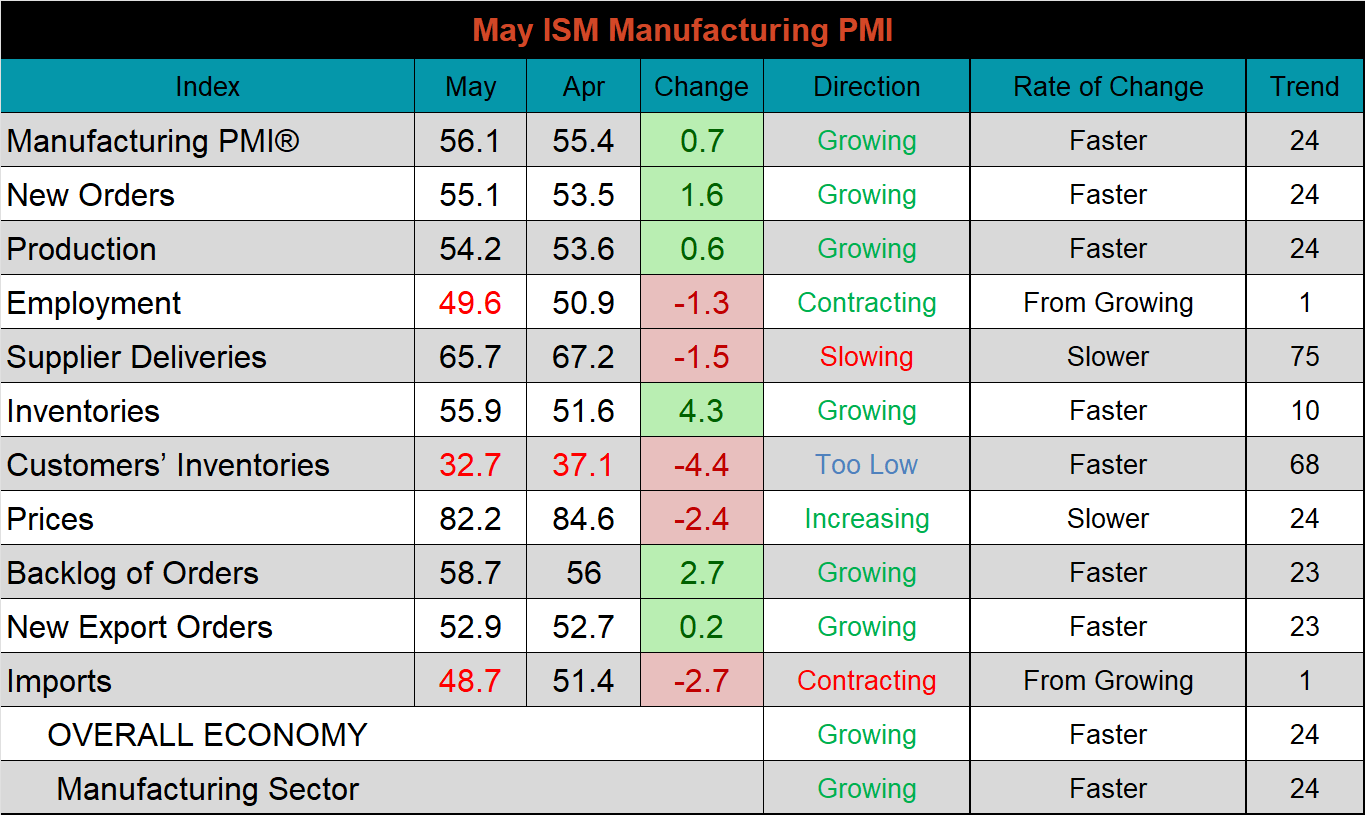
The overall takeaway from this report is that the demand subindexes increased, driven mostly by increases to new orders and the backlog. The input subindexes were also higher this month, but they remain in contraction as logistics problems and diminished imports put pressure on the supply chain. Consumption was slightly lower on the month, driven by a contraction in employment.
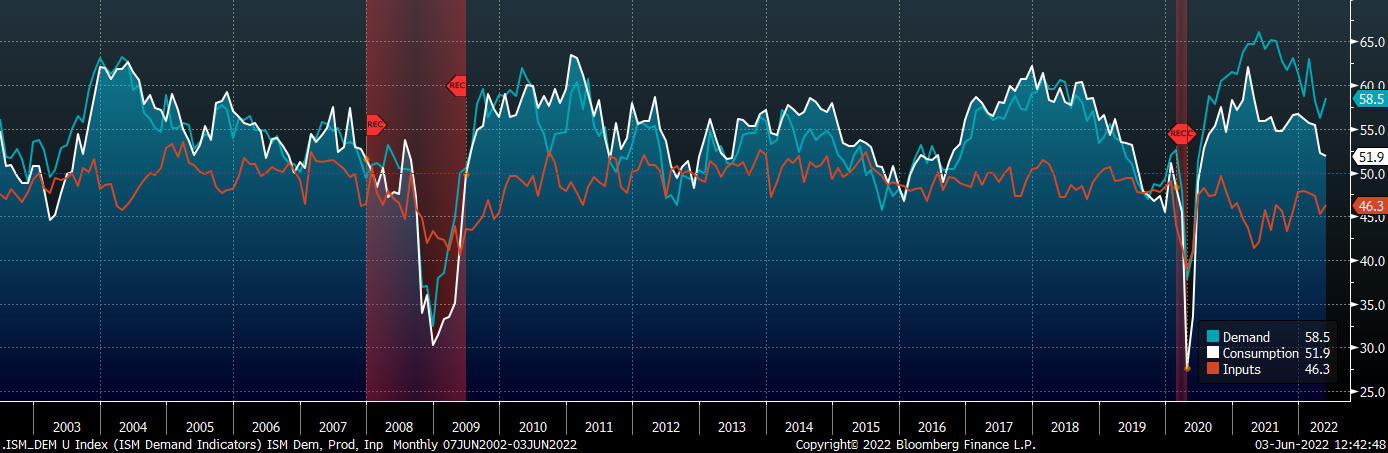
ISM Manufacturing PMI: Demand (blue), Consumption (white), & Inputs (orange)
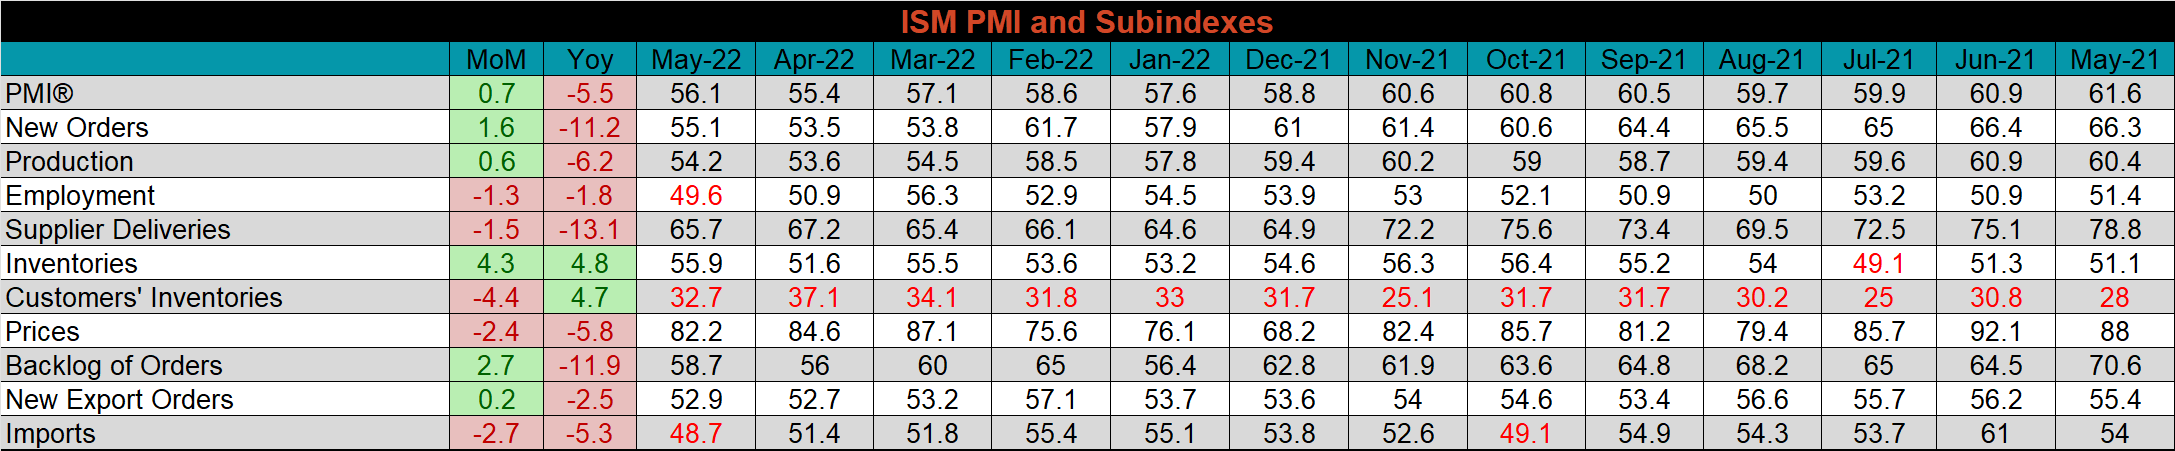
The table below shows the historical values of each subindex over the last year.
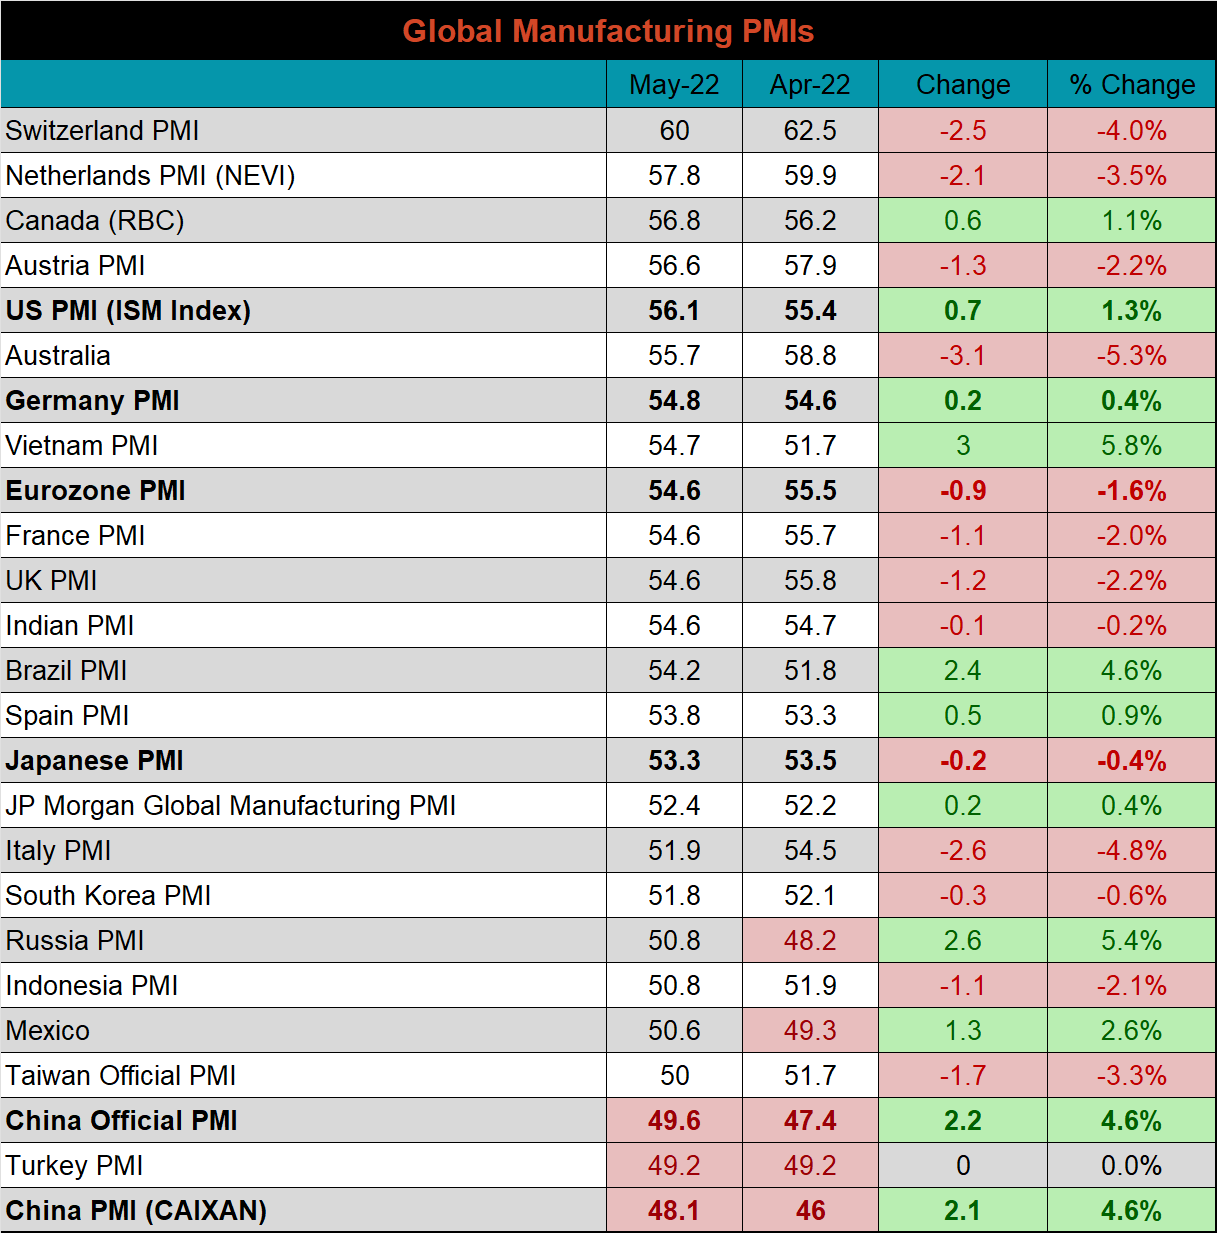
Global PMI
May global PMI printings depict another month of an overall expanding global manufacturing sector. China and Turkey are the only two countries with contracting manufacturing sectors but 13 out of the 22 watched countries were softer.
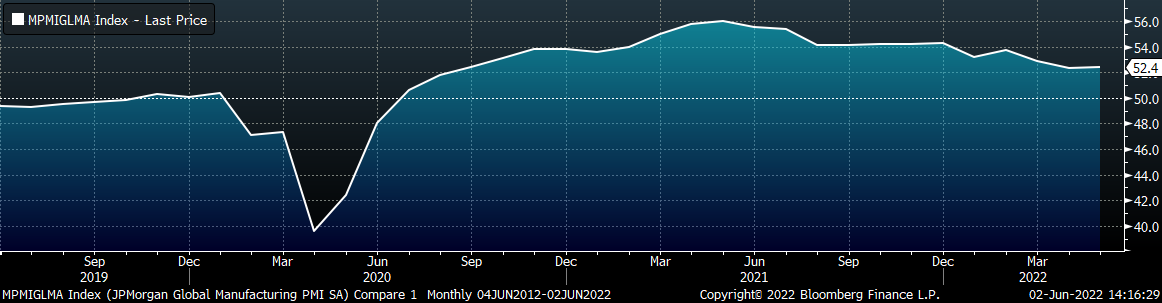
J.P. Morgan Global Manufacturing
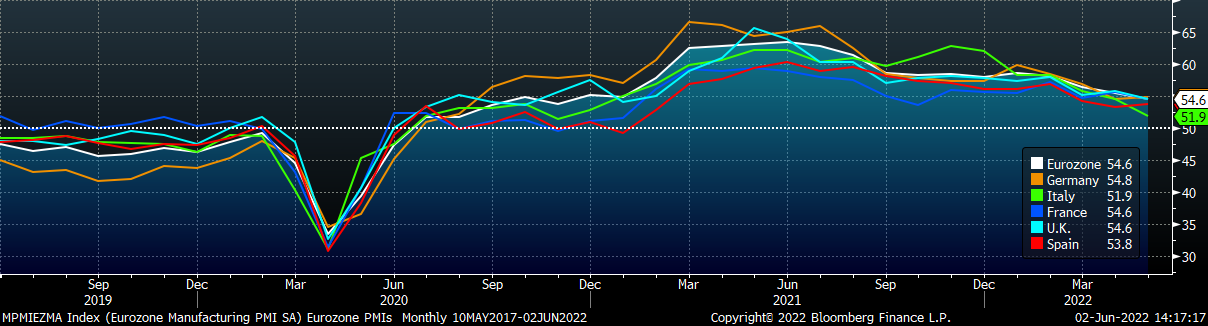
Eurozone (white), German (orange), Italian (green), Spanish (red), and French (blue), U.K. (teal) Manufacturing PMIs
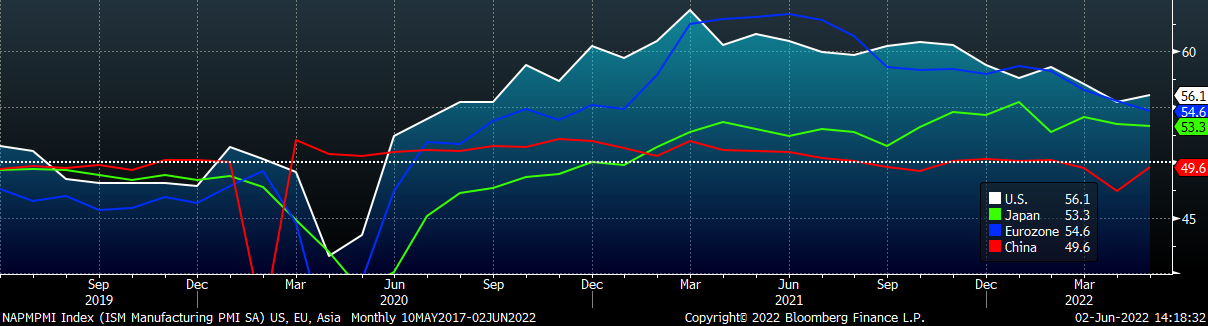
US (white), Euro (blue), Chinese (red) and Japanese (green) Manufacturing PMIs
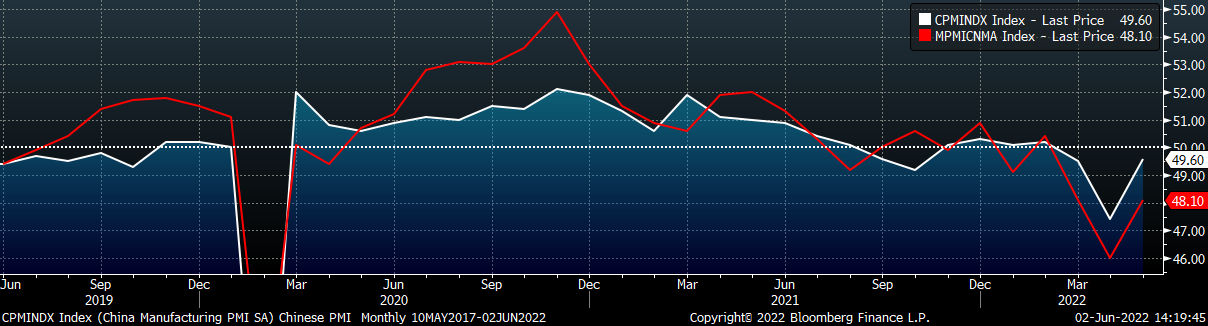
The Caixan and Chinese official PMI indexes both rebounded but remain in contraction territory.
China Official (white) and Caixan (red) Manufacturing PMIs
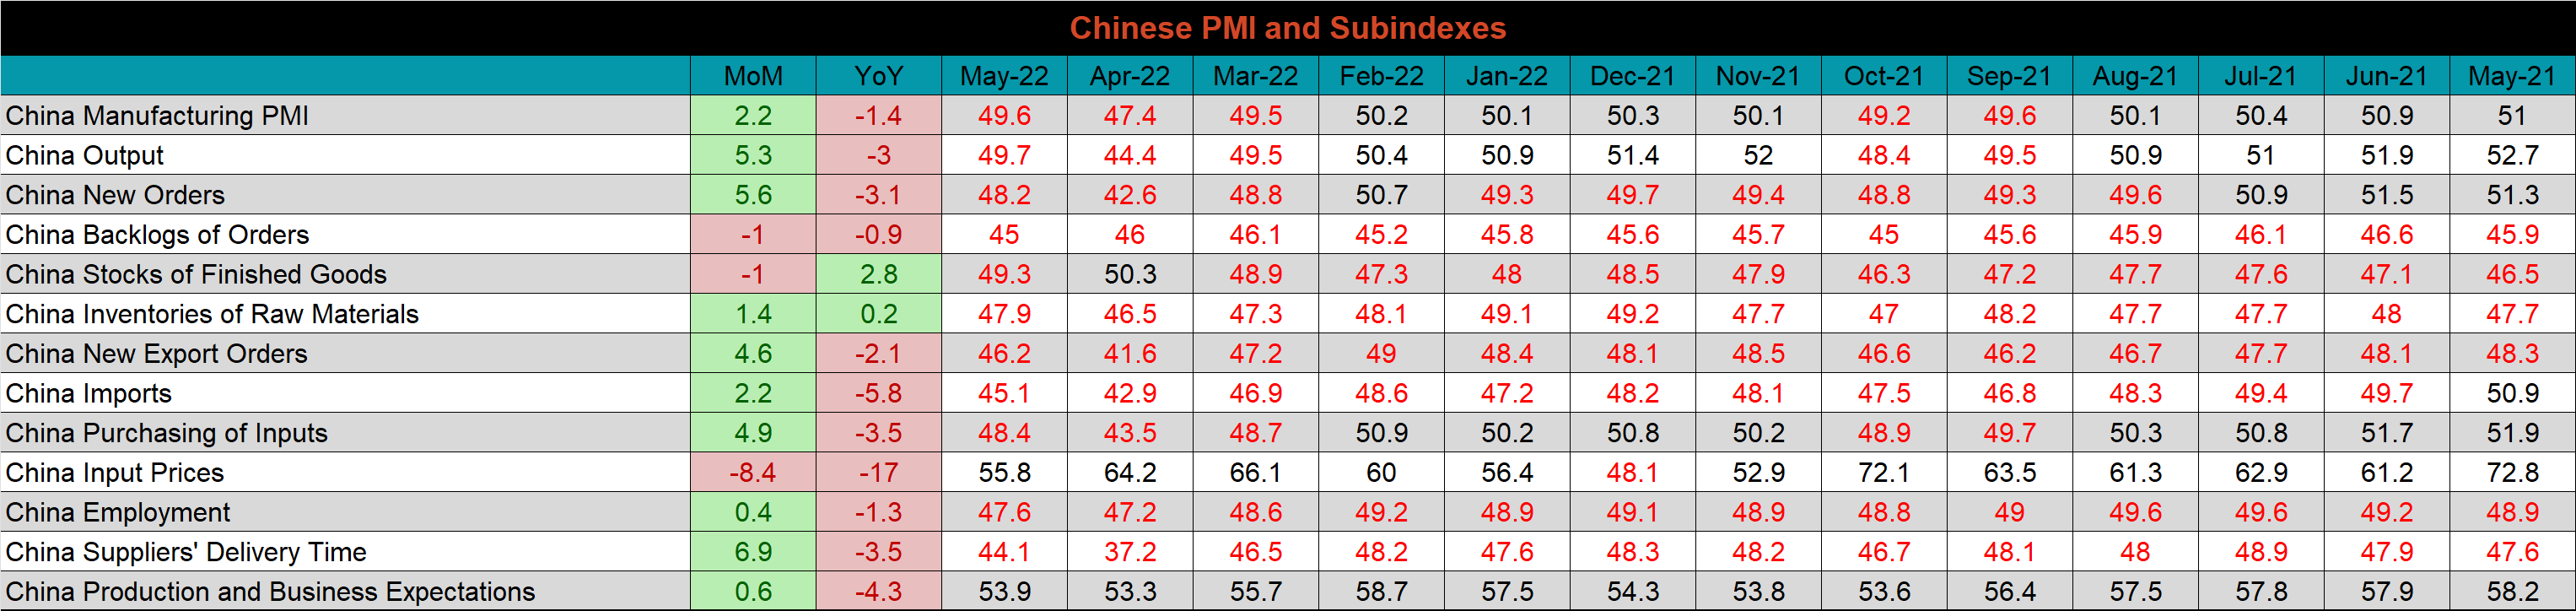
The table below breaks down China’s official manufacturing PMI subindexes. Input prices were down the most MoM. New orders and output remain in contraction but both improved by 5.6, and 5.3 points, respectively.
Construction Spending
April seasonally adjusted U.S. construction spending was up 0.2% MoM and 12.3% higher than April 2021.
April U.S. Construction Spending
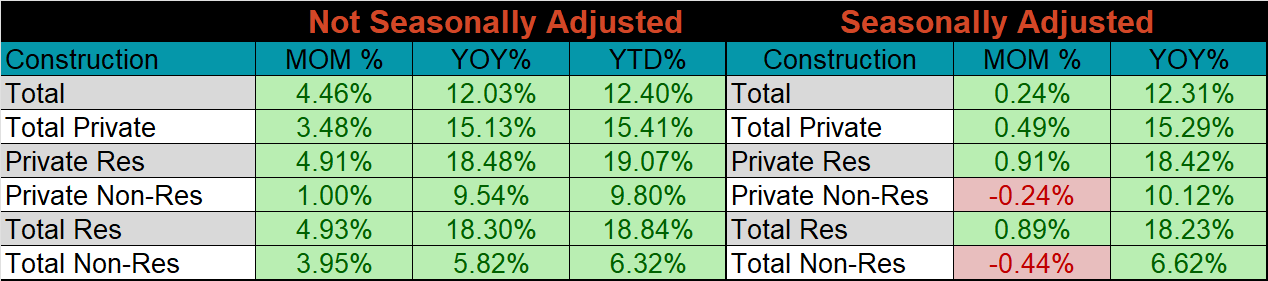
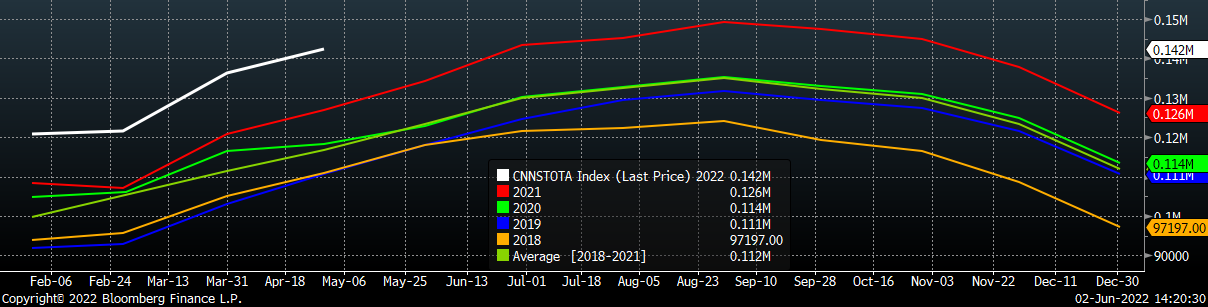
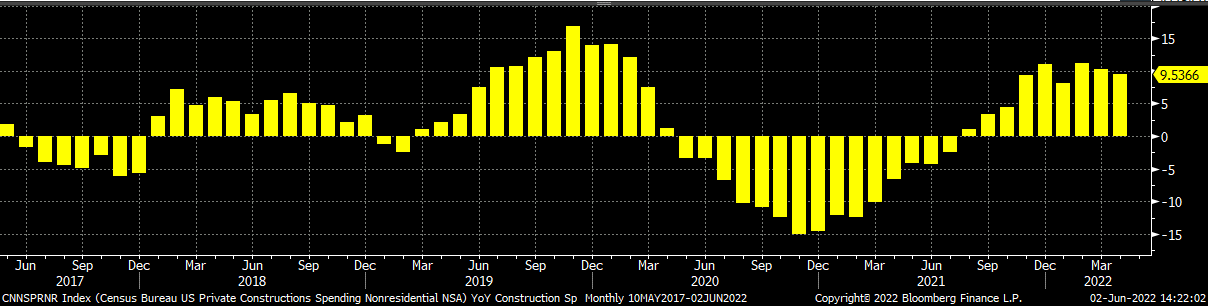
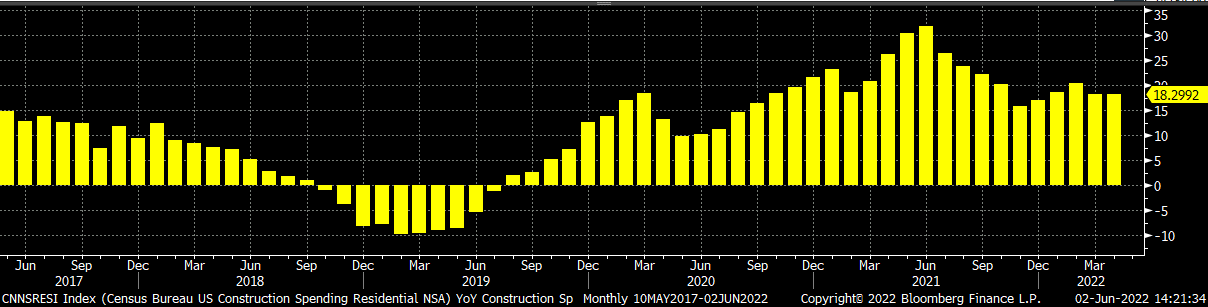
The white line in the chart below shows this the strength in this year’s not seasonally adjusted construction spending in 2022, compared to the spending of the previous 4 years. The two bottom charts below show the YoY changes in construction spending. Both residential and non-residential spending continue to grow. The residential growth rate was essentially unchanged, while non-residential was slightly lower than last year.
U.S. Construction Spending NSA
U.S. Private Nonresidential Construction Spending NSA YoY % Change
U.S. Residential Construction Spending NSA YoY % Change
Auto Sales
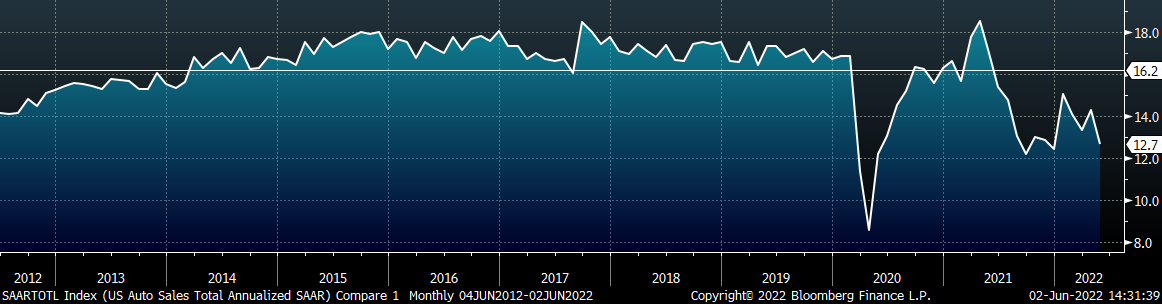
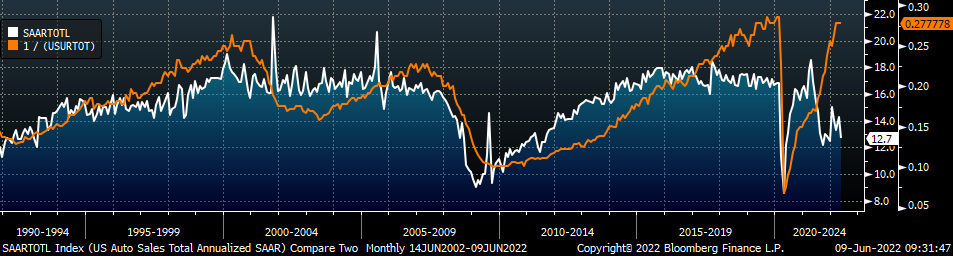
May U.S. light vehicle sales fell to a 12.7M seasonally adjusted annualized rate (S.A.A.R) they continued to be well below the 10-year average of 16.2m, as supply chain woes continue to impact both production and sales within the sector. The second chart shows the relationship between the unemployment rate and auto sales. The unemployment rate is inverted to show that declining unemployment typically leads to increasing auto sales. The labor market remains strong, and the unemployment rate was unchanged. The gap between auto sales and the labor market continues to be historically wide driven by supply chain shortages.
May U.S. Auto Sales (S.A.A.R.)
May U.S. Auto Sales (orange) and the Inverted Unemployment Rate (white)
Risks
Below are the most pertinent upside and downside price risks:
Upside Risks:
- Inventory at end users and service centers below normal operational levels
- China reopening their economy with further stimulus measures
- Unplanned & extended planned outages, including operational issues leaving mills behind
- Seasonal pick-up in demand leading to regional shortages
- Further increases to mills input costs
Downside Risks:
- Elevated price differentials and hedging opportunities leading to sustained higher imports
- Steel consumers substitute to lower cost alternatives
- Tightening credit markets, as elevated prices push total costs to credit caps
- Limited desire to restock at elevated prices, causing a “Buyer’s Strike”
- Economic slowdown caused by increasing interest rates
HRC Futures
All of the below data points are as of June 3, 2022.
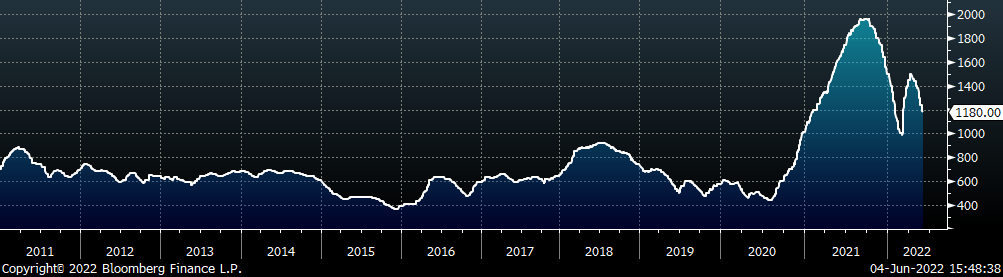
The Platts TSI Daily Midwest HRC Index was down another $60 to $1,180.
Platts TSI Daily Midwest HRC Index
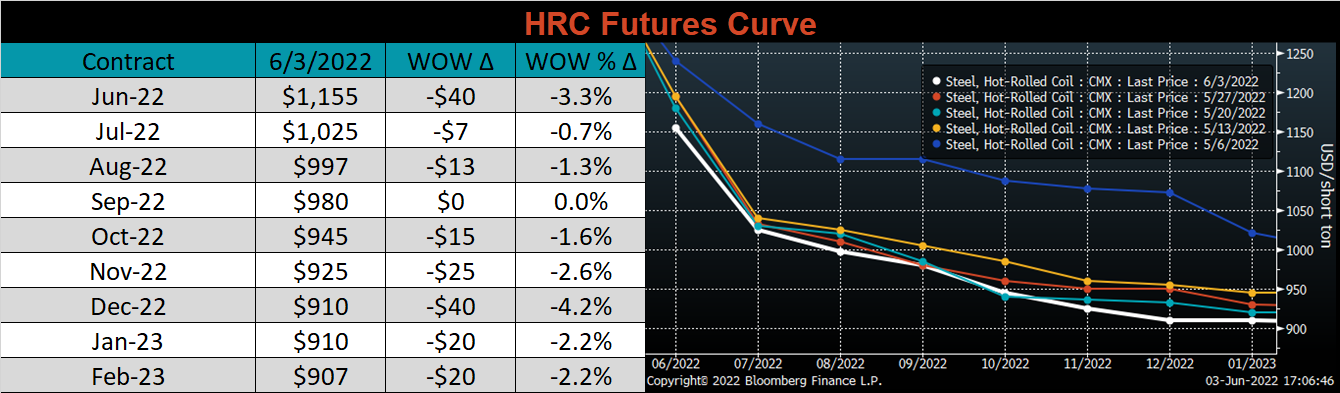
The CME Midwest HRC futures curve is below with last Friday’s settlements in white. The curve shifted slightly lower across all expirations.
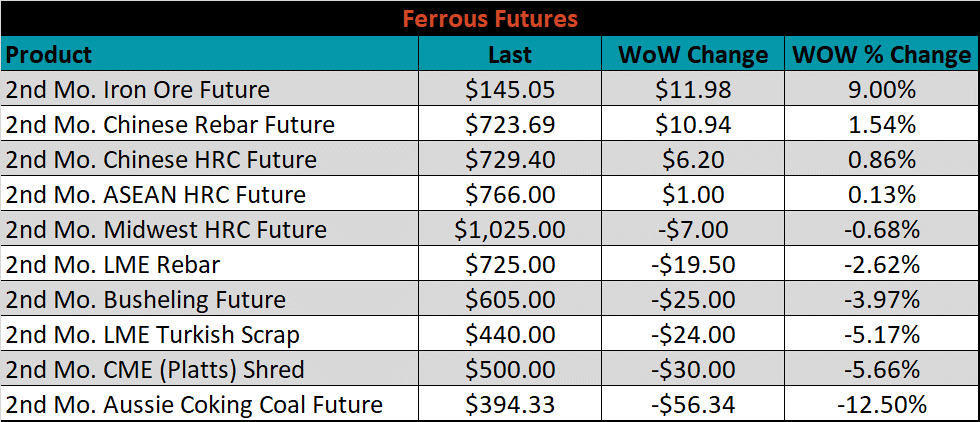
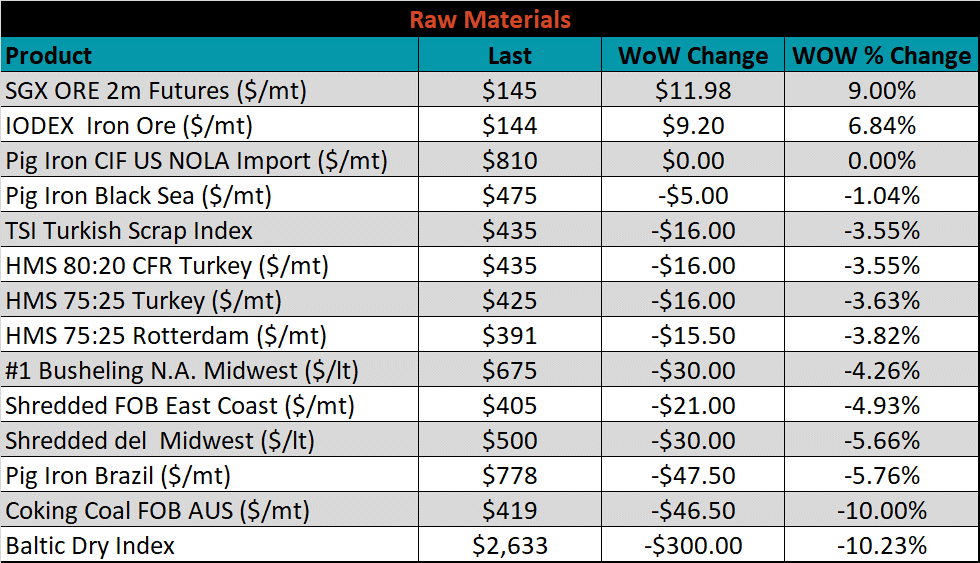
The 2nd month ferrous futures were mixed this week. Iron ore gained 9%, while Coking Coal lost 12.5%.
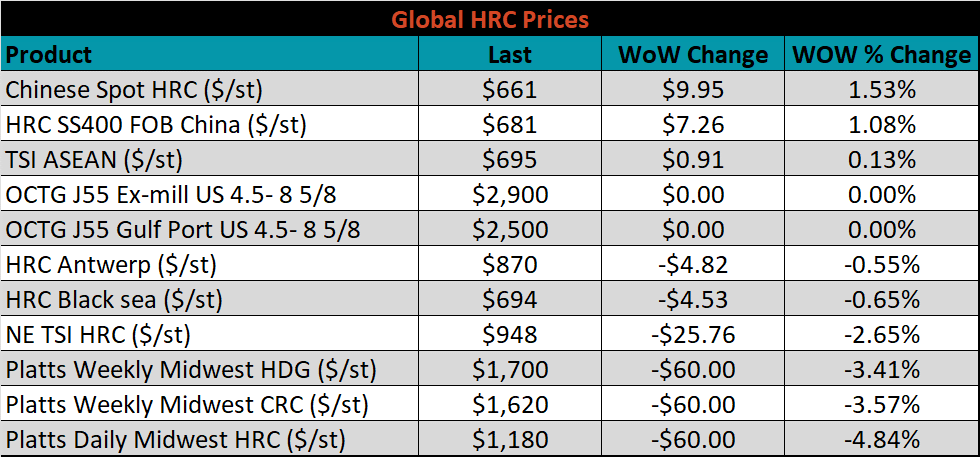
Global flat rolled indexes were mostly lower again, led by Midwest HRC, down another 4.8%, while Chinese HRC was up 1.5%.
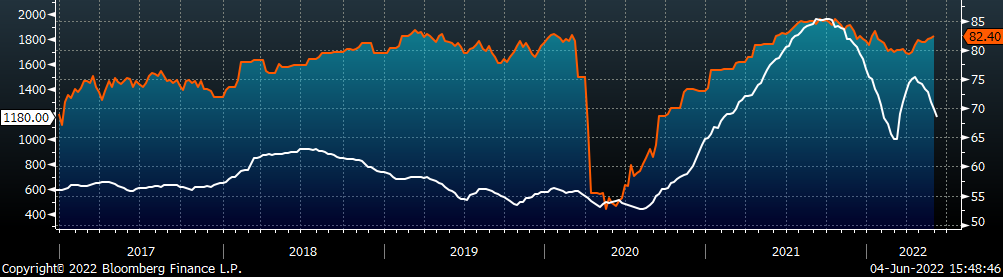
The AISI Capacity Utilization was up 0.4% to 82.4%.
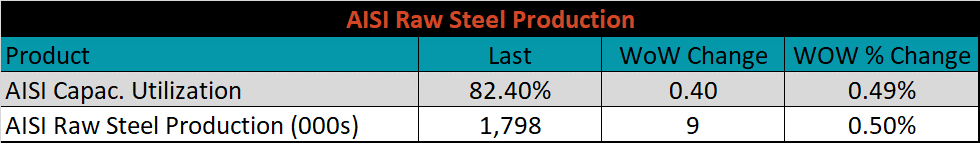
AISI Steel Capacity Utilization Rate (orange) and Platts TSI Daily Midwest HRC Index (white)
Imports & Differentials
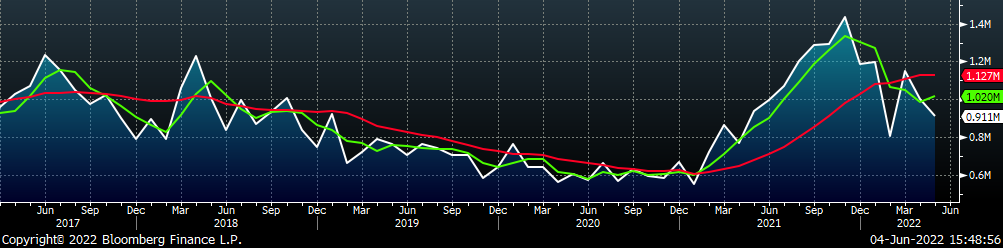
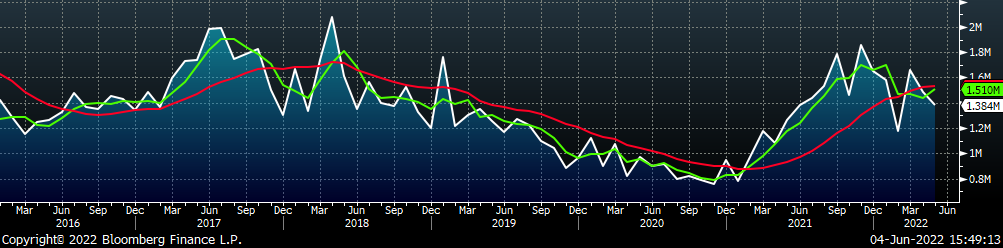
May flat rolled import license data is forecasting a decrease of 89k to 911k MoM.
All Sheet Imports (white) w/ 3-Mo. (green) & 12-Mo. Moving Average (red)
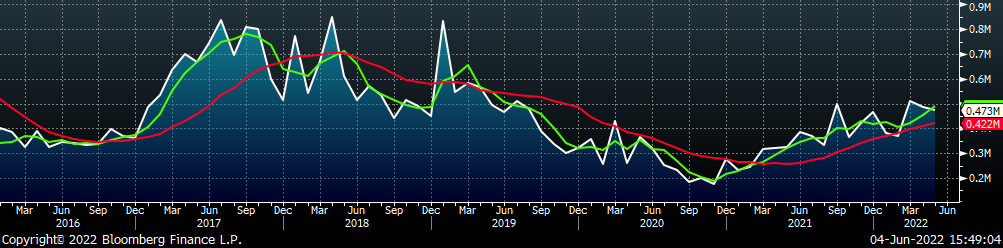
Tube imports license data is forecasting an decrease of 12k to 473k in May.
All Tube Imports (white) w/ 3-Mo. (green) & 12-Mo. Moving Average (red)
All Sheet plus Tube (white) w/ 3-Mo. (green) & 12-Mo. Moving Average (red)
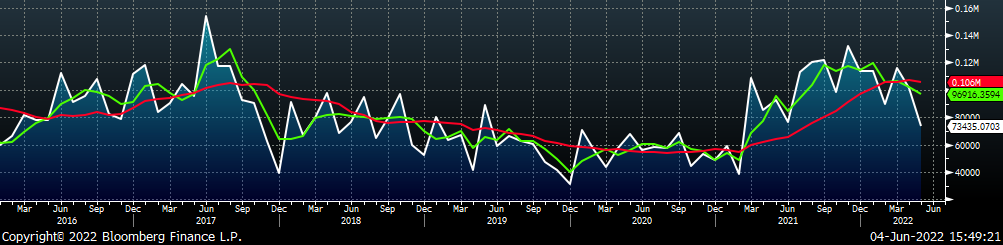
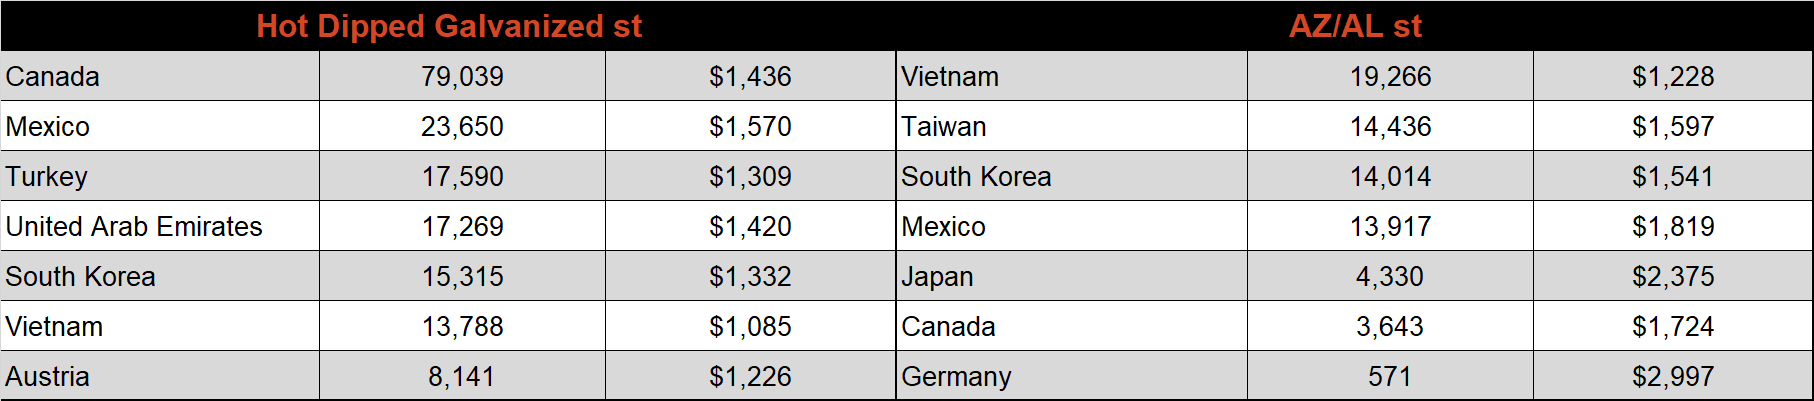
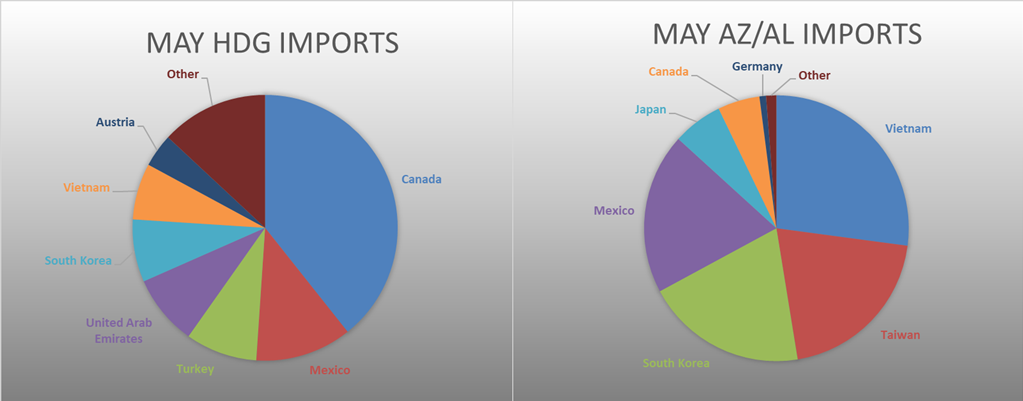
May AZ/AL import license data is forecasting a decrease of 28k to 73k.
Galvalume Imports (white) w/ 3 Mo. (green) & 12 Mo. Moving Average (red)
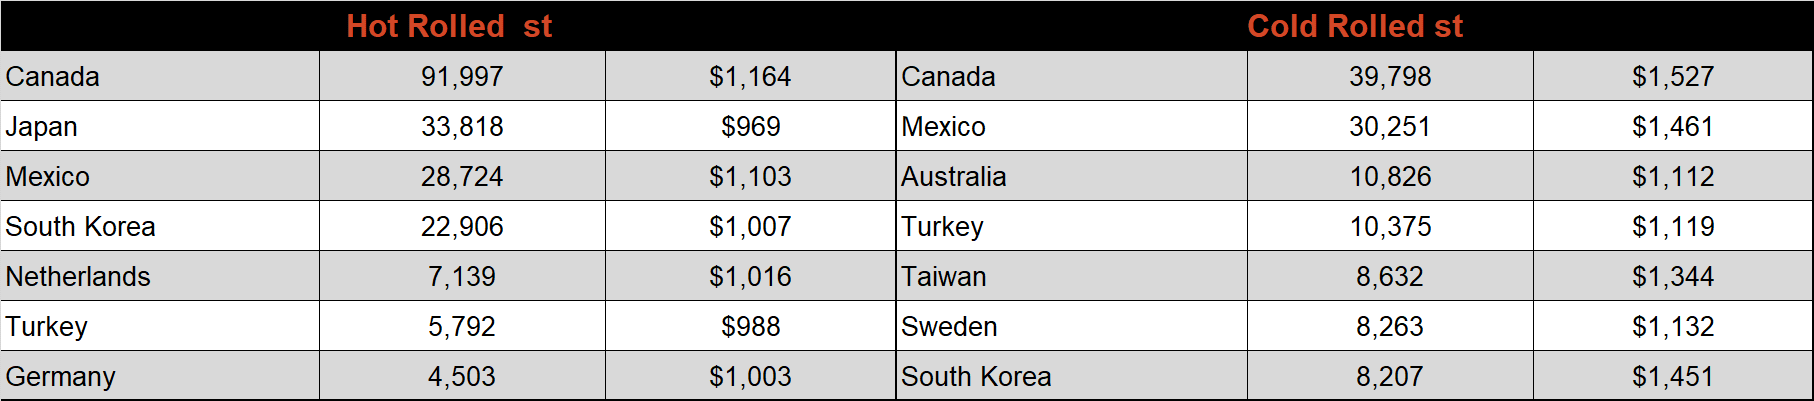
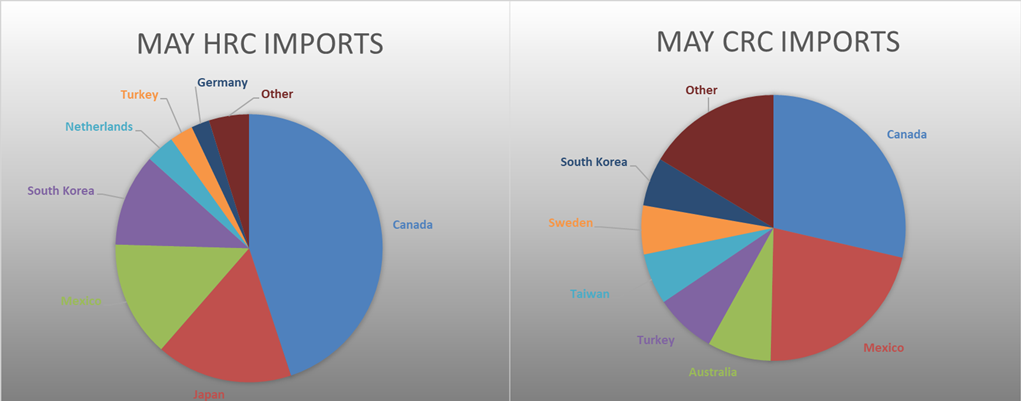
Below is May import license data through May 30th, 2022.
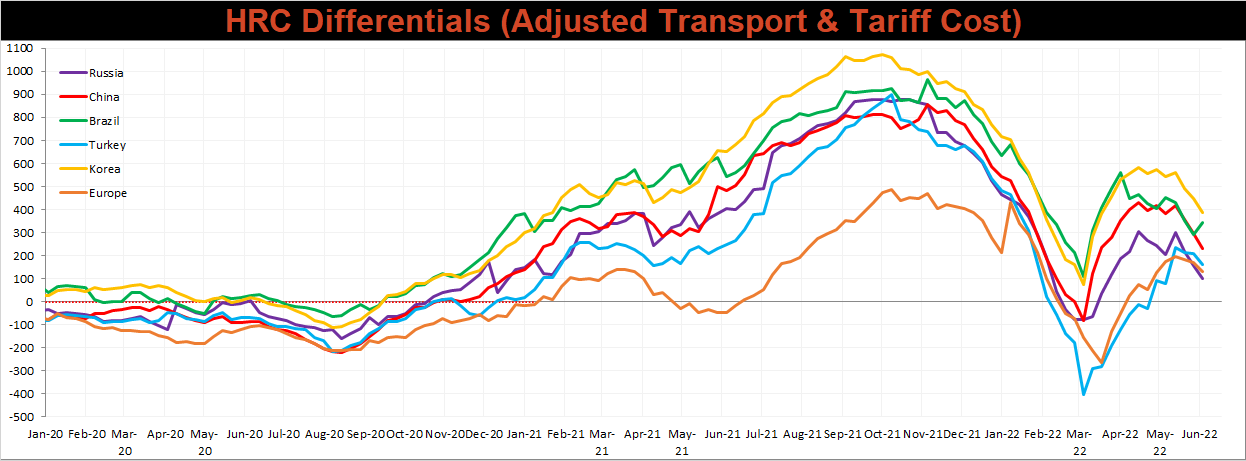
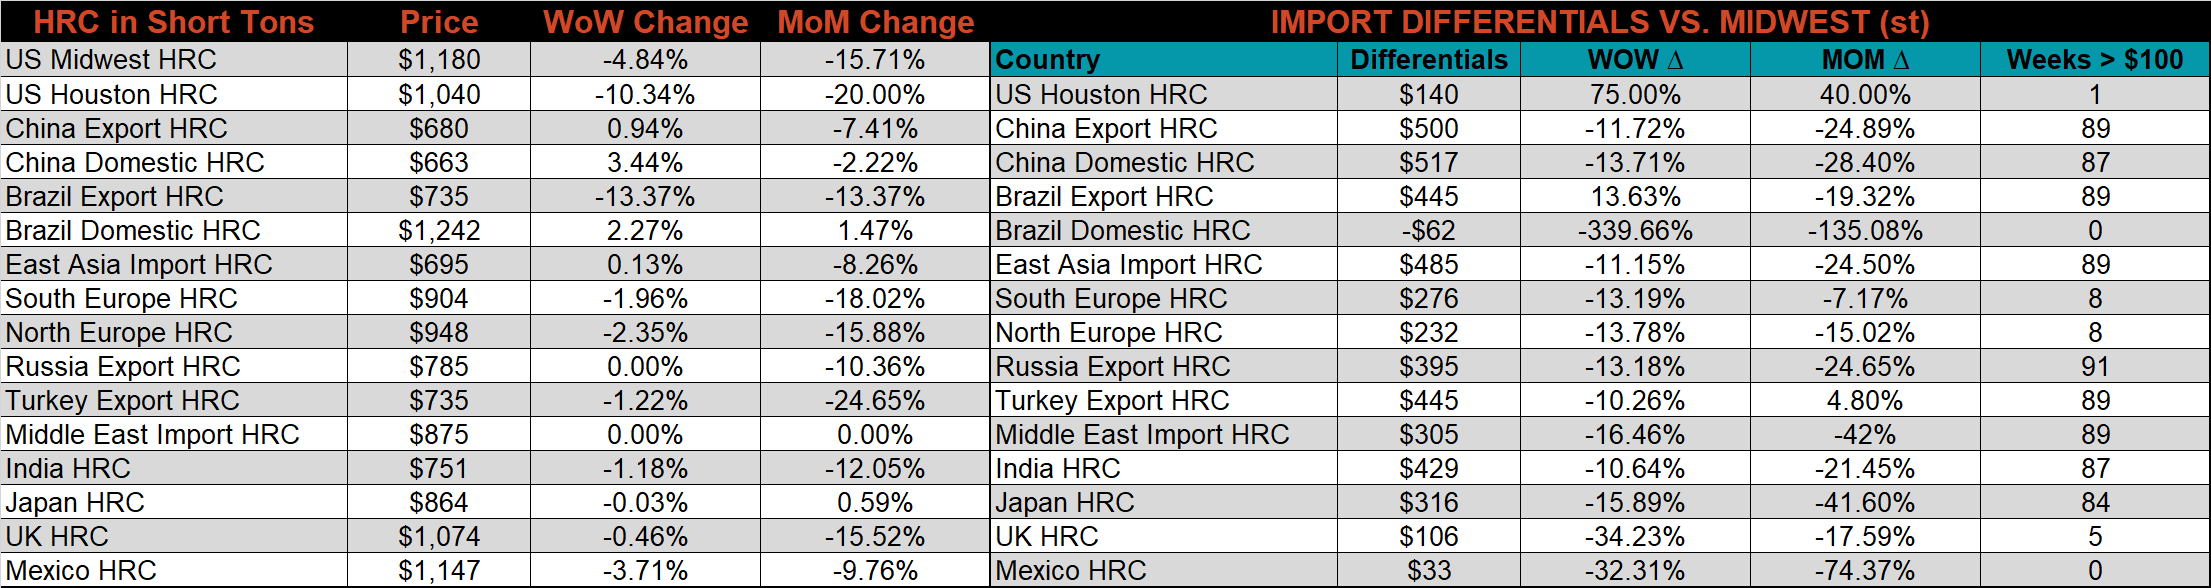
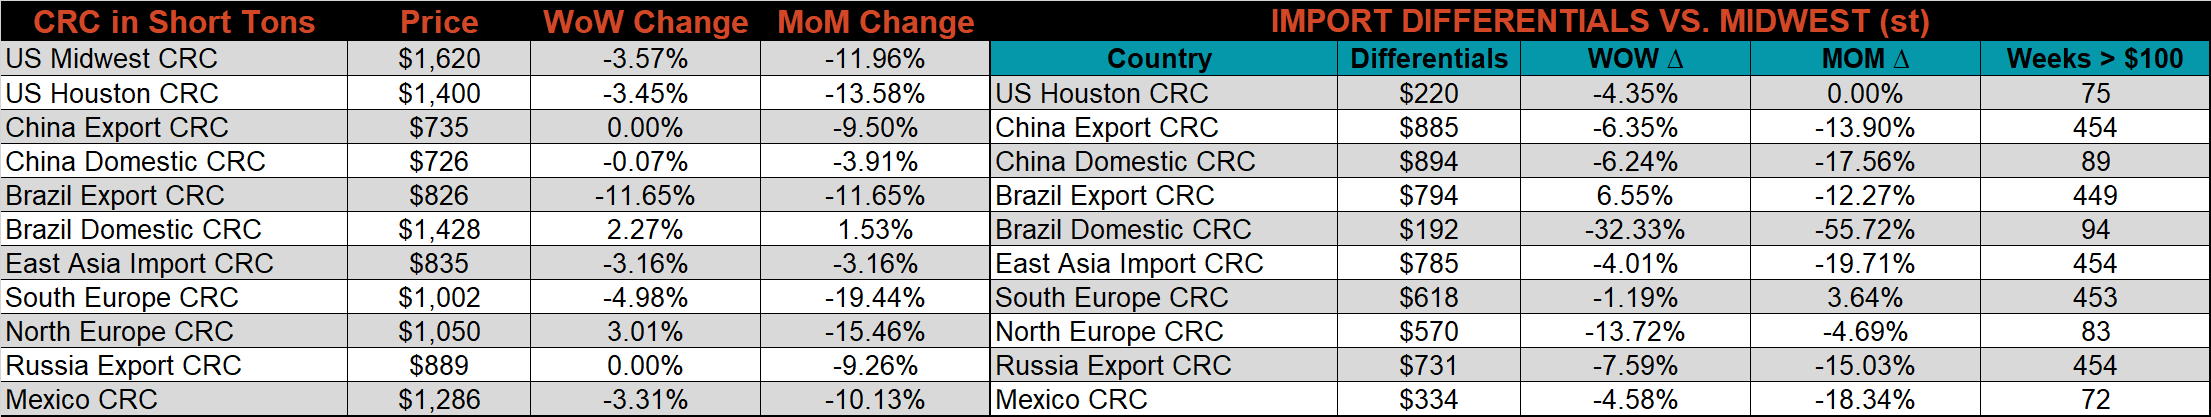
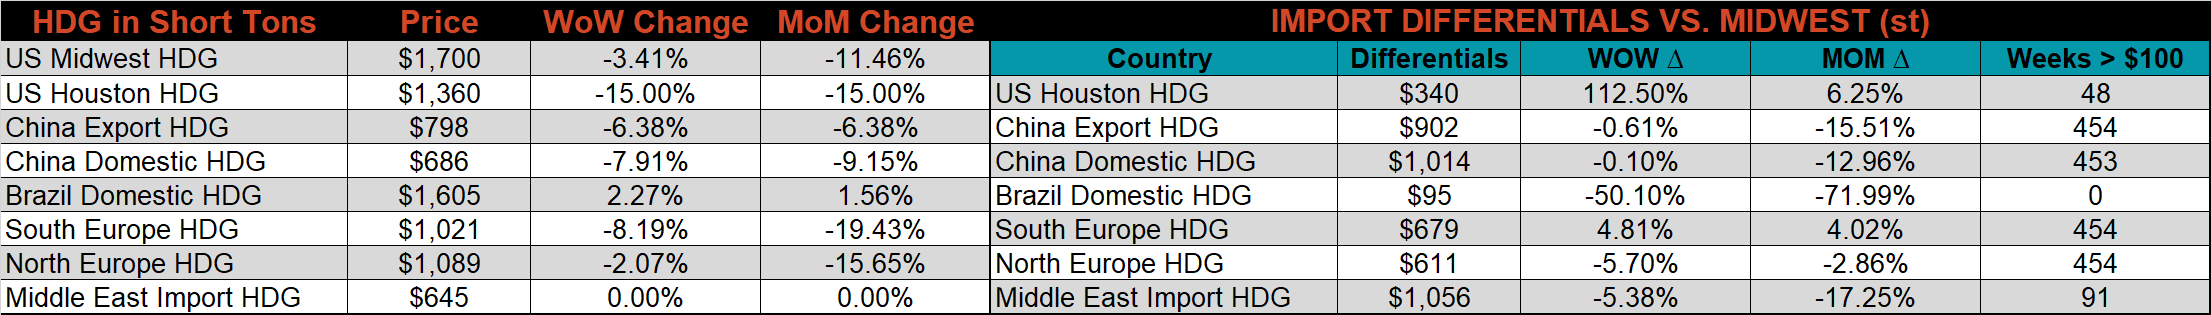
Below is the Midwest HRC price vs. each listed country’s export price using pricing from SBB Platts. We have adjusted each export price to include any tariff or transportation cost to get a comparable delivered price. Differentials decreased across the board less Brazil, whose price decreased more than the U.S. price.
SBB Platt’s HRC, CRC and HDG pricing is below. The Midwest HRC, CRC, & HDG prices were down 4.8%, 3.6%, & 3.4%, respectively. Outside of the U.S., the Brazilian CRC export price was down the most, down 11.7%.
Raw Materials
Raw material prices were all lower this week, led by coking coal, down 10.0%.
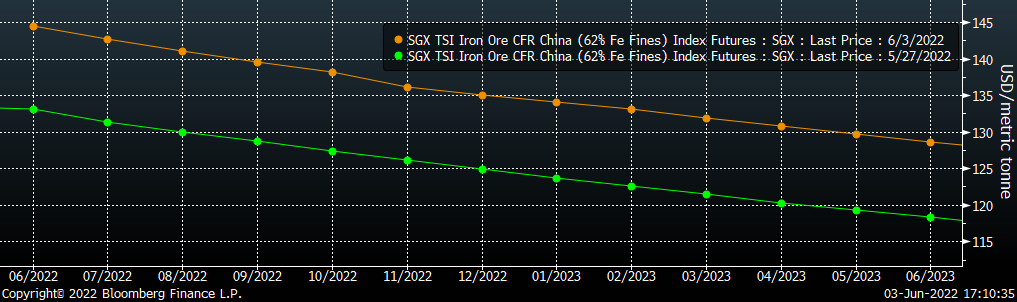
Below is the iron ore future curve with Friday’s settlements in orange, and the prior week’s settlements in green. Last week, the entre curve shifted higher, as optimism surrouding the reopening of China’s economy caused a $8-10 difference between ths week and last week’s prices.
SGX Iron Ore Futures Curve
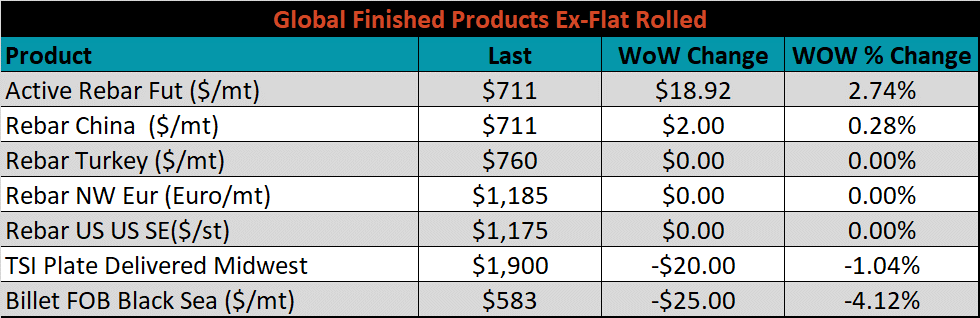
The ex-flat rolled prices are listed below.

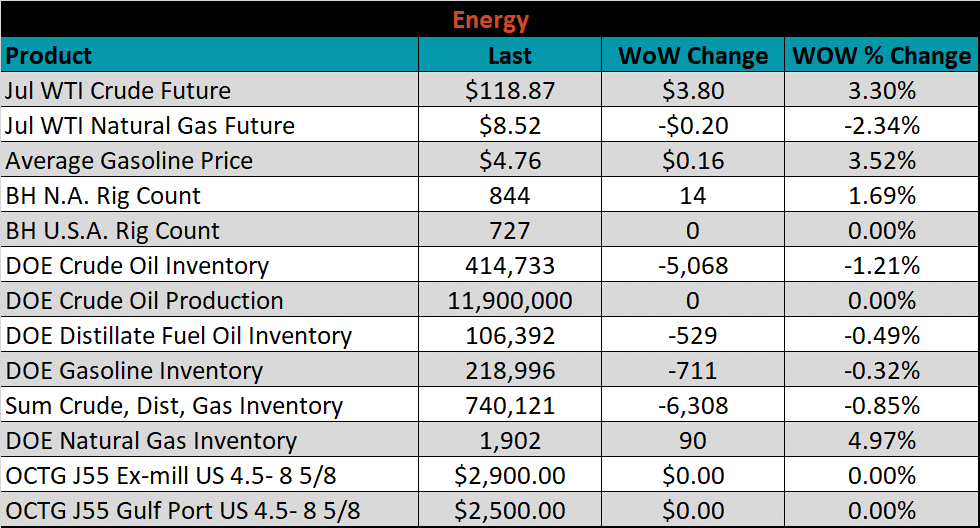
Energy
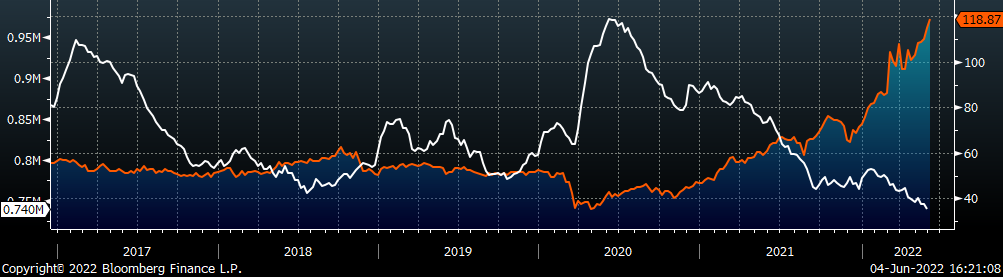
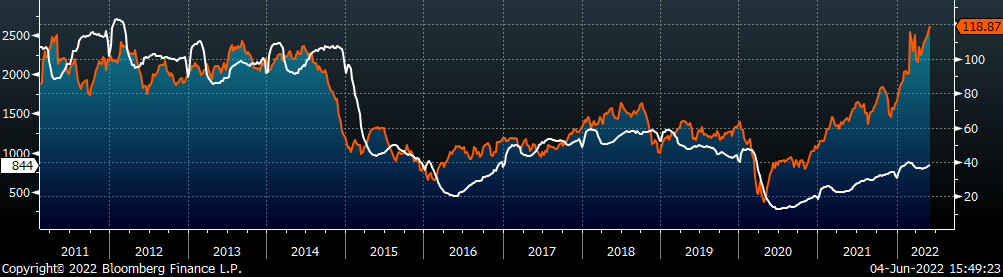
Last week, the July WTI crude oil future gained $3.80 or 3.3% to $118.87/bbl. The aggregate inventory level was up 0.3% and crude oil production was steady at 11.9m bbl/day. The Baker Hughes North American rig count was up 14 rigs, while the U.S. rig count remained constant.
July WTI Crude Oil Futures (orange) vs. Aggregate Energy Inventory (white)
Front Month WTI Crude Oil Future (orange) and Baker Hughes N.A. Rig Count (white)
The list below details some upside and downside risks relevant to the steel industry. The bolded ones are occurring or highly likely.
Upside Risks:
- Inventory at end users and service centers below normal operational levels
- Higher share of discretionary income allocated to goods from steel intensive industries
- Changes in China’s policies regarding ferrous markets, including production cuts and exports
- Unplanned & extended planned outages, including operational issues leaving mills behind
- Energy & construction industry rebound
- Easing labor and supply chain constraints allowing increased manufacturing activity
- Mills extending outages/taking down capacity to keep prices elevated
- Global supply chains and logistics restraints causing regional shortages
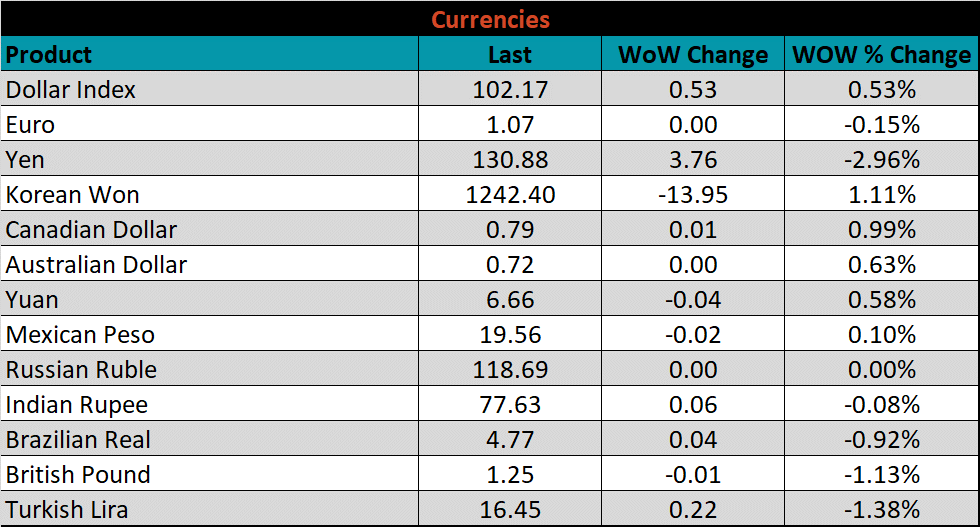
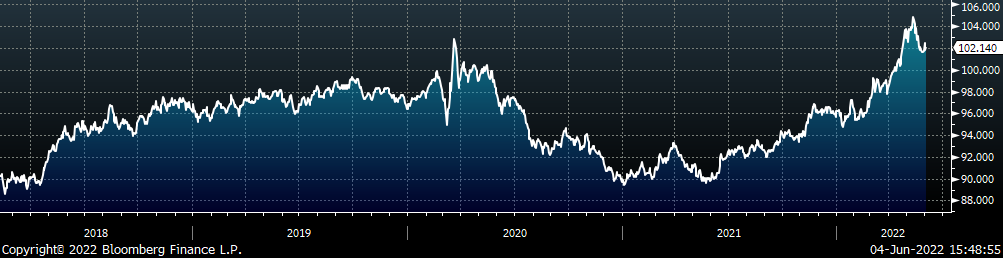
- A weakening US Dollar
- Fiscal policy measures including a new stimulus and/or infrastructure package
- Fluctuating auto production, pushing steel demand out into the future
- Low interest rates
- Threat of further protectionist trade policies muting imports
- Unexpected and sustained inflation
Downside Risks:
- Increased domestic production capacity
- Elevated price differentials and hedging opportunities leading to sustained higher imports
- Steel consumers substitute to lower cost alternatives
- Steel buyers and consumers “double ordering” to more than cover steel needs
- Tightening credit markets, as elevated prices push total costs to credit caps
- Supply chain disruptions allowing producers to catch up on orders
- Limited desire to restock at elevated prices, causing a “Buyer’s Strike”
- Economic slowdown caused by the emergence of Coronavirus Variants
- Reduction and/or removal of domestic trade barriers
- Political & geopolitical uncertainty
- Chinese restrictions in property market
- Unexpected sharp China RMB devaluation