Content
-
Weekly Highlights
- Market Commentary
- Risks


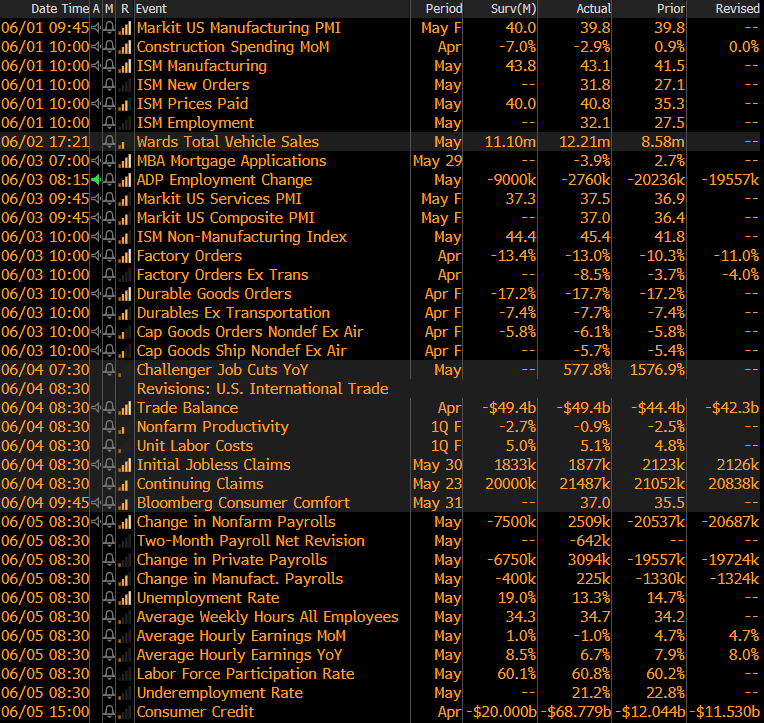
Last week multiple economic data reports with ties to the steel market were released, helping piece together important aspects of the price outlook. The below summarizes the key points from the ISM PMI report, with more detailed analysis of all the report further below. The May PMI printed up slightly from the recent low in April, but remains in contraction, firmly below the 50 threshold. The below chart shows the PMI versus the domestic HRC price, demonstrating the importance of the index in HRC price trends.
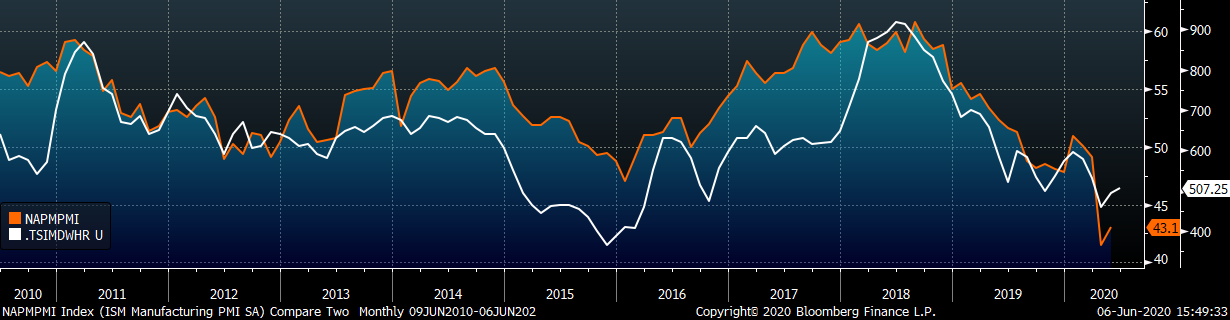
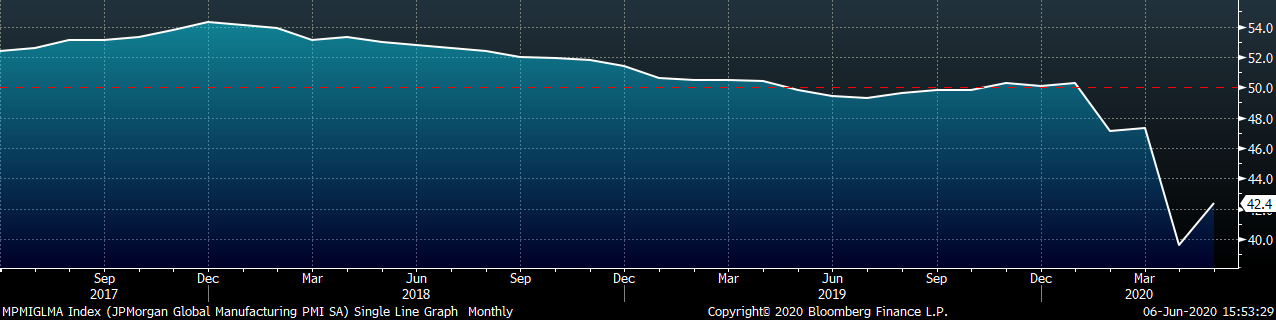
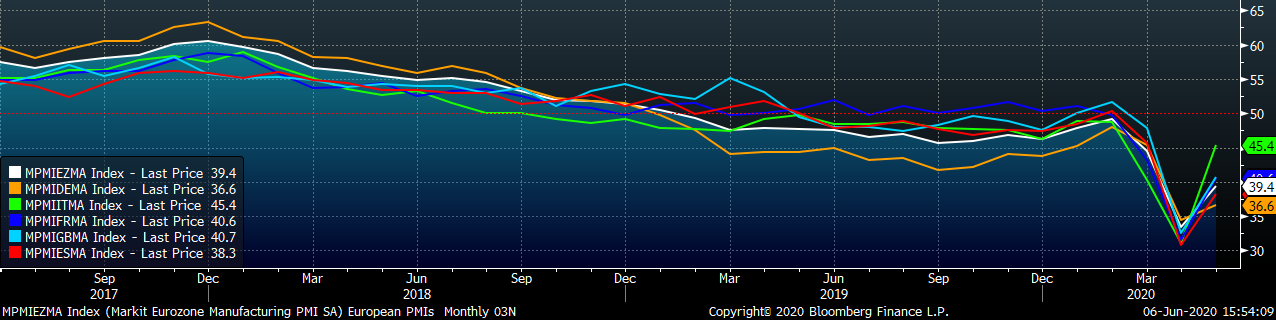
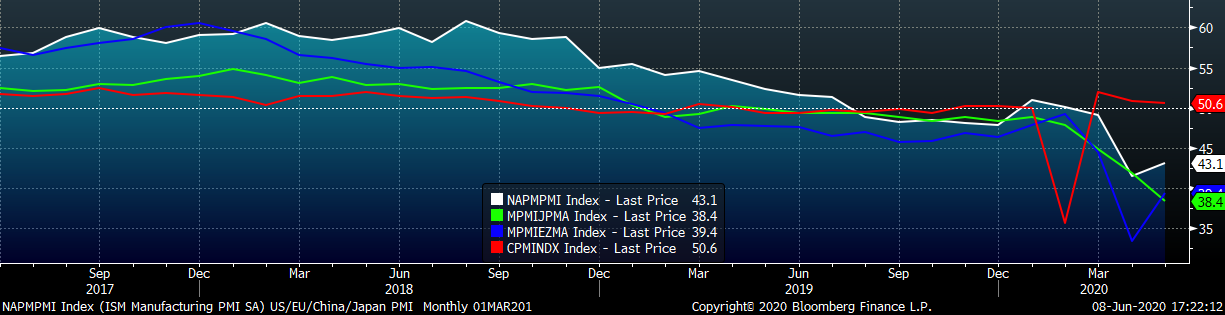
While the headline PMI and the HRC spot price have bounce off their lows, both have to move significantly higher to reach pre-coronavirus levels. Recently, this report compared the domestic HRC price recovery to that of the Chinese HRC price, showing a lag in the timing of the recovery as well as higher upside to the domestic price if it followed the path of the China price recovery. However, comparing May’s PMI reading to those in China over the past few months, our manufacturing sector is seeing a much slower recovery. Both PMIs are in the chart below.
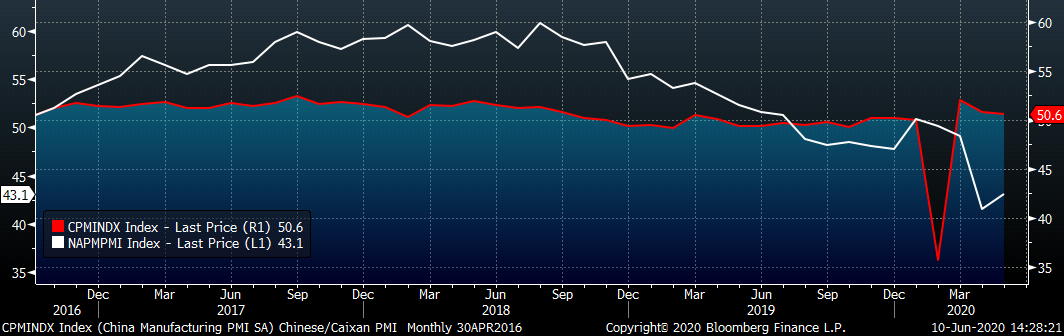
While the official PMI in China fell much lower during the height of their virus outbreak and shutdown, it completely recovered in the next month moving back into expansion. The U.S. manufacturing sector appears to be taking longer to recover due to a phased reopening of the economy, which will affect demand returning to the steel market. It is likely that idled furnaces will come back on with automotive demand simultaneously. However, mini mills have been operating at reduced rates over the last few months and will likely use the recent price rally to increase their production levels as they are currently selling at prices well above their marginal cost of production. With the forward curve in contago (future prices higher than the current spot price), the market is expecting that mills will not ramp up supply at a faster rate than the recovering demand, providing a needed catalyst for the stalled price rally. However, those with different expectations, or those with risk exposure to an alternative scenario playing out, should view the current curve as an opportunity to take advantage of the differing expectations.
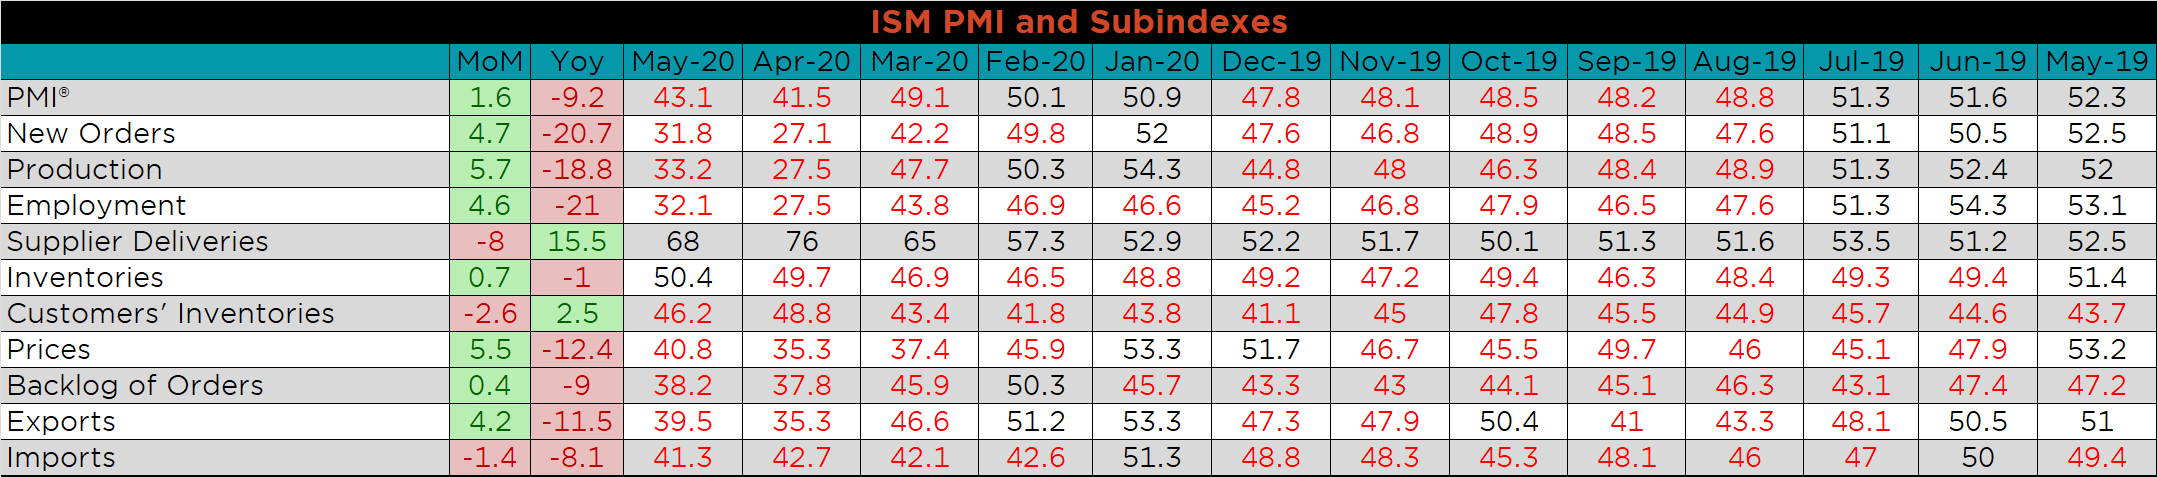
The May ISM Manufacturing PMI and subindexes are below. The topline PMI number rose 1.6 points to 43.1 but remains in contraction.
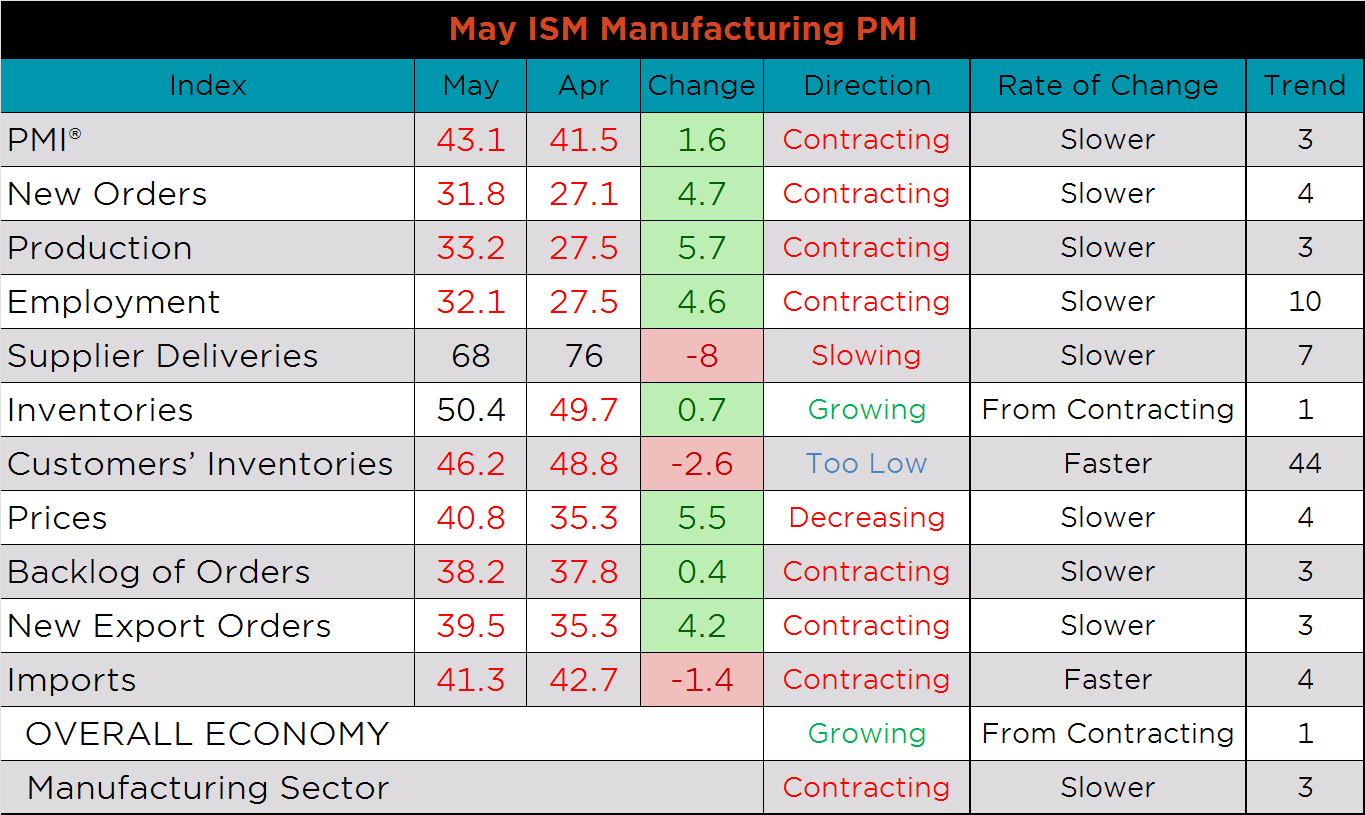
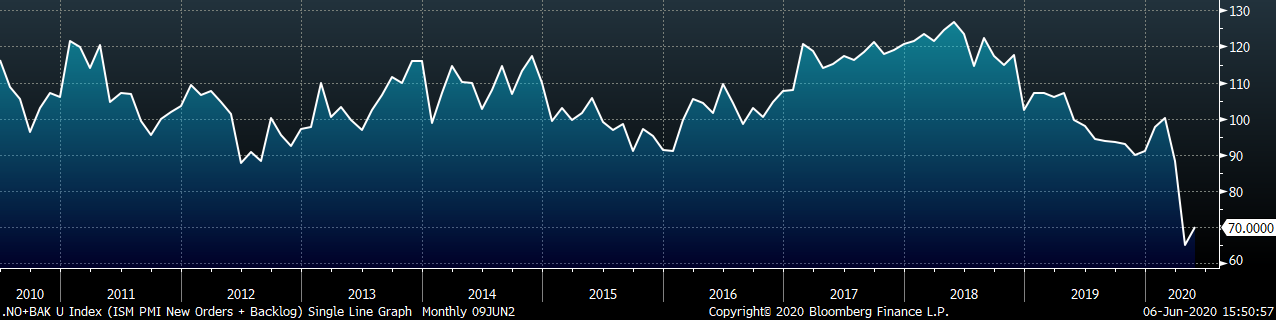
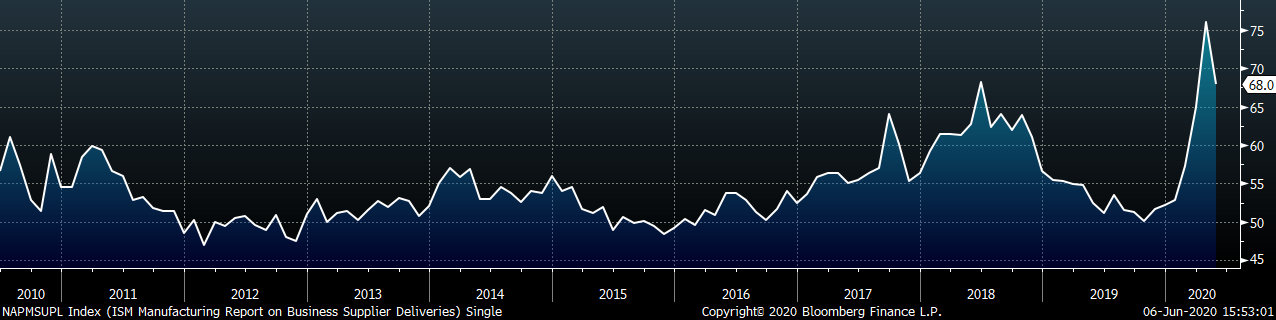
As the U.S. economy began to open up regionally, we have started to see some positive signs. The chart below compares the ISM prices subindex with the ISM customer inventories subindex and shows the two finally converging after two months of significant separation. The second chart shows the new orders plus backlog sub-indexes bouncing off their lowest level in the last decade. The last chart shows the supplier deliveries subindex easing as well, after two months of limited shipping ability.
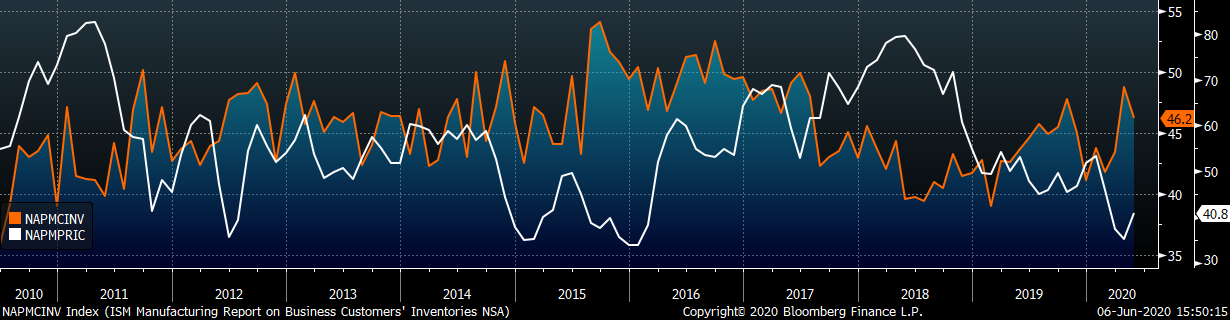
This month, most subindexes were higher MoM, but lower YoY. Supplier deliveries, and customer inventories moved lower and are the only two subindexes that are higher than May of last year.
May’s global PMI printings show increases month over month. However, this was not enough to overcome recent weakness in PMI readings, and most countries remain in contraction.
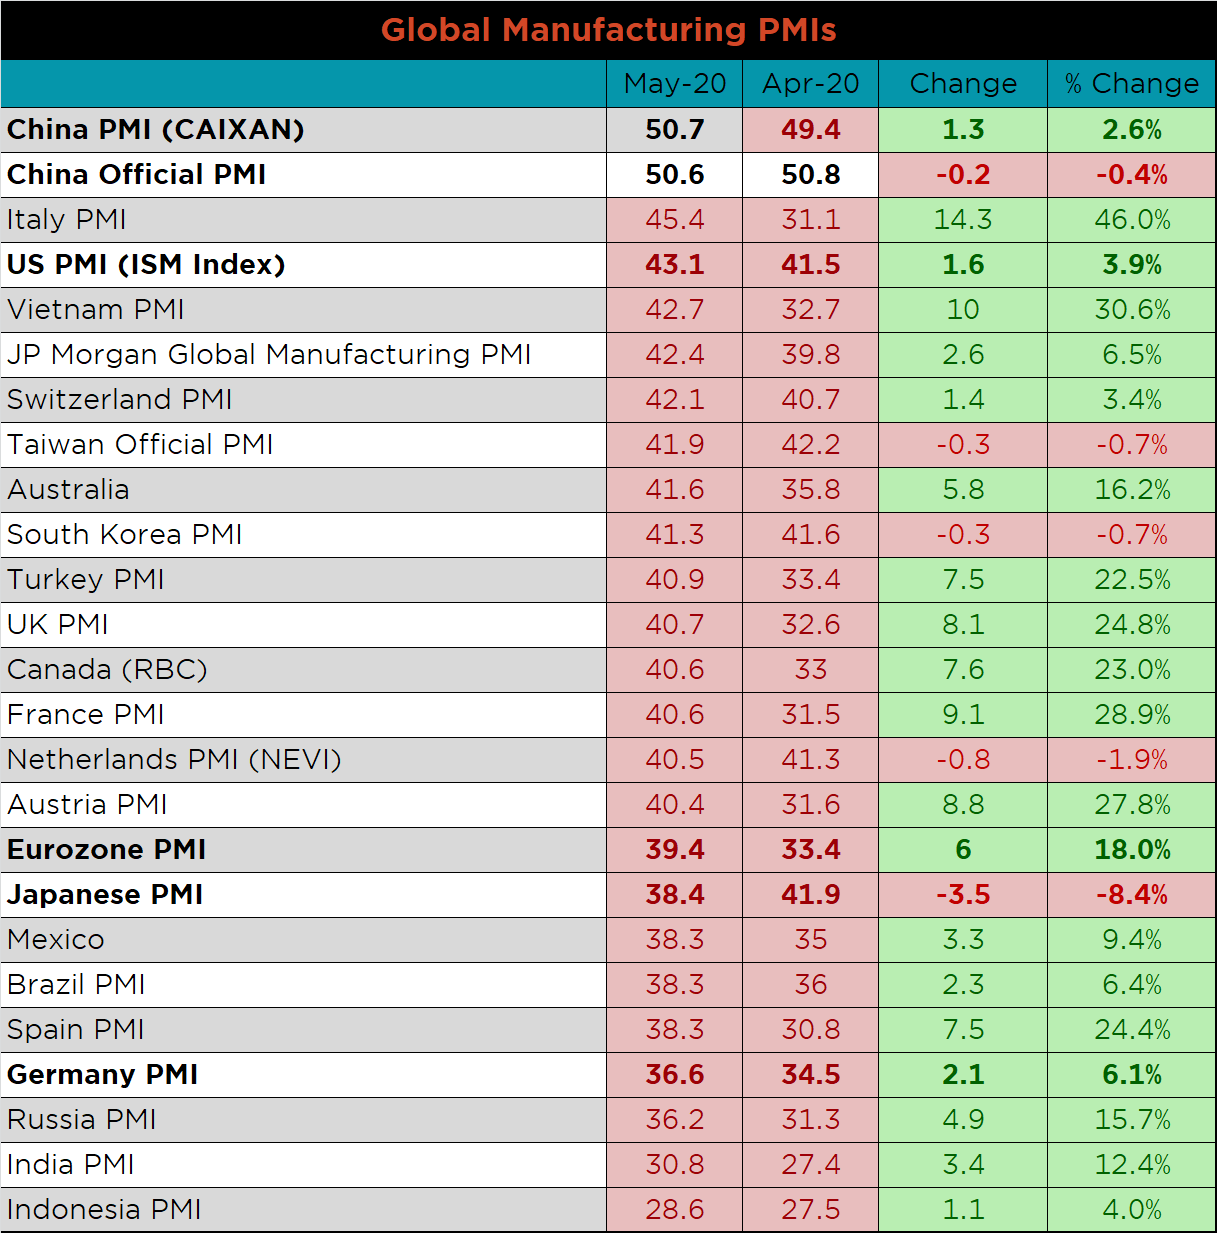
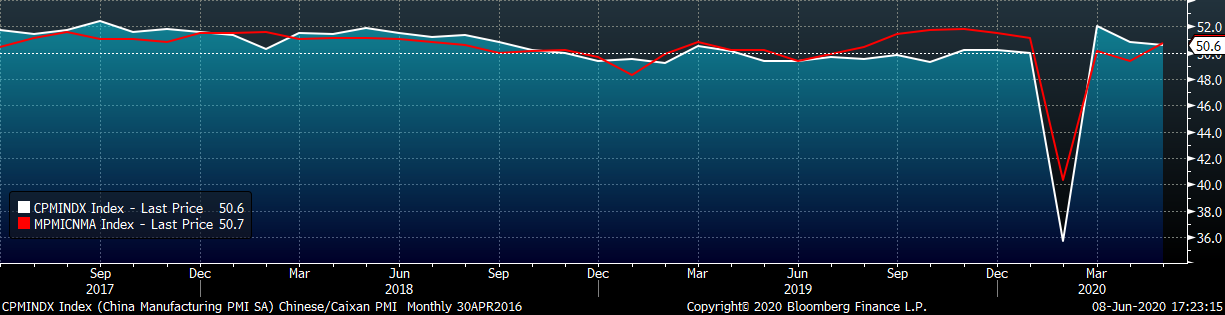
China’s official PMI is down slightly, while the Caixan Manufacturing PMI printed higher and back into expansion.
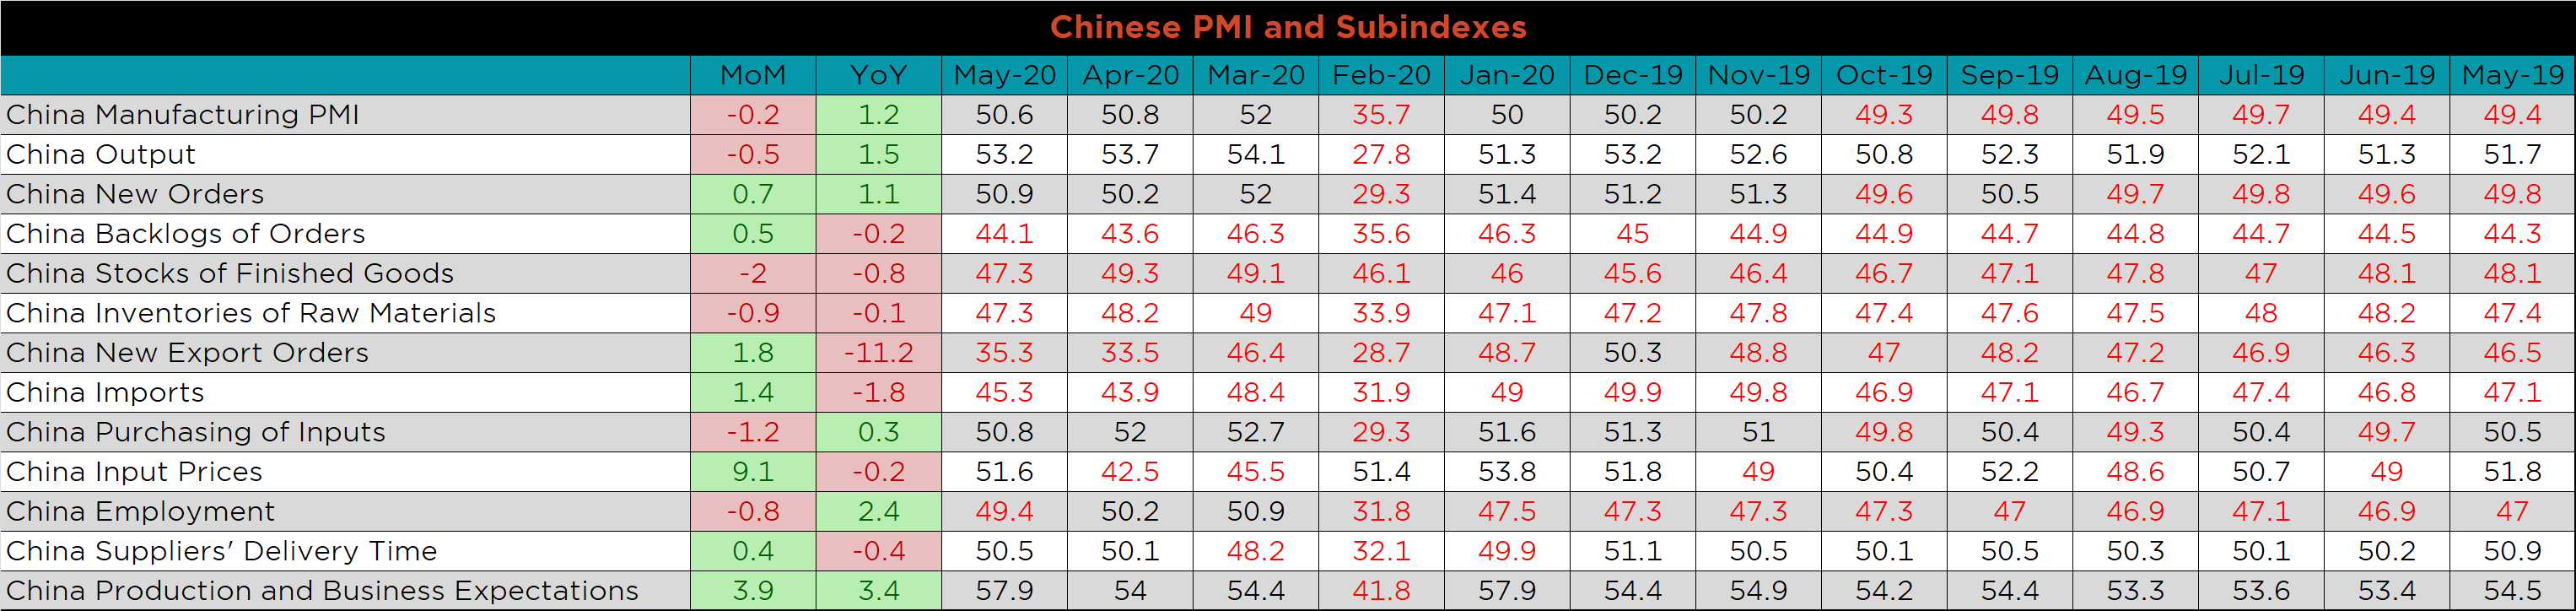
The table below breaks down China’s official manufacturing PMI subindexes. Compared to last month, input prices are up the most, which should lead to further stability in the short-term. New export orders increased compared to last month, but remain significantly below levels from May of last year.
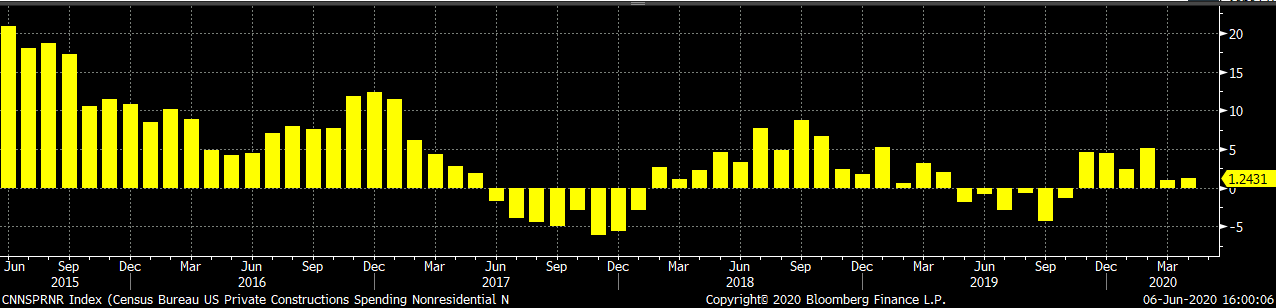
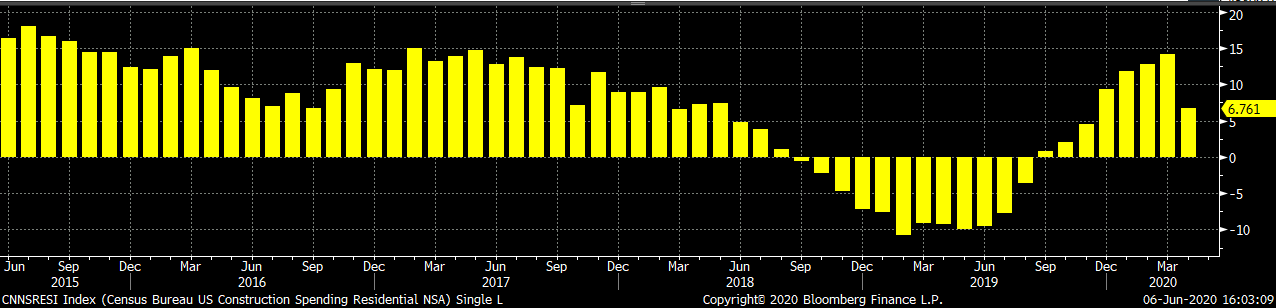
April seasonally adjusted U.S. construction spending was down 2.9% compared to March, but up 3% compared to last April. February and March construction spending was revised significantly higher for both Residential and Non-Residential spending, providing further support to the not-seasonally adjusted figures YTD.
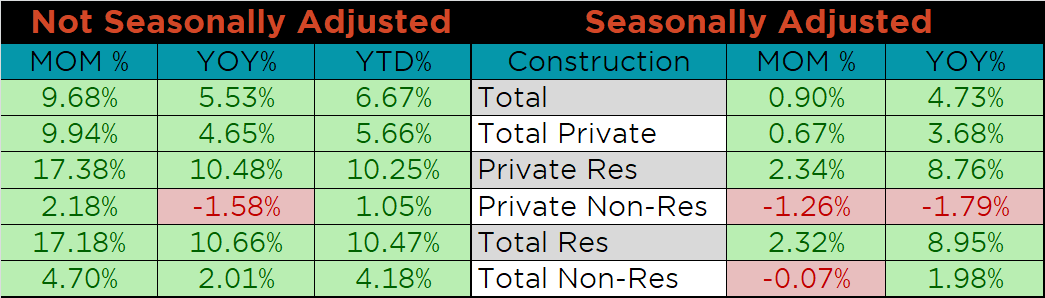
The white line in the chart below represents construction spending in 2020 and compares it to the spending of the previous 4 years. The last two charts show the YoY changes in construction spending. Private non-residential spending was revised higher for March and has been increasing slightly since November. Residential spending remains high compared to last year, but is growing at a slower rate than previous months.
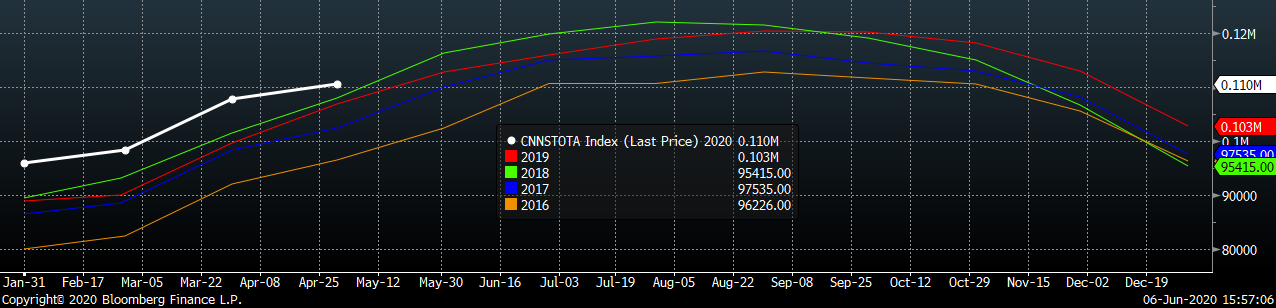
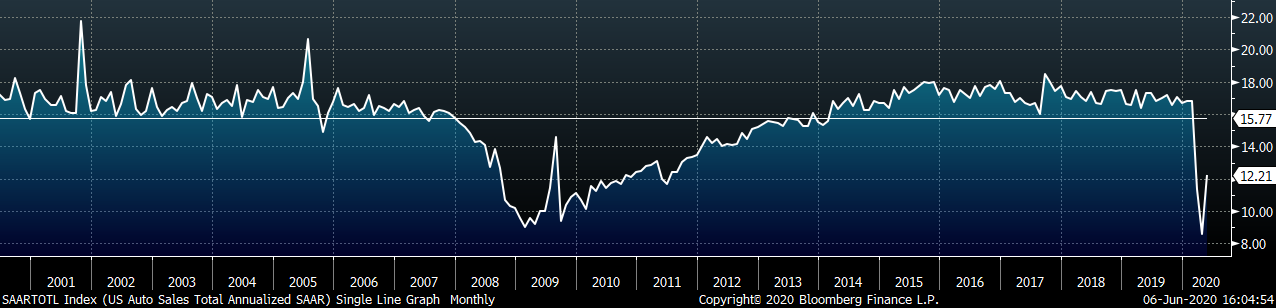
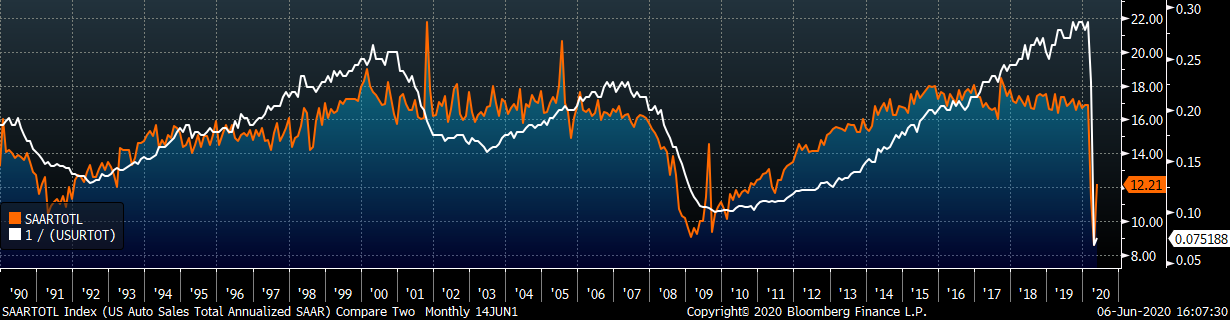
May U.S. light vehicle sales bounced back to a 12.21m seasonally adjusted annualized rate (S.A.A.R), but remain below their 20-year average. The second chart shows the relationship between the unemployment rate and auto sales. The unemployment rate is inverted to show that declining unemployment typically leads to increasing auto sales. Auto sales bounced back significantly and the unemployment rate, surprisingly, decreased in May.
Below are the most pertinent upside and downside price risks:
Upside Risks:
Downside Risks:
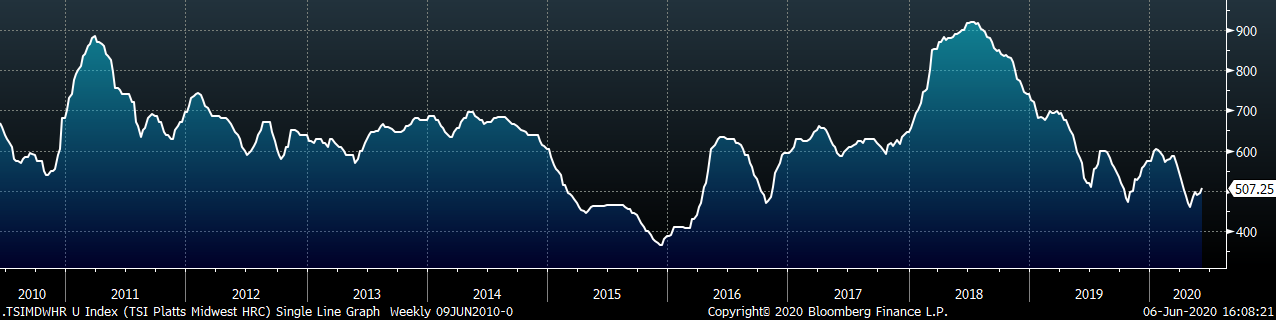
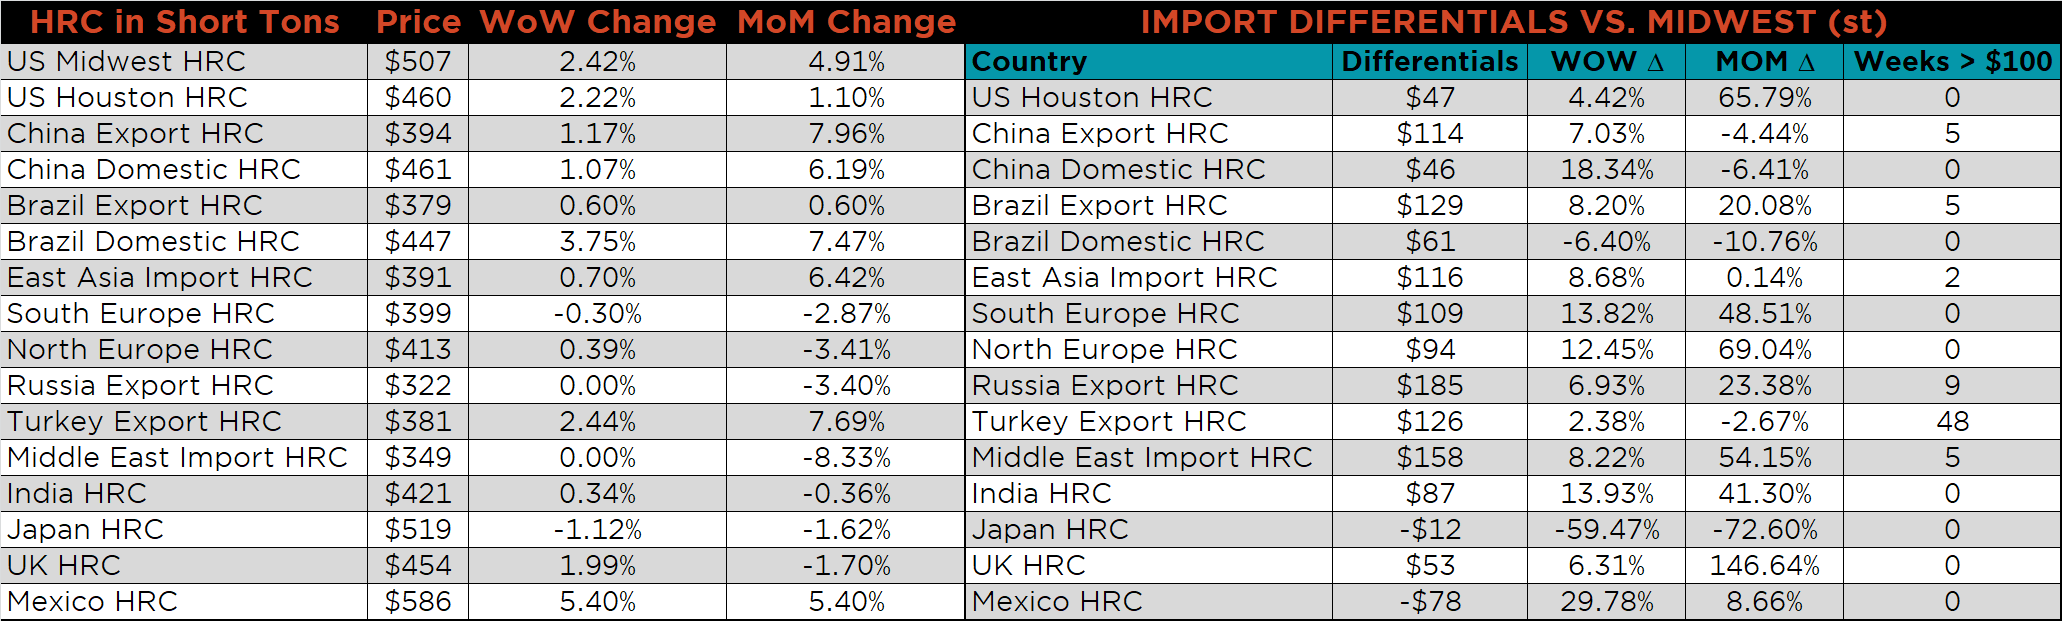
The Platts TSI Daily Midwest HRC Index was up $12 to $507.25.
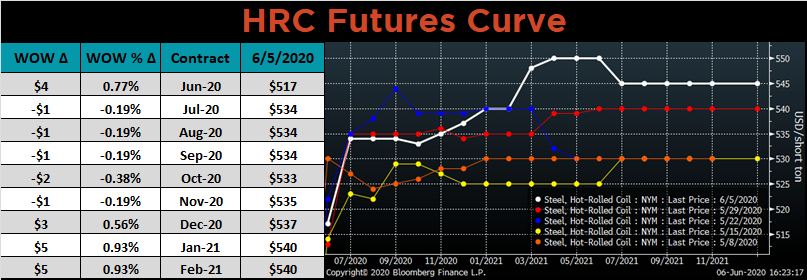
The CME Midwest HRC futures curve is below with last Friday’s settlements in white. The curve did not change much since last week. However, the illiquid expirations in the back of the curve have increased $15/20 over the last two weeks.
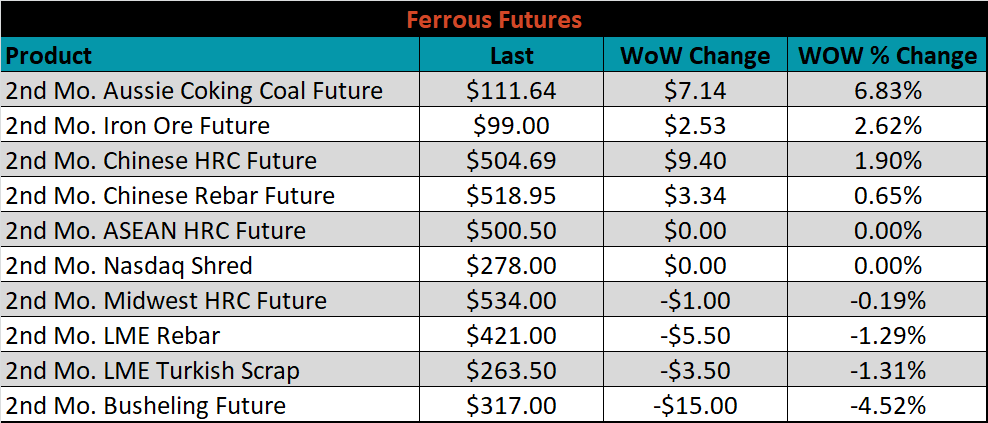
July ferrous futures were mixed. The coking coal future gained 6.8%, while the busheling future lost 4.5%.
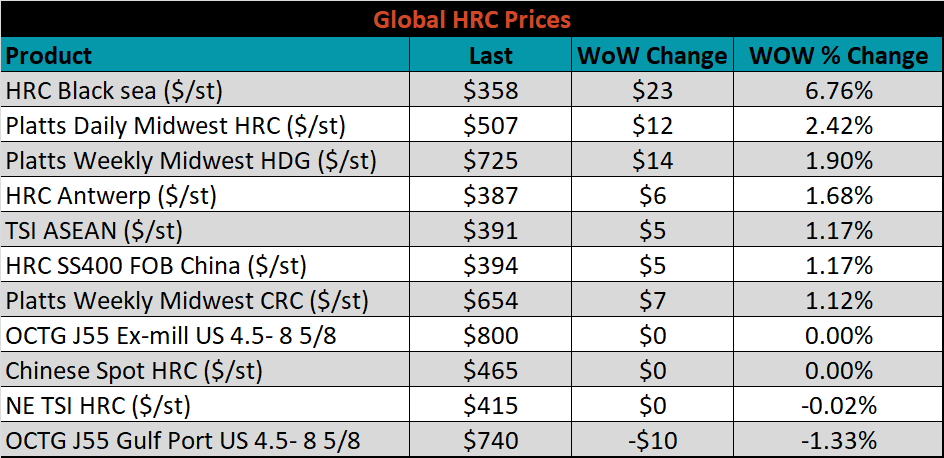
The global flat rolled indexes were mostly higher, led by TSI Black Sea HRC, up another 6.8%.
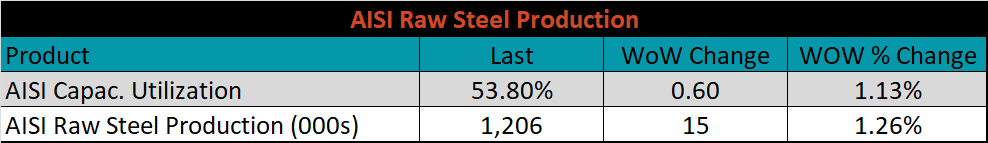
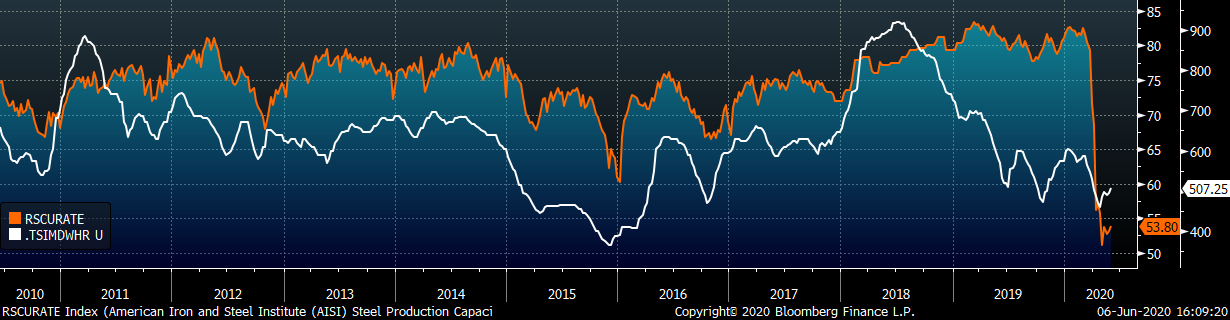
The AISI Capacity Utilization Rate was up another 0.6% to 53.8%.
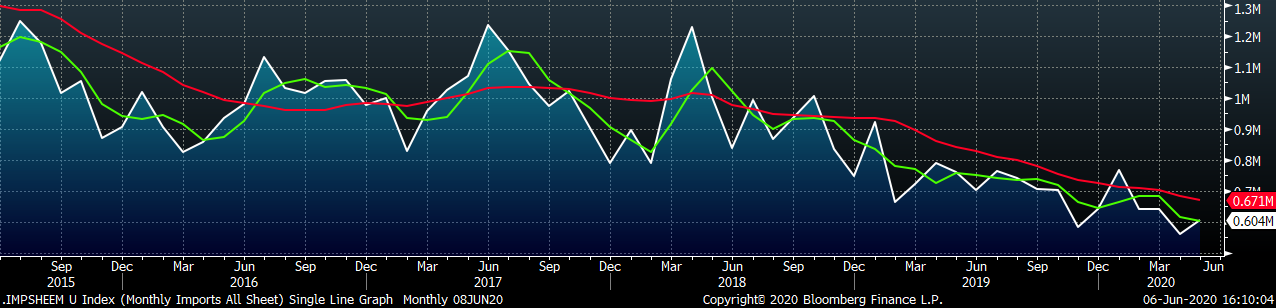
May flat rolled import license data is forecasting an increase of 44k to 604k MoM.
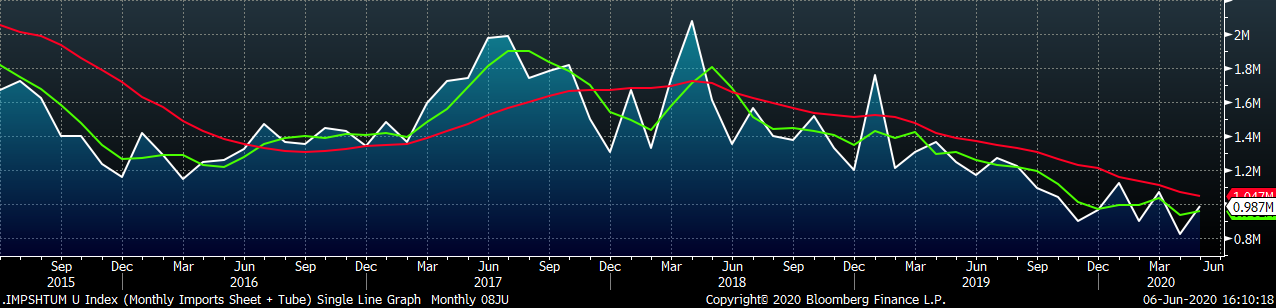
Tube imports license data is forecasting a MoM increase of 121k to 383k tons in May.

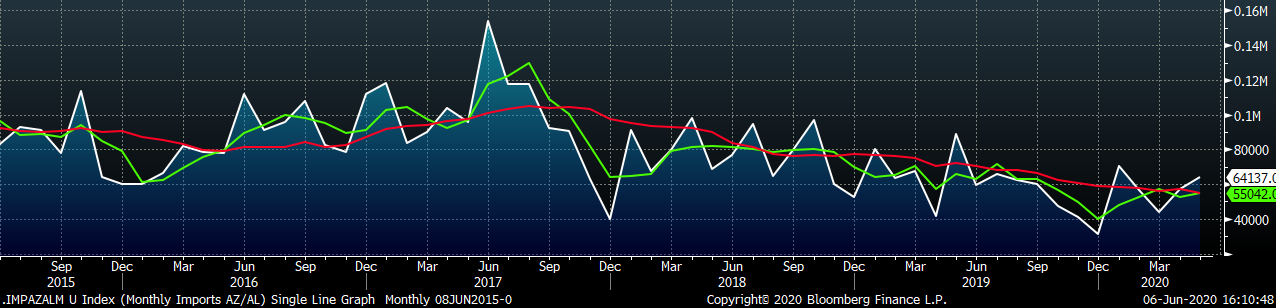
AZ/AL import license data is forecasting an increase of 7k in May to 64k.
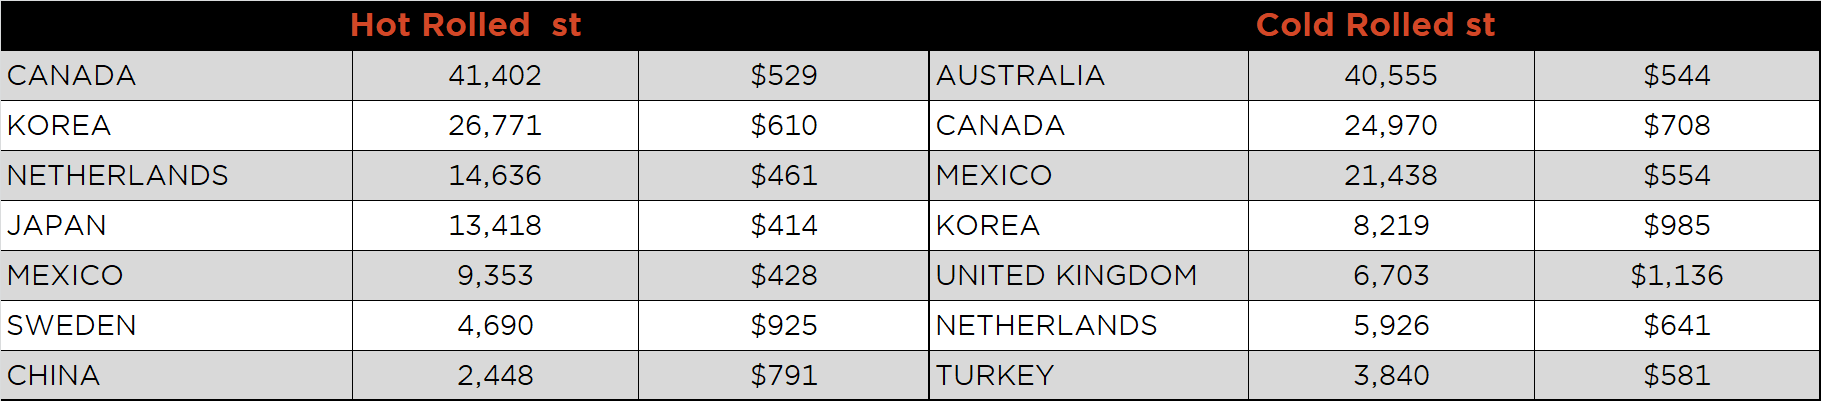
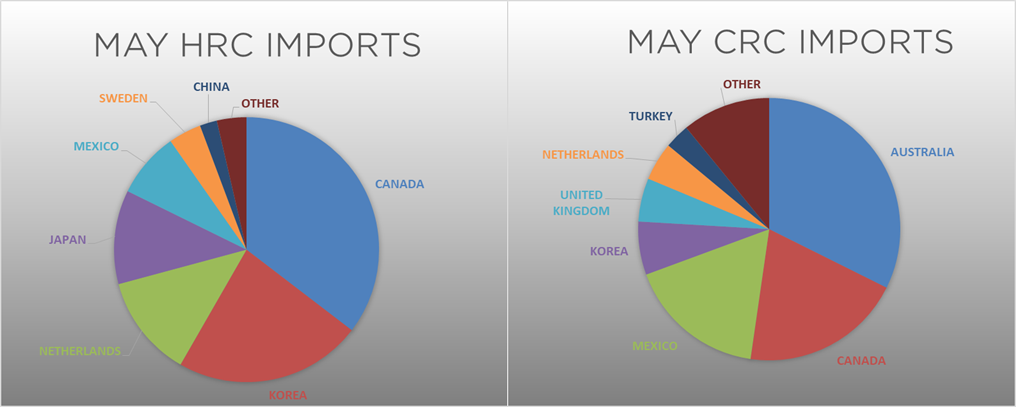
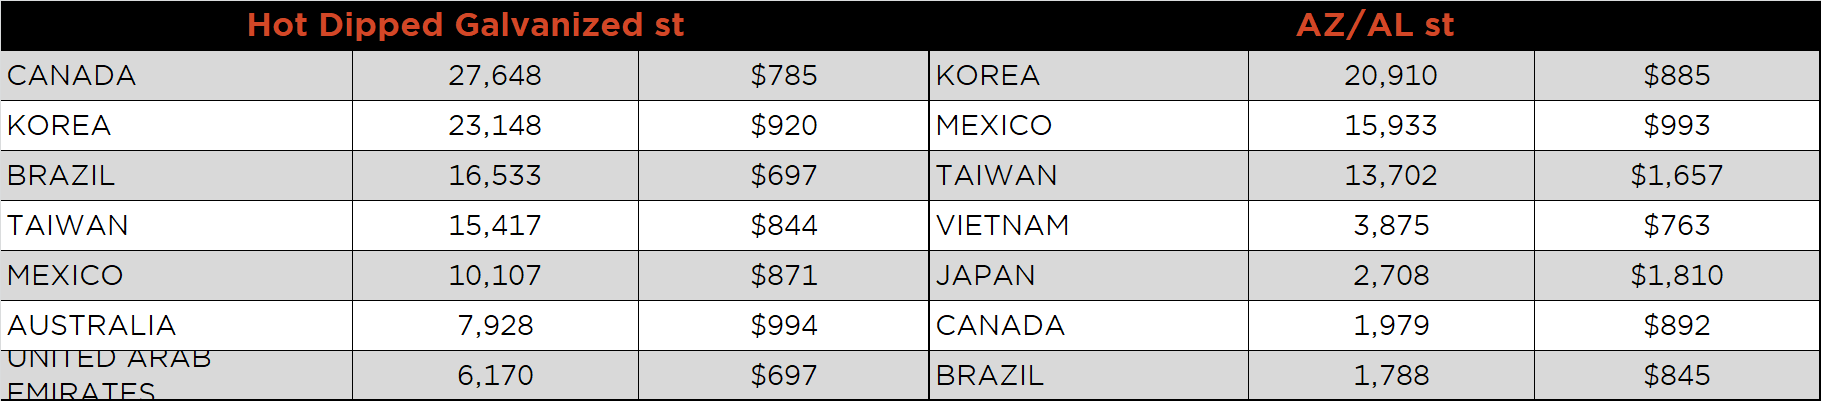
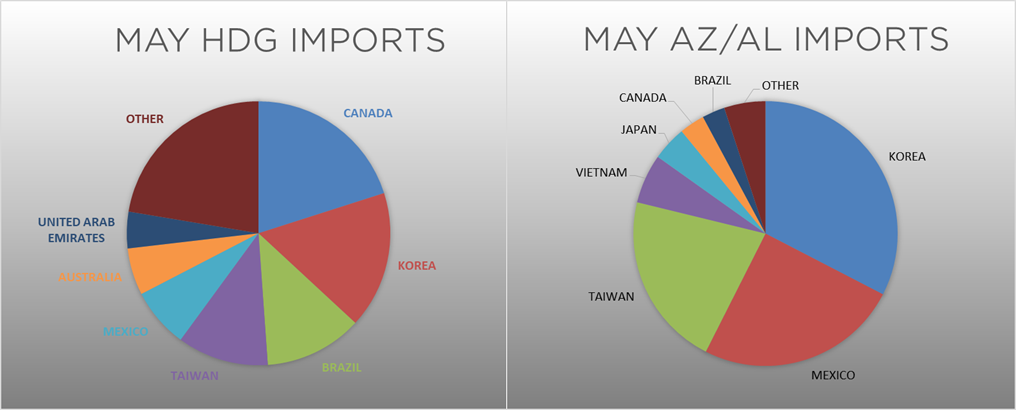
Below is May import license data through June 2, 2020.
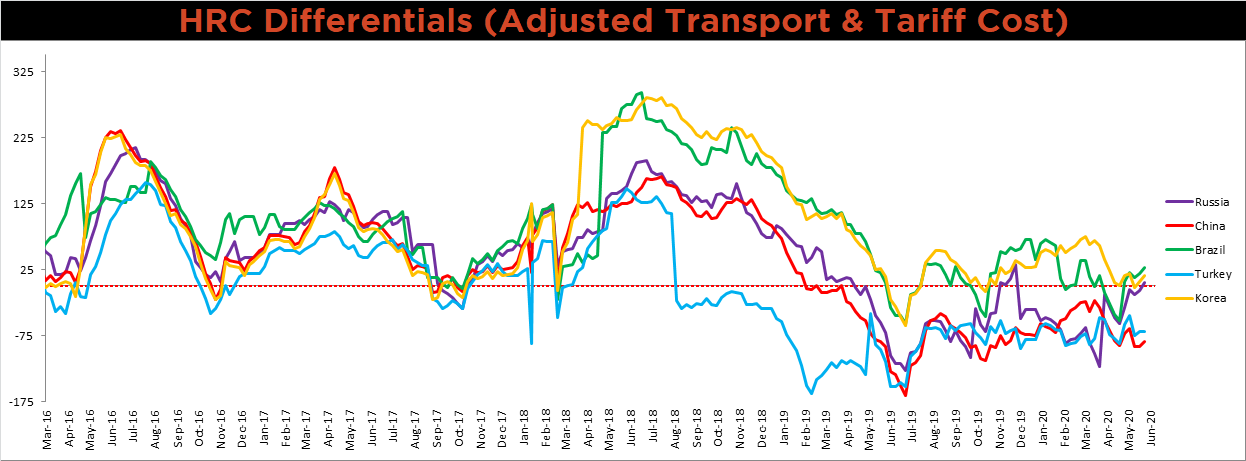
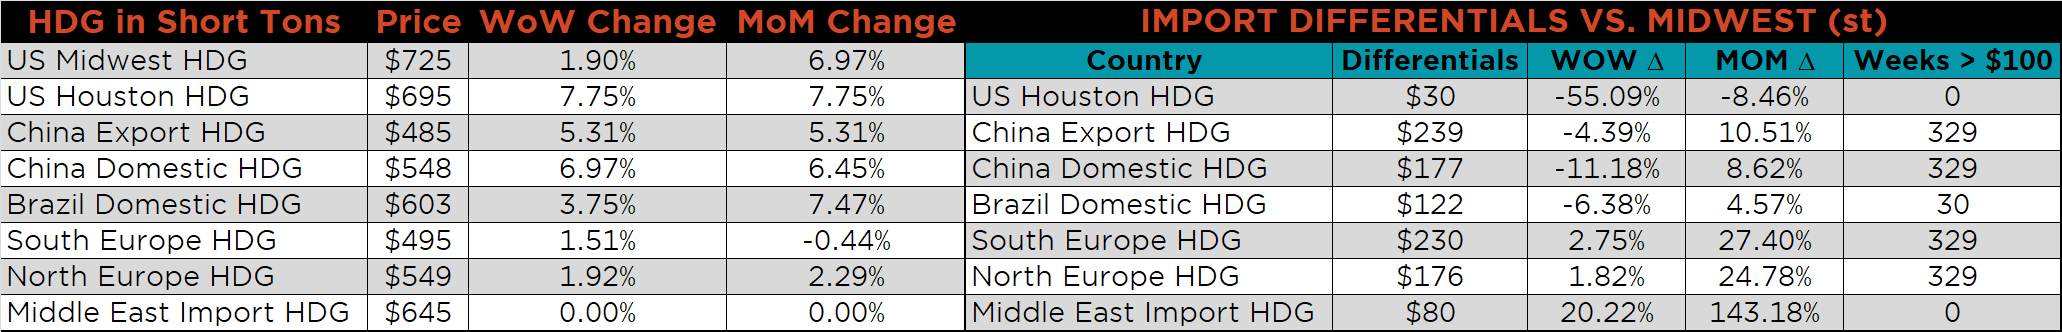
Below is the Midwest HRC price vs. each listed country’s export price using pricing from SBB Platts. We have adjusted each export price to include any tariff or transportation cost to get a comparable delivered price. The Brazilian, Korean, Russian and Chinese differentials all increased, as U.S. domestic price increased. The Turkish price, however, increased at the same rate as the U.S. domestic price and its differential was flat.
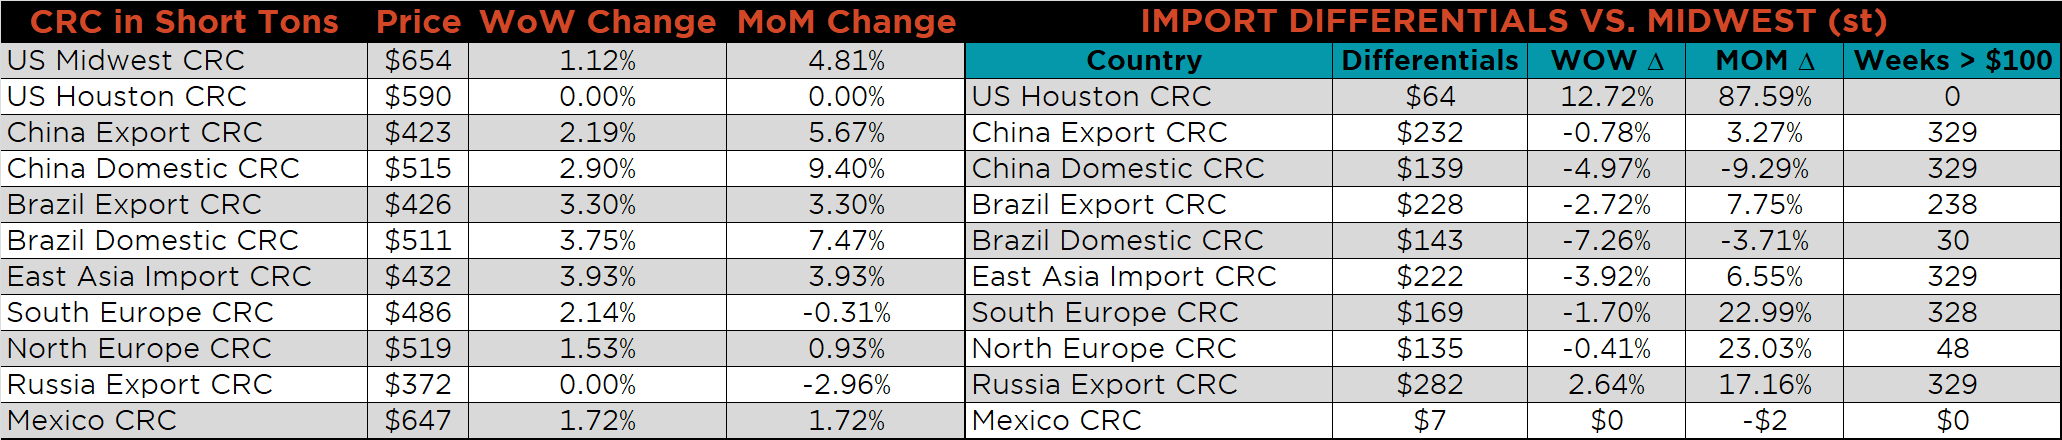
SBB Platt’s HRC, CRC and HDG pricing is below. The Midwest HRC, HDG and CRC prices were up 2.4%, 1.9% and 0.4%, respectively. Globally, the Chinese export CRC and Turkish export HRC prices were up, 3.3% and 2.4%, respectively.
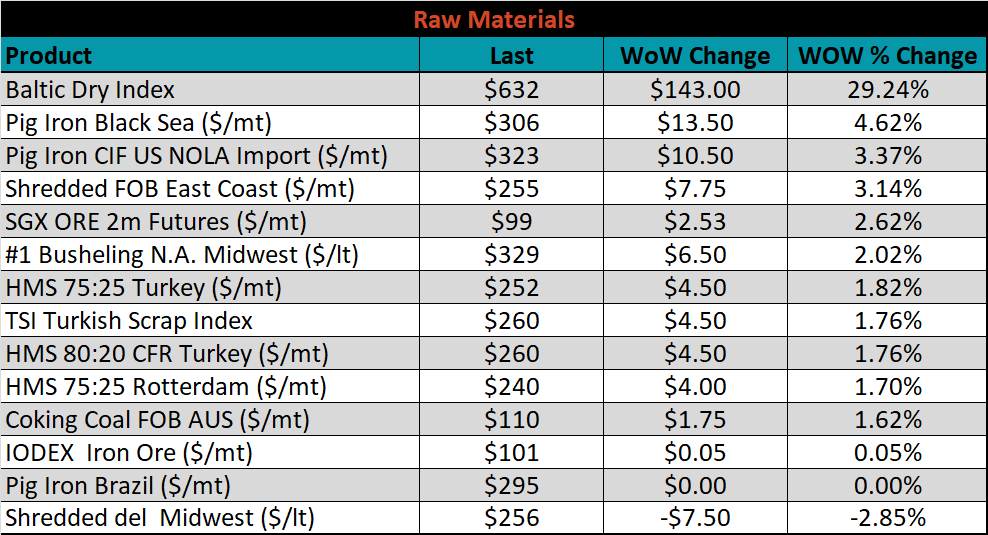
Raw material prices were mostly higher, led by Black Sea pig iron, up 4.6%, while Midwest shredded was down 2.9%.
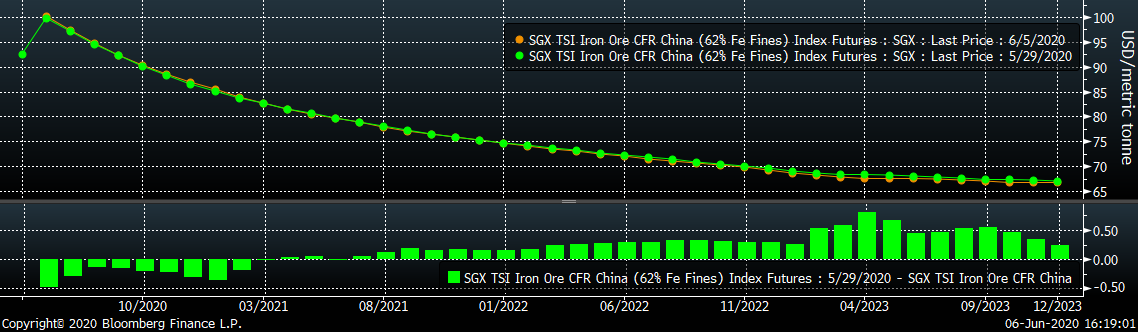
Below is the iron ore future curve with Friday’s settlements in orange, and the prior week’s settlements in green. The curve was essentially flat.
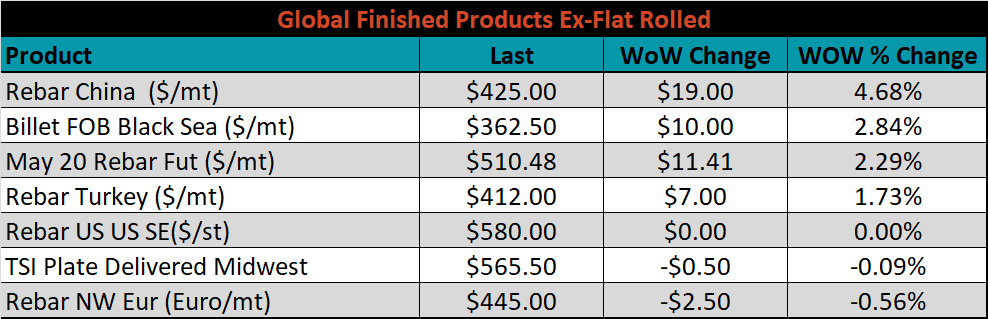
The ex-flat rolled prices are listed below.

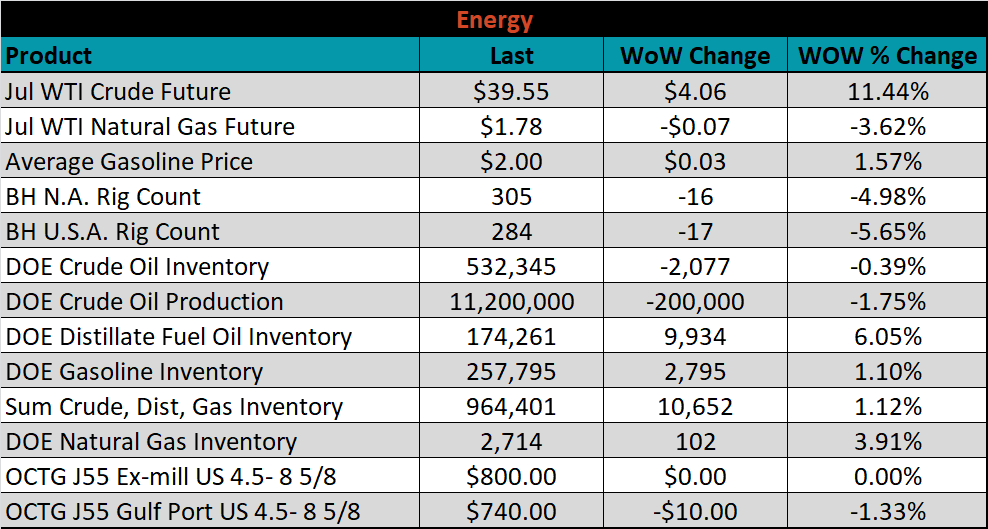
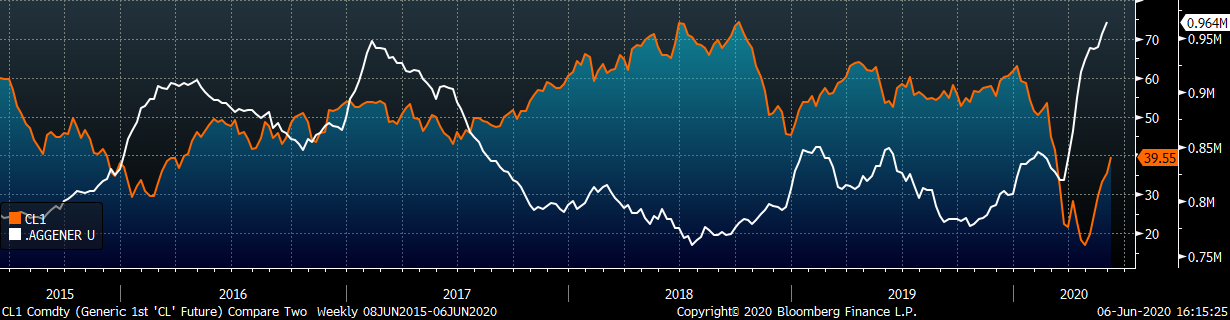
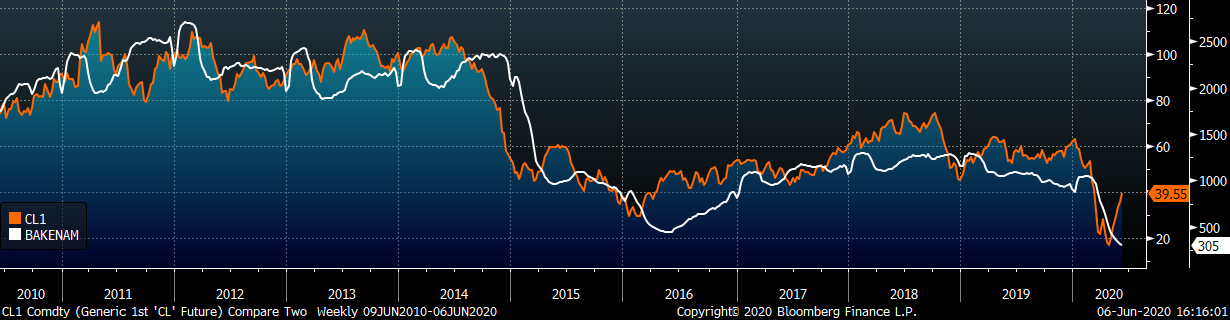
Last week, the July WTI crude oil future gained another $4.06 or 11.4% to $39.55/bbl. The aggregate inventory level was up 1.1%, while crude oil production was down to 11.2m bbl/day. The Baker Hughes North American rig count was down another 16 rigs, and the U.S. rig count was down 17 rigs.
The list below details some upside and downside risks relevant to the steel industry. The orange ones are occurring or look to be highly likely. The upside risks look to be in control.
Upside Risks:
Downside Risks: