Content
-
Weekly Highlights
- Market Commentary
- ISM PMI
- Global PMI
- Construction Spending
- Auto Sales
- Risks


This week at FGM, we are focused on three market dynamics that we see as abnormal and, more importantly, unsustainable. They are:
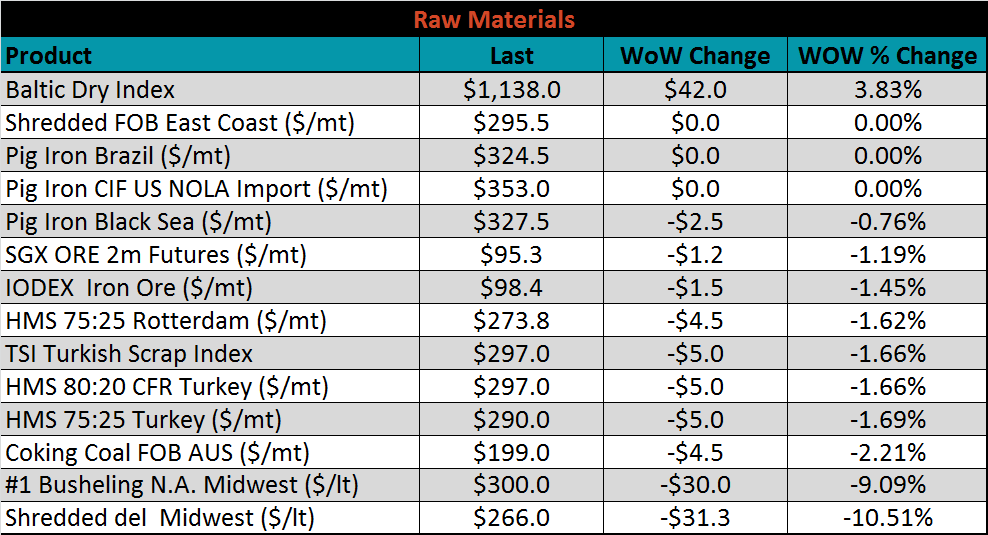
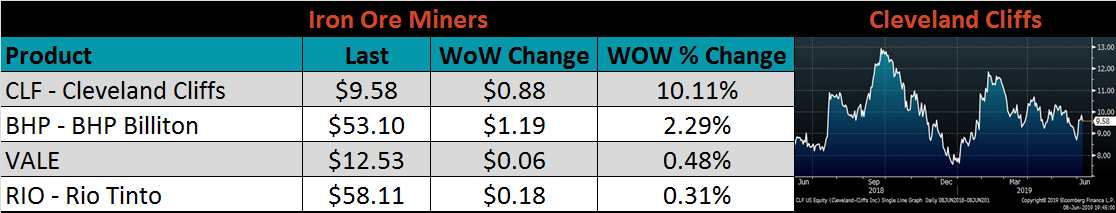
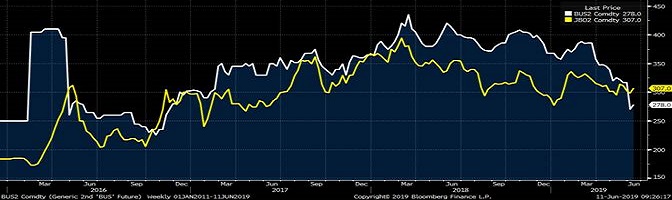
June scrap pricing fell, somewhat unexpectedly, giving mini-mills room to sell HRC at lower prices and maintaining profit. Global raw material prices have remained steady, and iron ore prices continue to remain at elevated levels. This has lead domestic busheling prices to fall below the LME Turkish scrap price. The chart below shows the historical relationship between the two, and how irregular this inversion is.
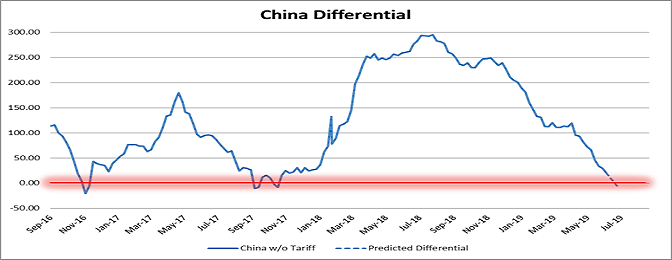
This report has previously discussed the China price differential, and since then, domestic prices have fallen more than the China export price. This relationship is also nearing historically rare levels, and we view it as a dislocation that will revert to normal levels.
Domestic prices are significantly cheaper than most import offers, leading us to believe that there is too much domestic production, and imports should continue to fall moving into the 3rd quarter. Profitability on the marginal ton continues to decline, with integrated mills losing money on tons sold in the spot market and mini-mills near their breakeven level. Higher scrap prices or lower spot HRC prices will further squeeze profit margins and lead to reduced production while imports are shrinking and service center inventories are dwindling. This will create a deficit in tons, which cannot last for extended periods.
Why these abnormalities exist, and when they will be resolved can be discussed and debated, but frankly, does not matter. We believe the important takeaway is they skew the risk/reward ratio to the upside, and action should be taken now to protect against the risk of the markets reverting.
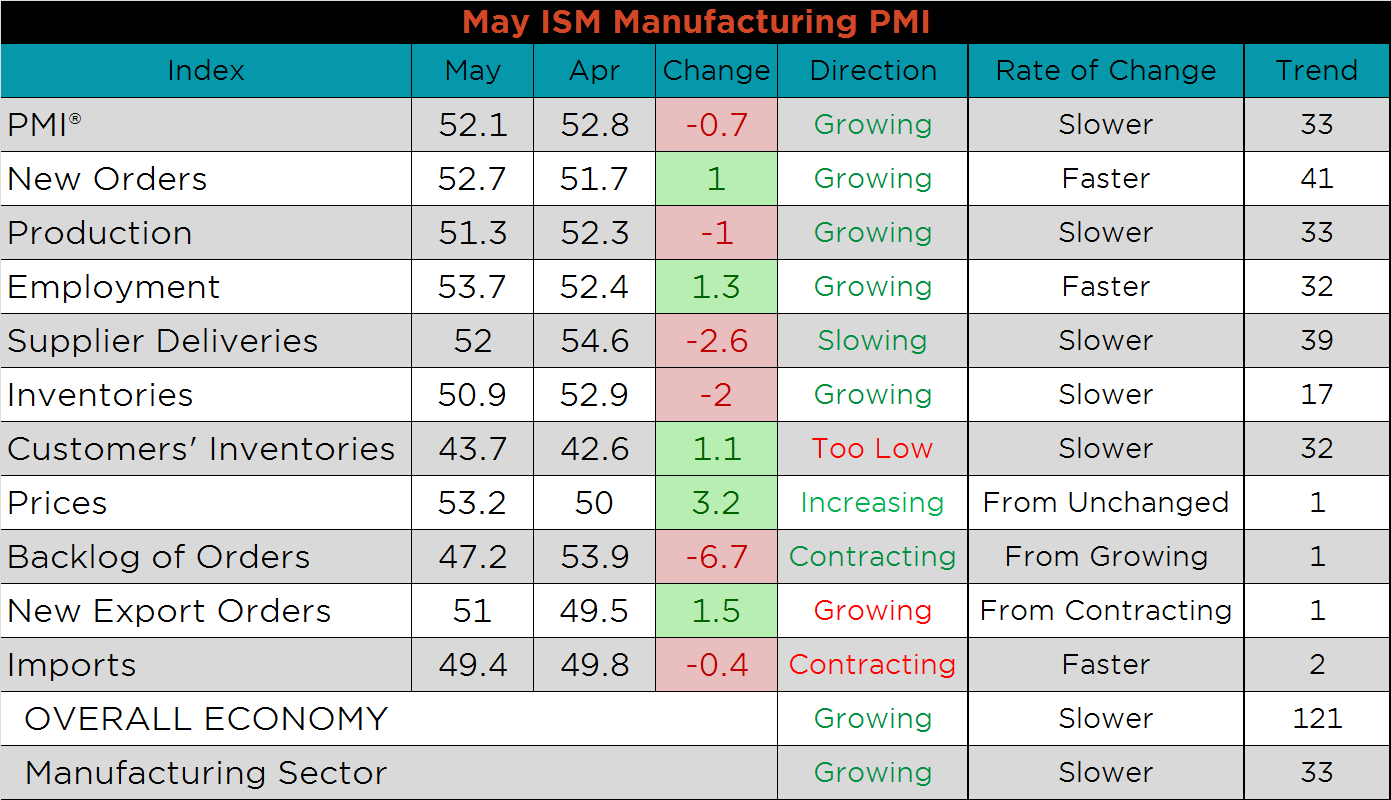
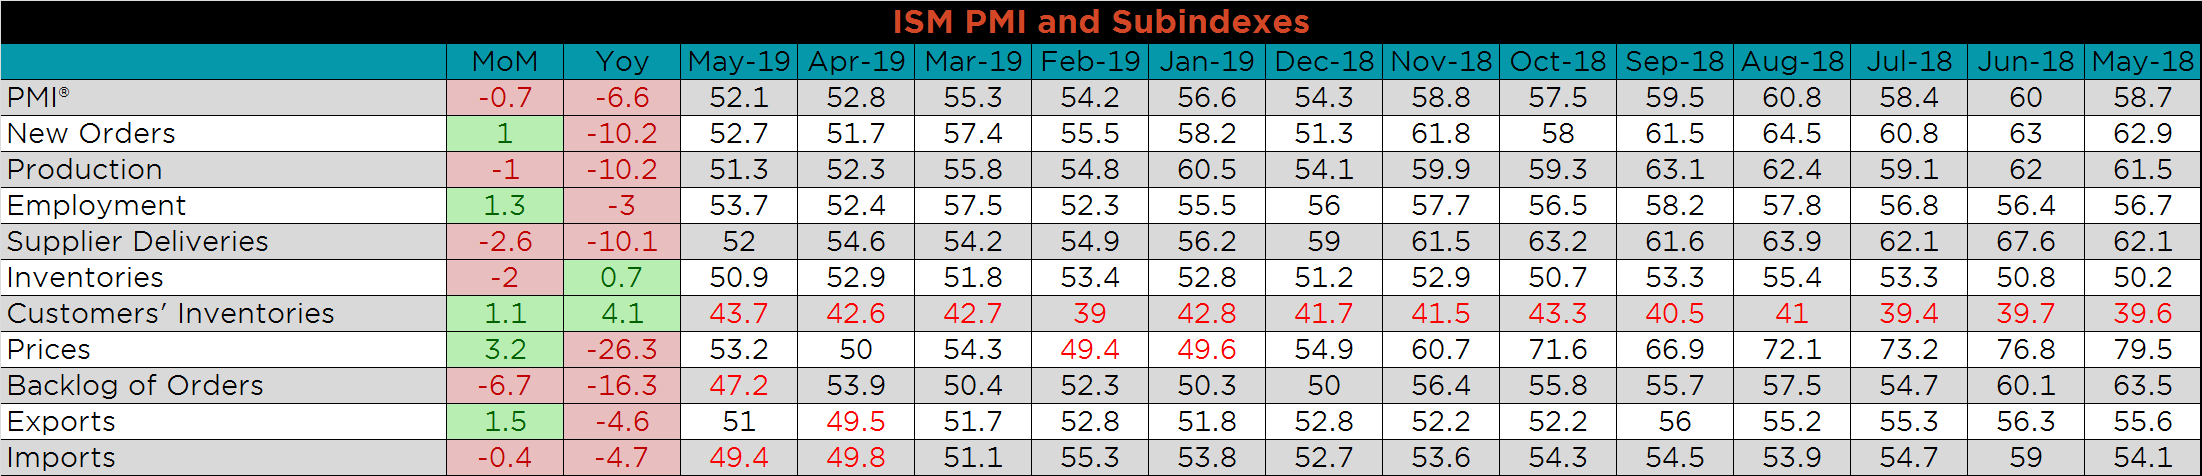
The May ISM Manufacturing PMI and subindexes is below, and shows slower expansion. The production, supplier deliveries, inventories, backlog and imports all decreased, while new orders, employment, customer inventories, prices and new export orders increased from April.
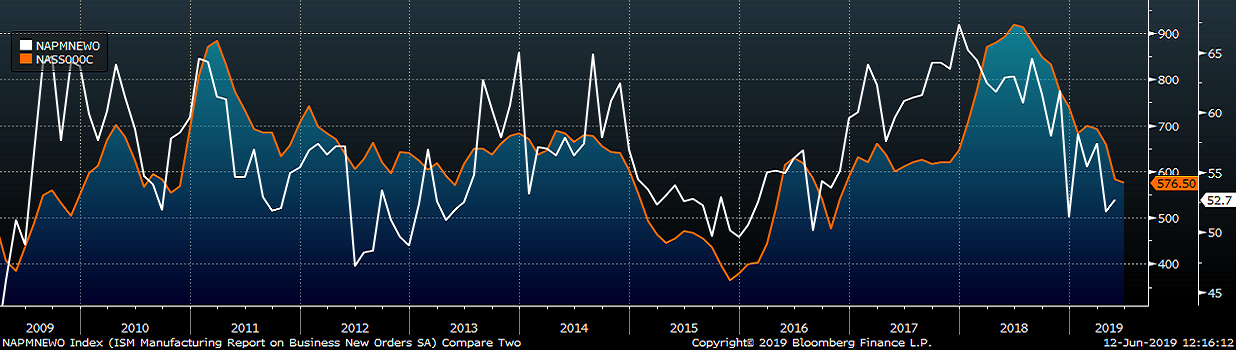
The chart below compares the ISM new orders subindex with the Platts TSI Daily Midwest HRC Index. The subindex stabilized, suggesting HRC prices may be nearing a bottom.
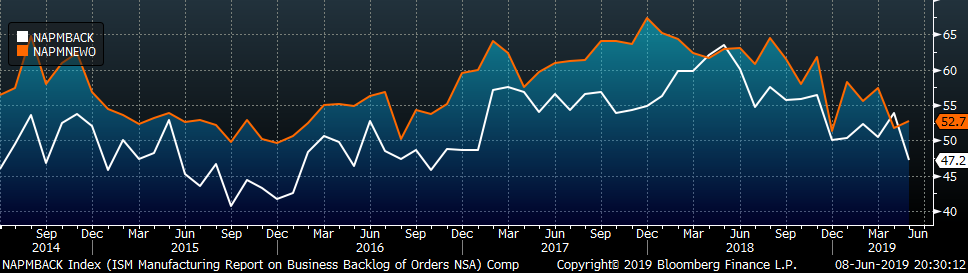
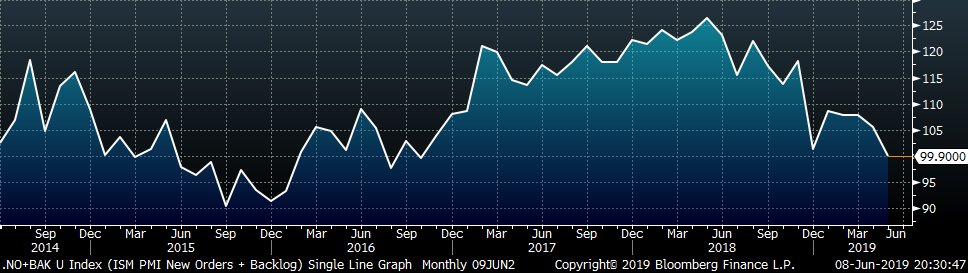
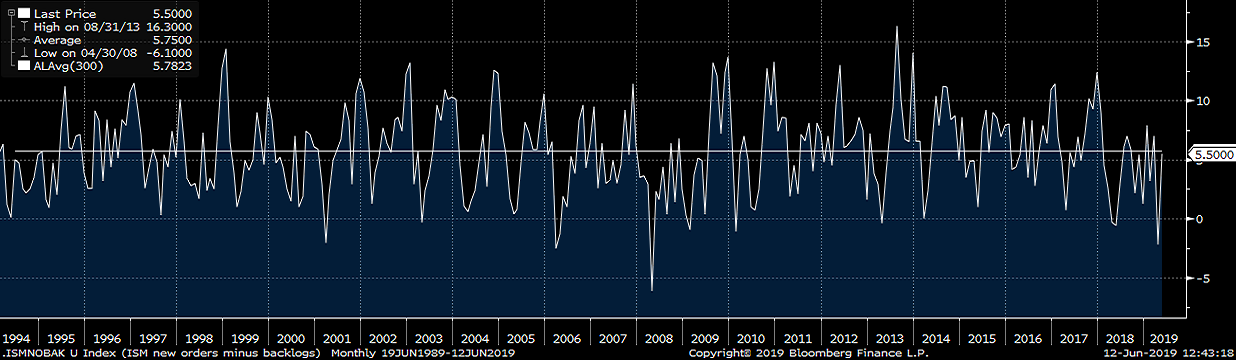
The January ISM new orders subindex rose 1 point to 52.7 while the backlog subindex fell 6.7 points to 47.2. The second chart adds the new orders and backlog subindexes, indicating slightly lower manufacturing demand in May. The third chart is the new orders subindex minus the backlog subindex. As forecasted, their relationship has returned to its historical average, although this was driven by the sharp reduction in backlog.
This table shows the monthly ISM PMI and subindexes back to May 2018. Most subindexes are down YoY, with the prices, backlog and new orders subindexes down the most.
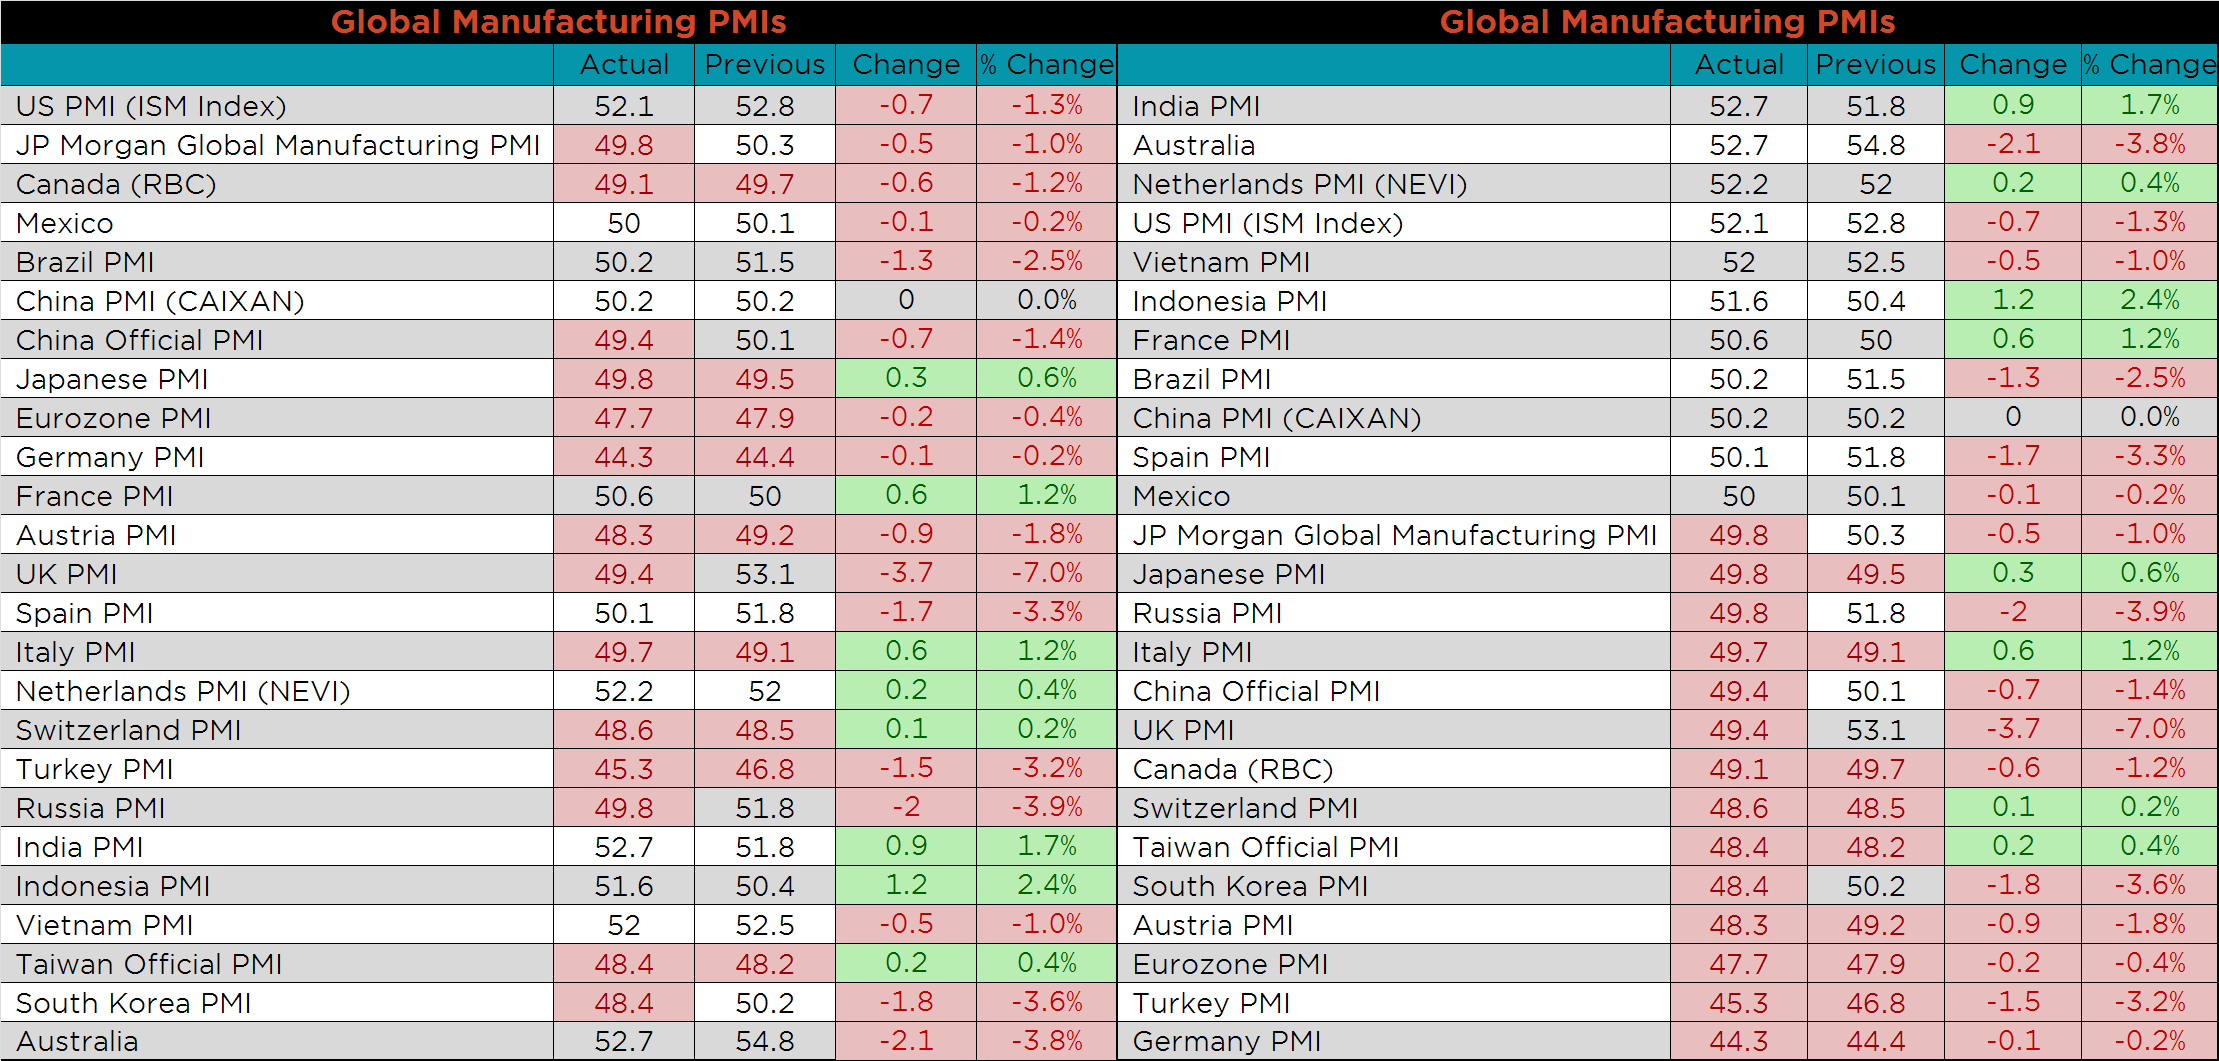
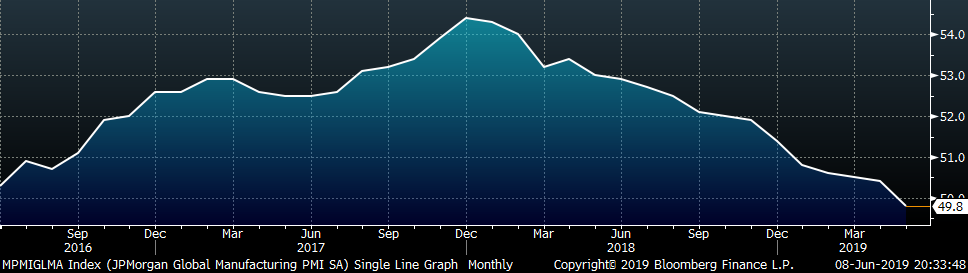
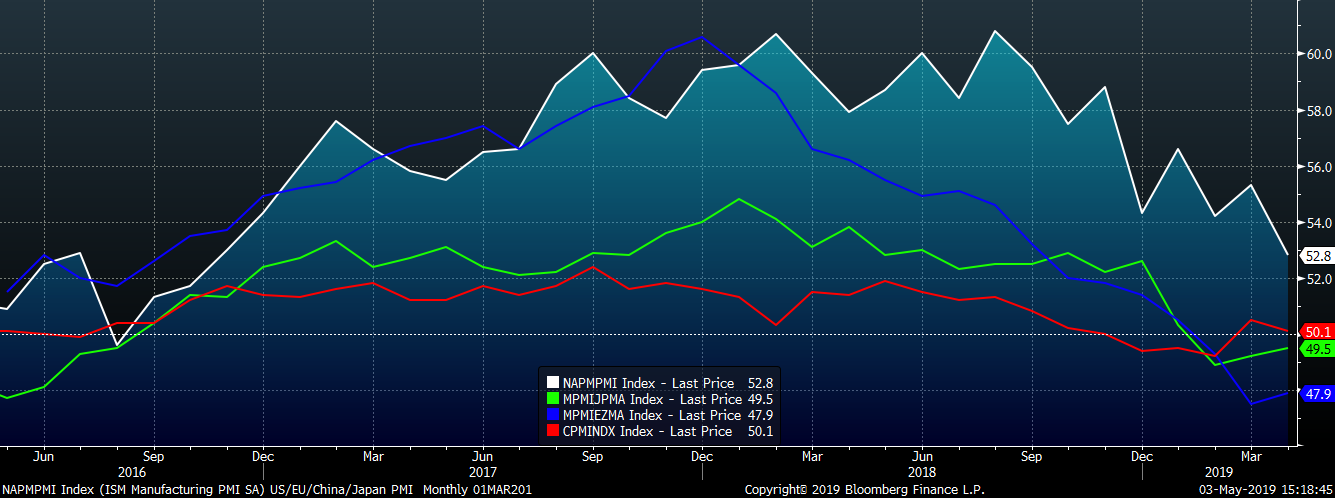
The May global purchasing manager indexes continued to perform worse than the United States with the JP Morgan, Russia, China, UK and South Korea PMIs falling into contraction.
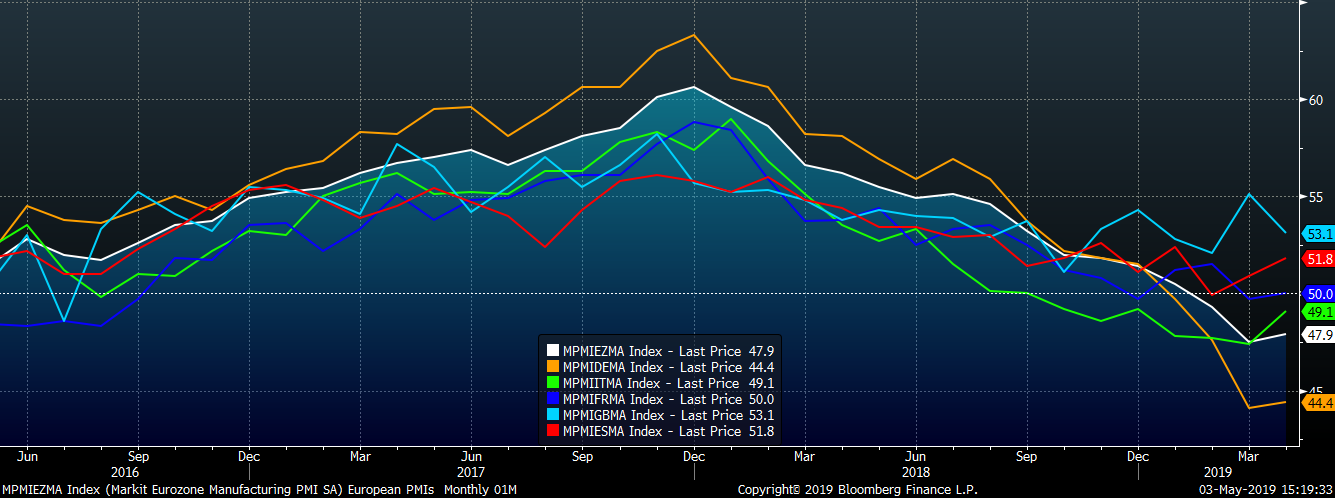
The overall downtrend in European PMIs continued in May. France and Spain are the only countries remaining in expansionary territory. Germany moved lower again to 44.3 and has the lowest PMI globally.
The PMIs of Europe, China, Japan and the U.S. all moved lower. The U.S. printing is the only PMI in an expansionary position, indicating global manufacturing weakness has not affected domestic manufacturing.
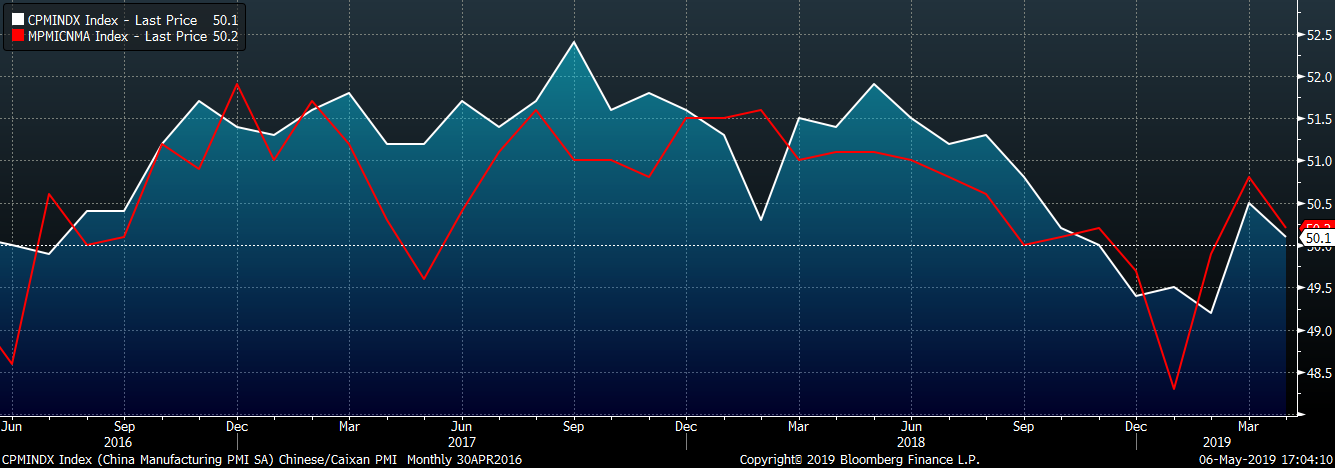
China’s official PMI fell back into contraction, while Caixan Manufacturing PMIs held above 50. This divergence is interesting because the official PMI number is from the government, and its decline may lead to increased stimulus from China’s central bank.
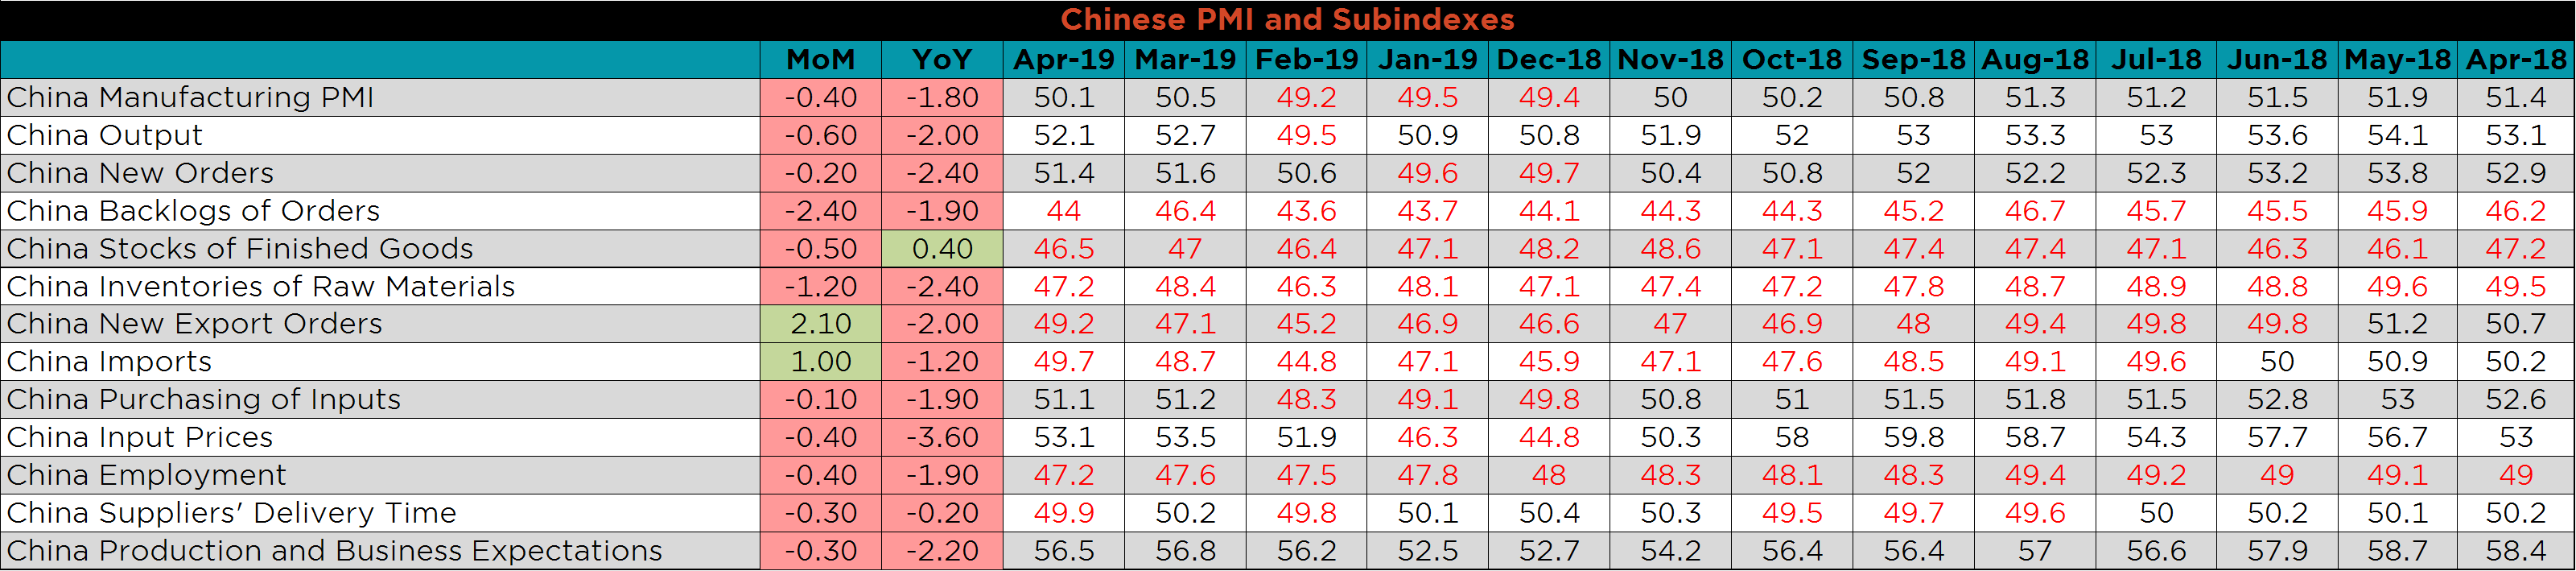
The table below breaks down China’s official manufacturing PMI subindexes. The finished goods subindex is one of the few bright spots in the report, nearly all the other subindexs decreased both MoM and YoY.
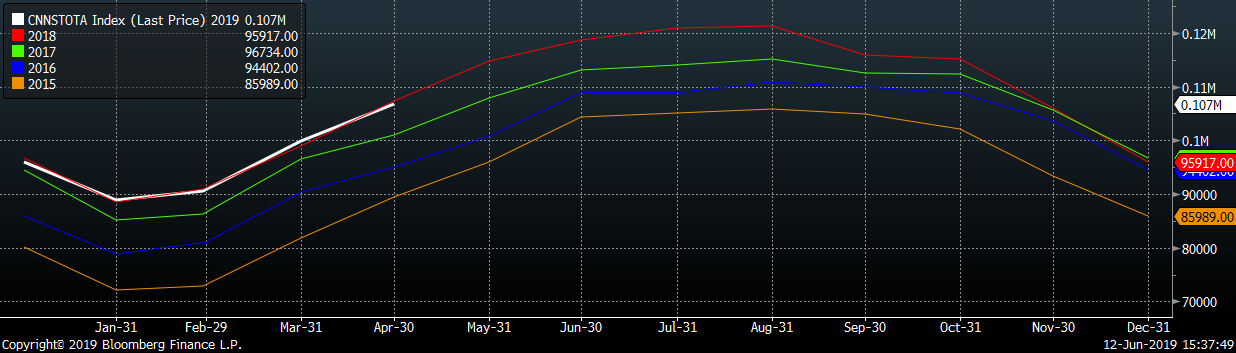
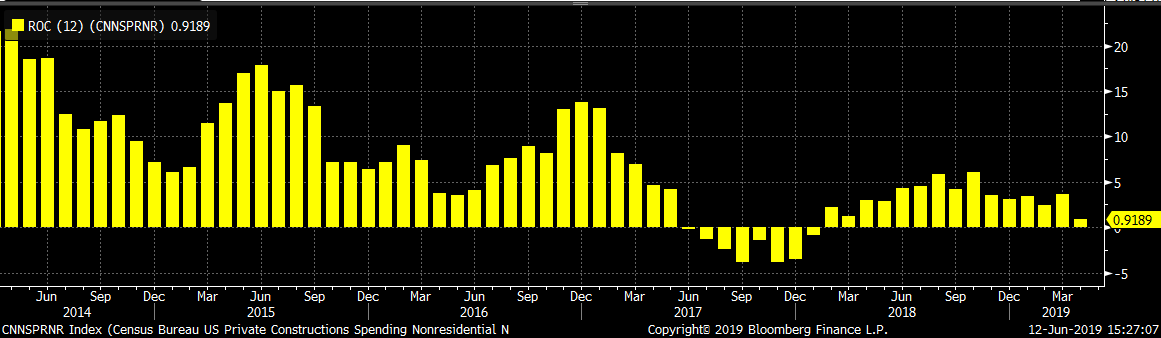
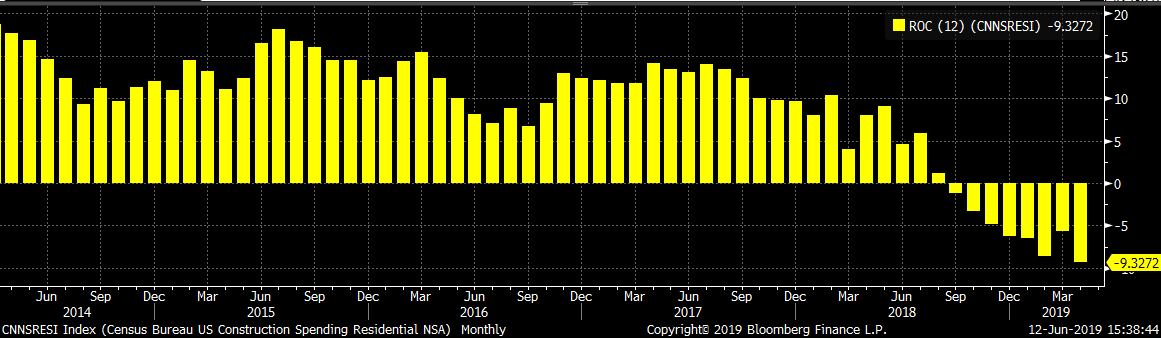
Seasonally adjusted April U.S. construction spending was flat MoM and down 1.23% YoY. Unadjusted private nonresidential construction spending was 0.65% higher MoM and 0.9% higher YoY. Unadjusted U.S. residential construction spending has been down YoY for the nine straight months, and continues to show as the weak point in construction data. This is April data and the effects of lower interest rates is not yet reflected the report.
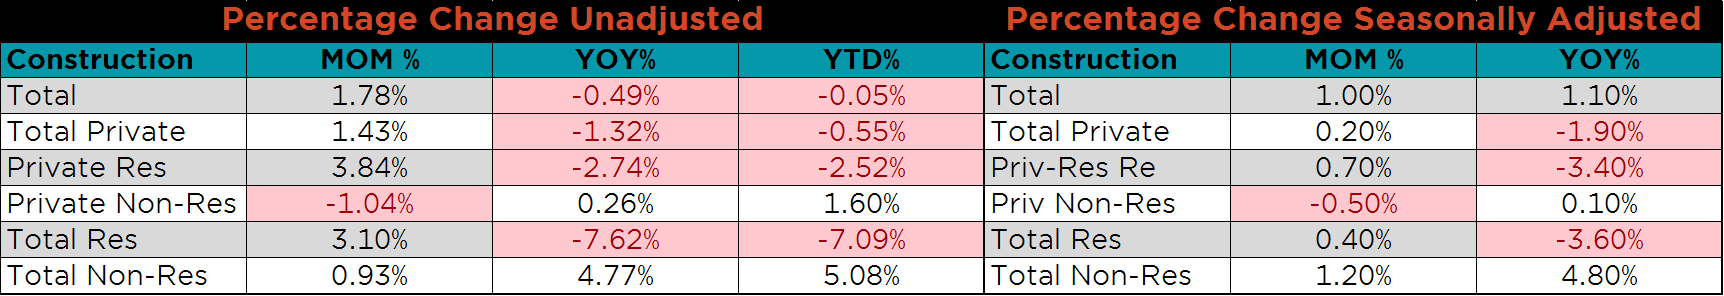
The white line in the chart below compares spending for the first 4 months of 2019 to the spending of the previous 4 years.
May U.S. light vehicle sales rose to a 17.3m seasonally adjusted annualized rate (S.A.A.R). Sales are down 1.1% compared to last year, but remain at historically strong levels.
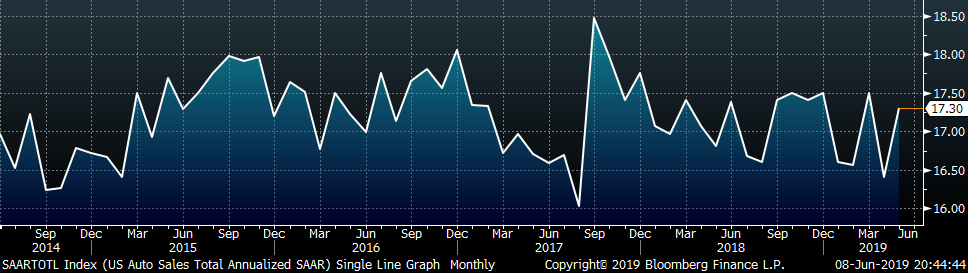
The white line in the chart below compares auto sales for the first 5 months of 2019 to the sales of the previous 4 years.
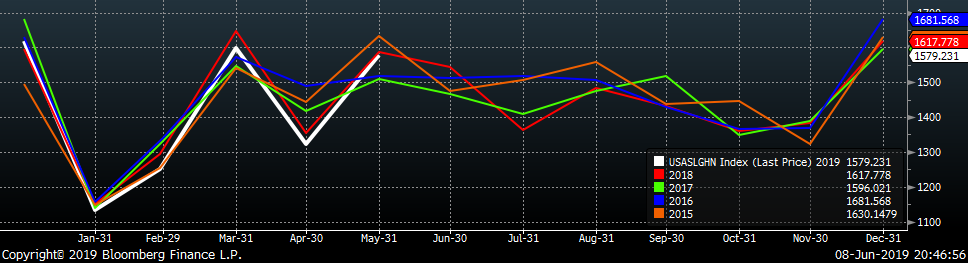
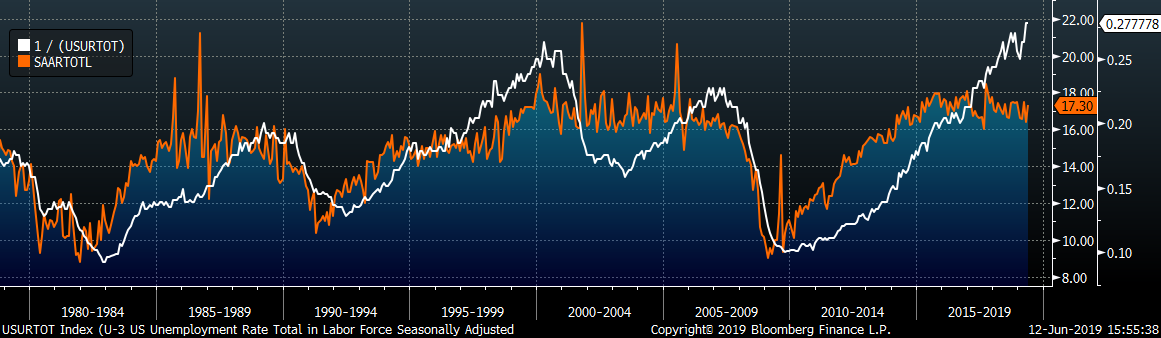
May annualized auto sales continued lower while the U.S. unemployment rate fell to 3.6%.
Below are the most pertinent upside and downside price risks:
Upside Risks:
Downside Risks:
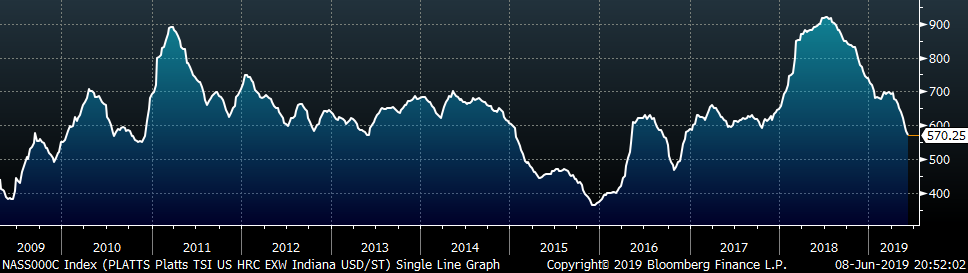
The Platts TSI Daily Midwest HRC Index was down $12.50 to $570.25.
The CME Midwest HRC futures curve is shown below with last Friday’s settlements in white. The curve shifted lower in the front and in the back last week.
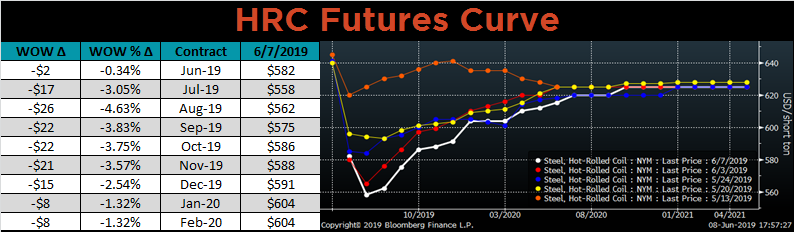
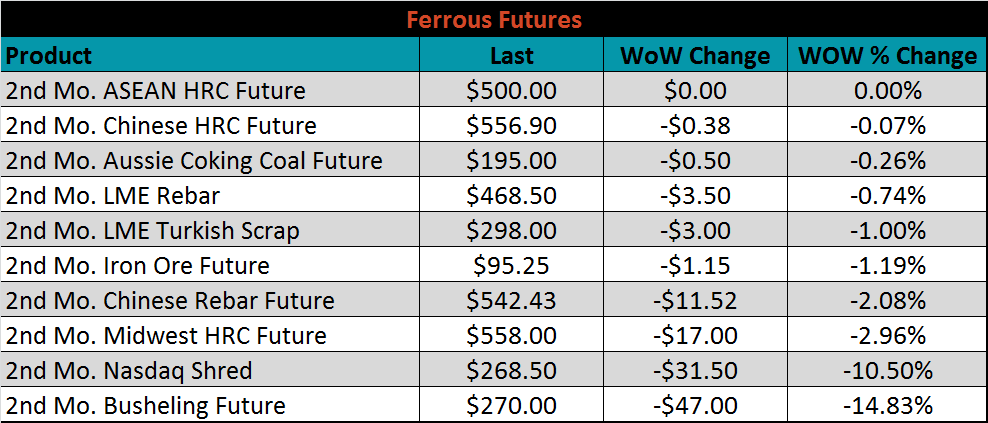
June ferrous futures were down. The busheling future lost 14.8%.
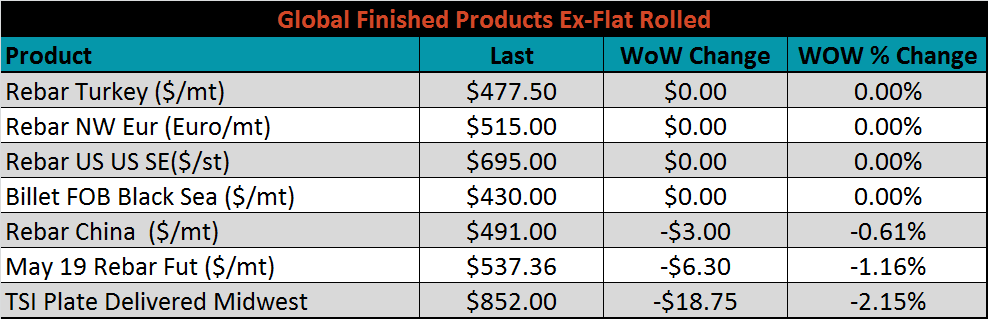
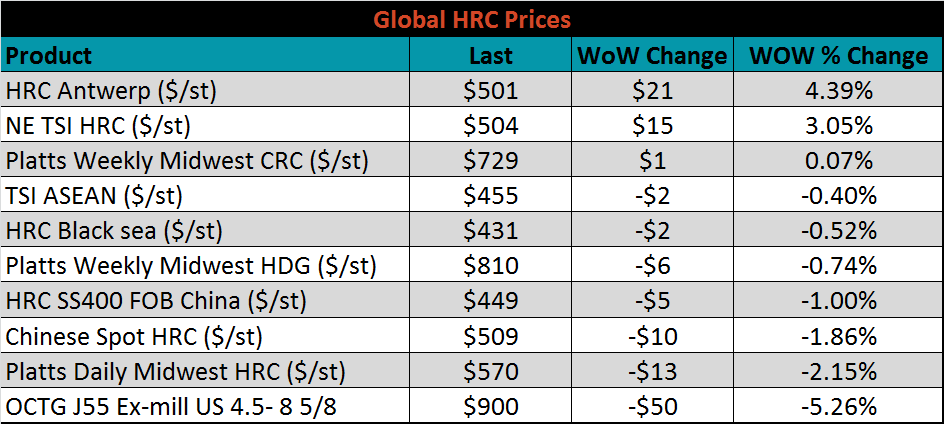
The global flat rolled indexes were mixed. Antwerp HRC is up 4.39%, while Platts Midwest HRC is down 2.2%.
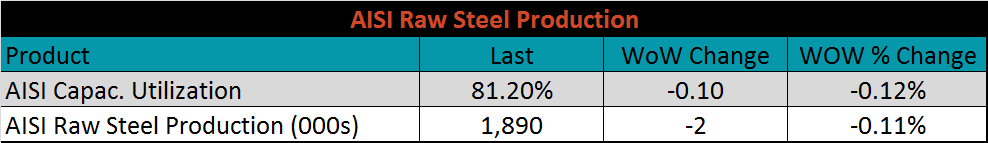
The AISI Capacity Utilization Rate was down 0.1 points to 81.2%. The Trump administration’s goal of 80% Capacity Utilization Rate has held since October 2018. Questions about the sustainability of these high production levels continue to mount as prices fall but mills are in a difficult position, as they would likely fall under scrutiny for taking furnaces offline.
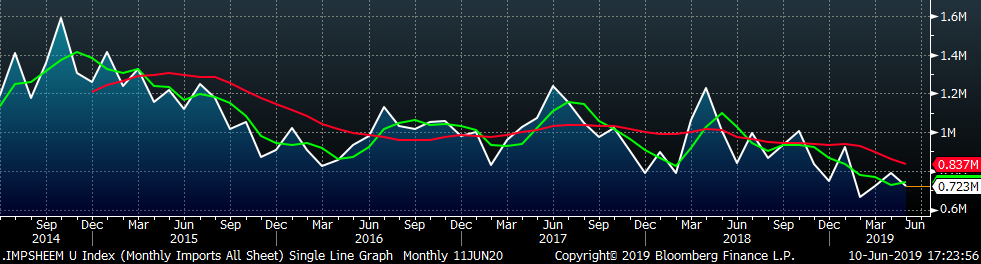
May flat rolled import license data is forecasting a decrease to 723k, down 65k MoM.
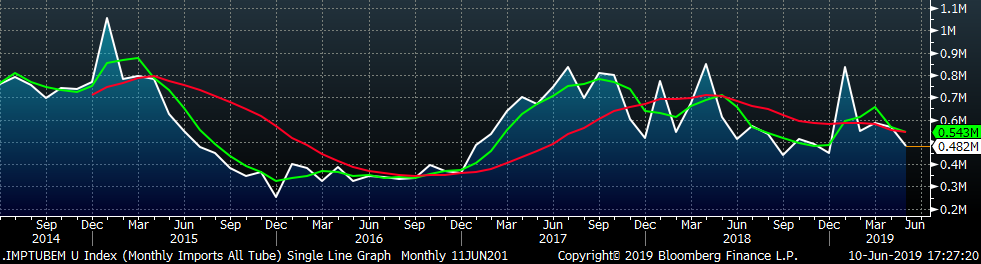
May tube import license data is forecasting a MoM decrease of 83k to 482k tons.
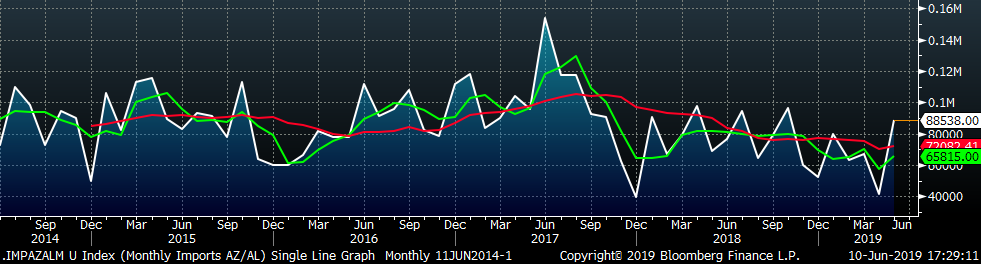
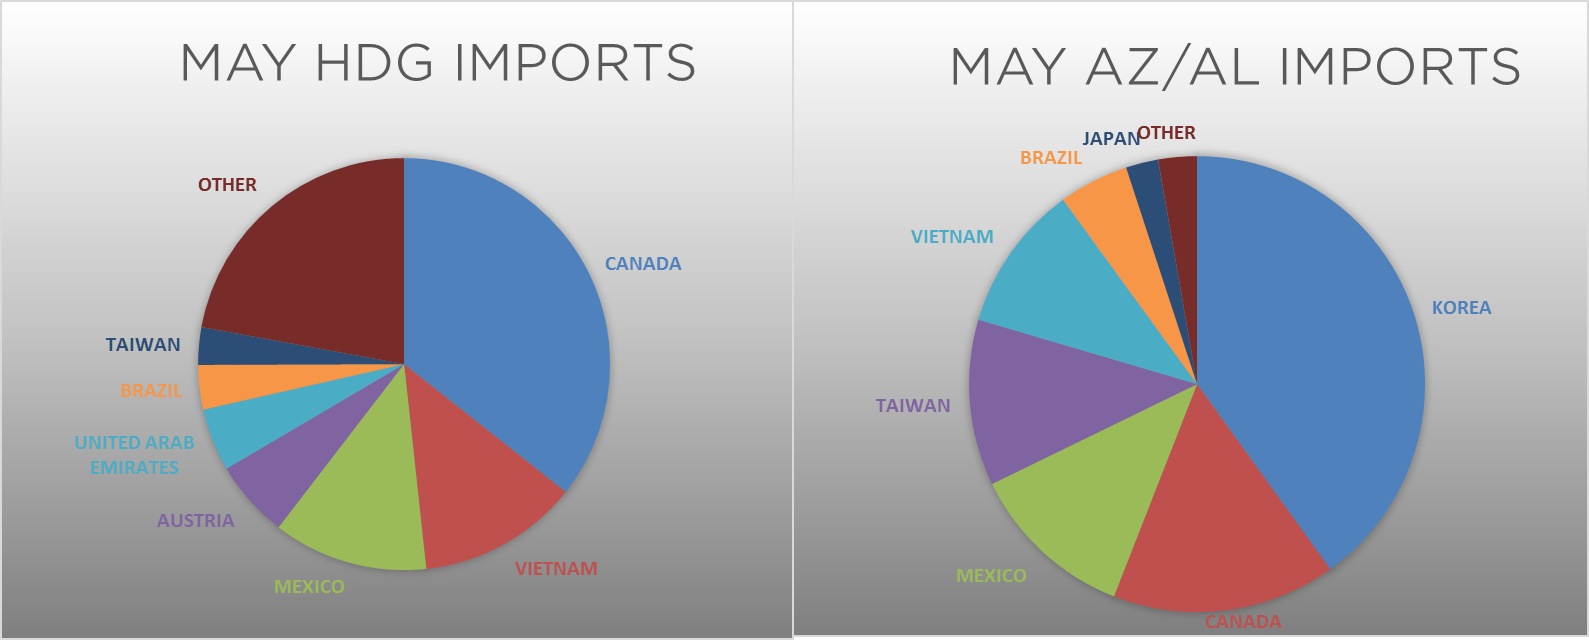
AZ/AL import licenses forecast an increase of 47k MoM to 90k in May.
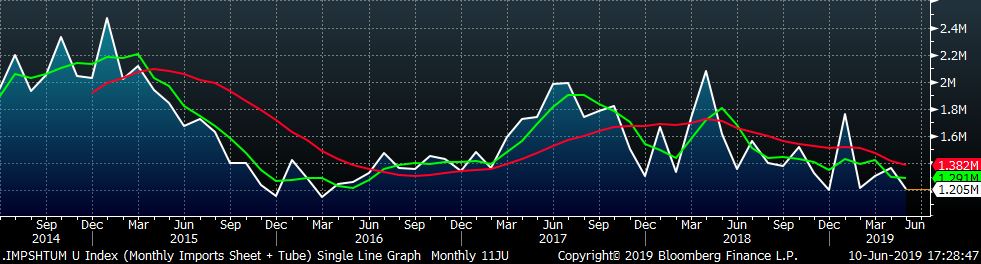
Below is May import license data through June 4, 2019.

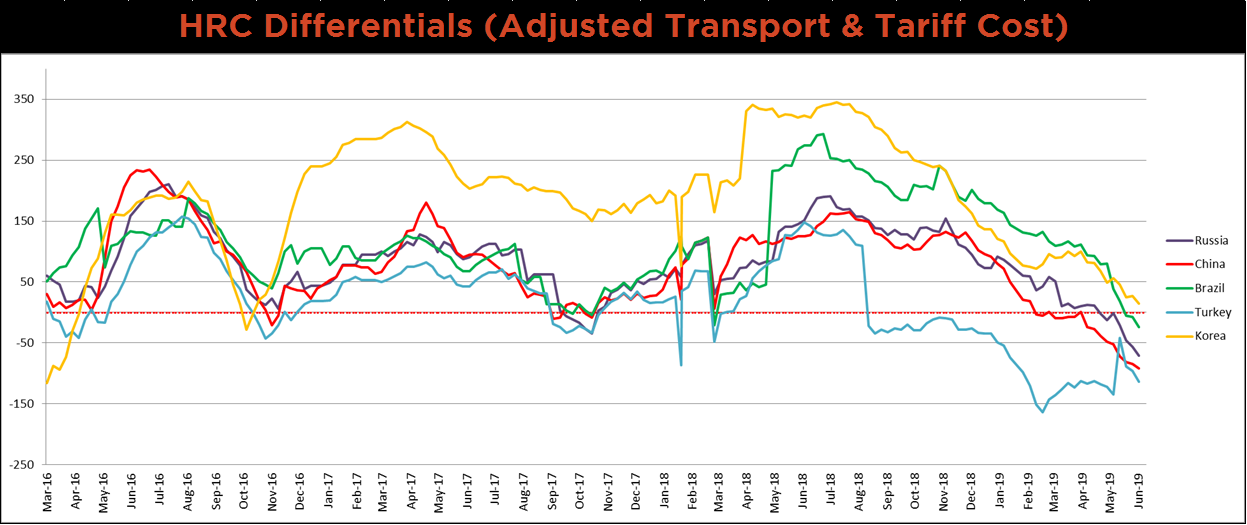
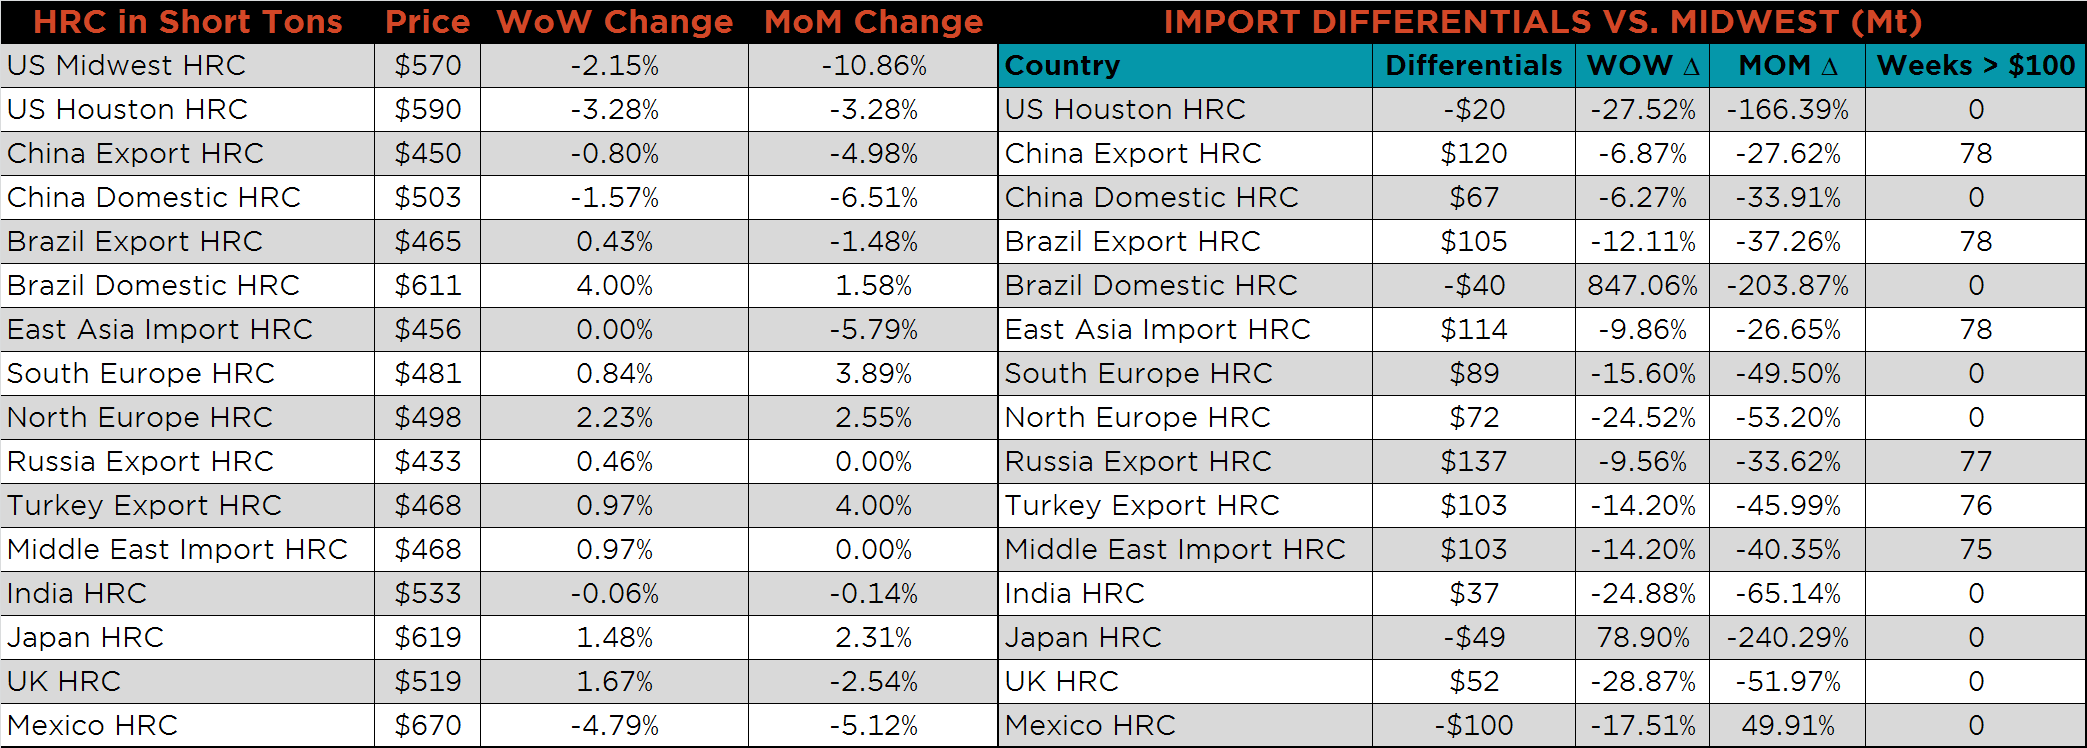
Below is HRC Midwest vs. each listed country’s export price differential using pricing from SBB Platts. We have adjusted each export price to include any tariff or transportation cost to get a comparable delivered price. All of the price differentials moved lower last week, but Korea’s price differential remains above the only country that is not negative. Historically, the zero price differential level has acted as a bottoming signal for domestic HRC prices.
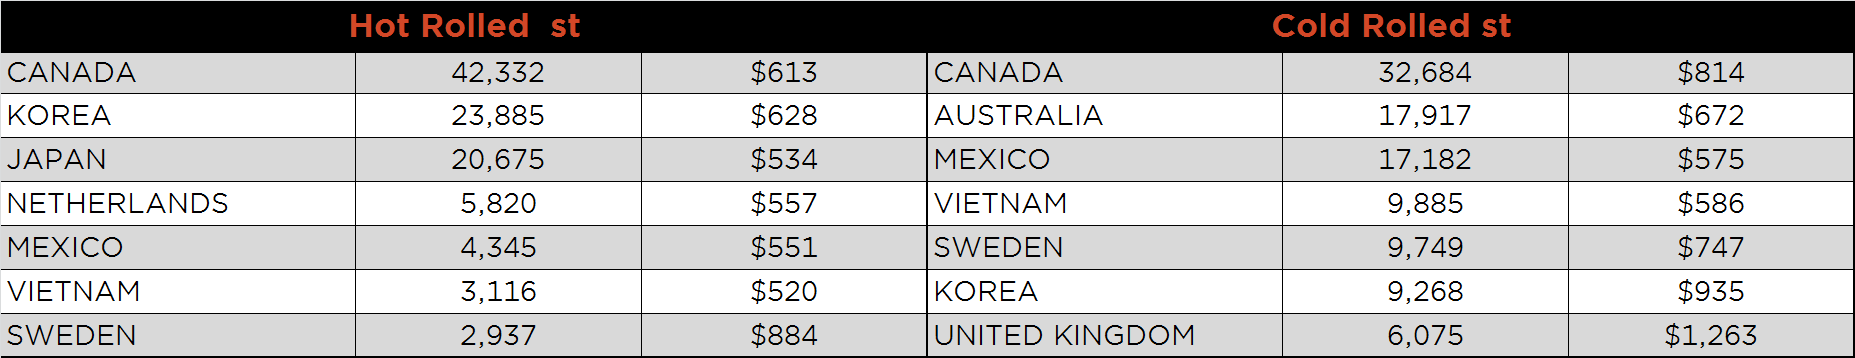
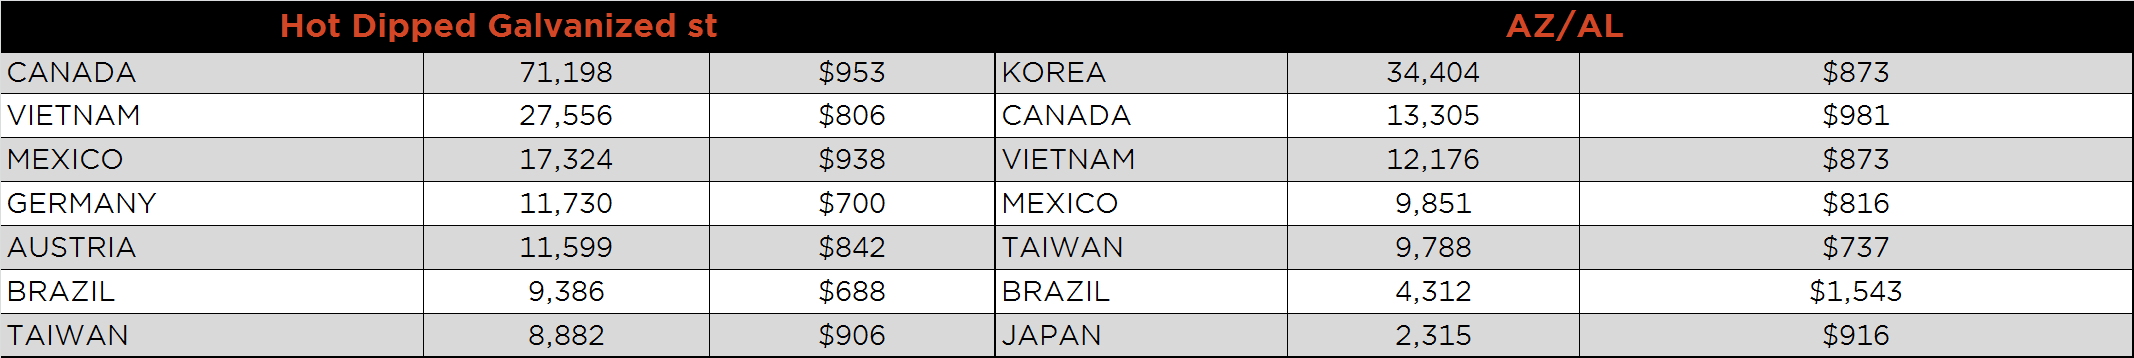
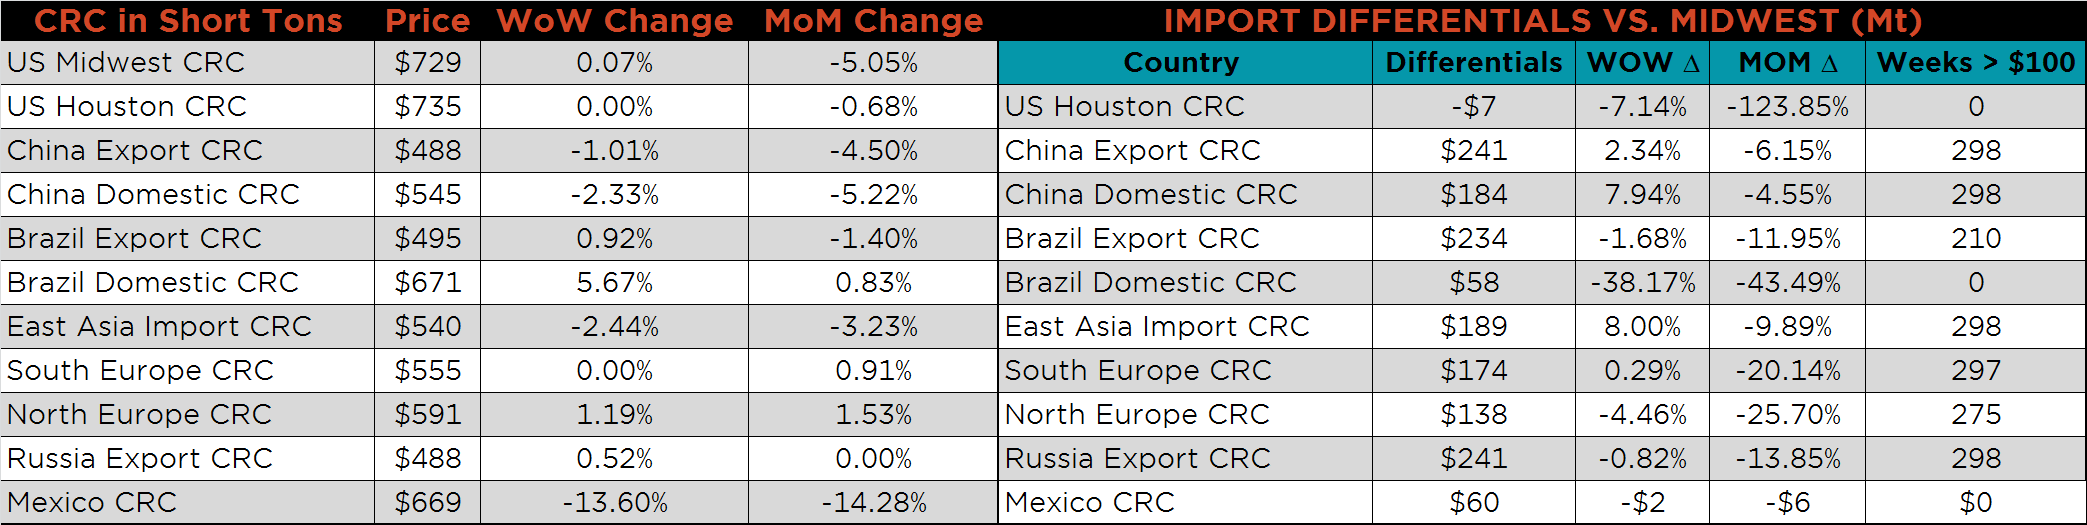
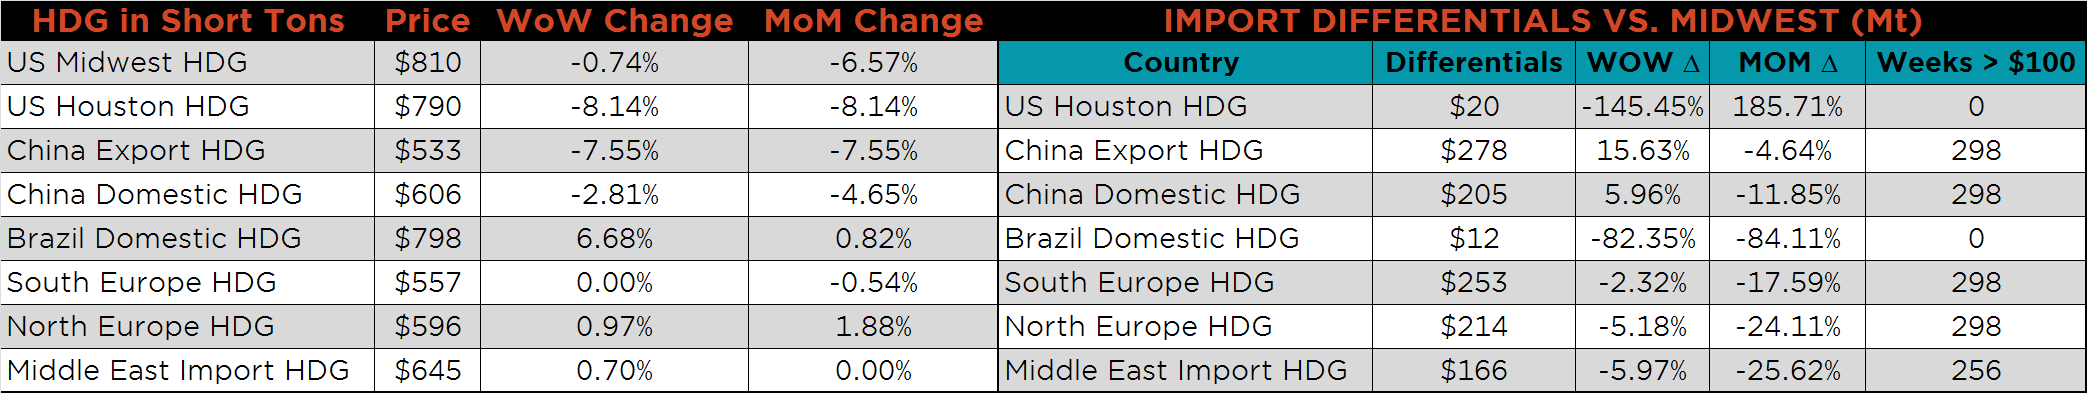
SBB Platt’s HRC, CRC and HDG pricing is below. Midwest HRC and HDG prices were lower on the week, 2.2%, and 0.7%, respectively, while the CRC price rose slightly. Brazilian domestic prices rose dramatically, while Chinese HDG, CRC and HRC export prices were all down, 7.6%, 1% and 0.8%, respectively.

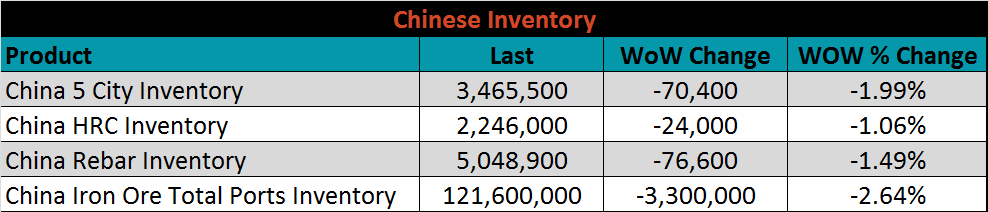
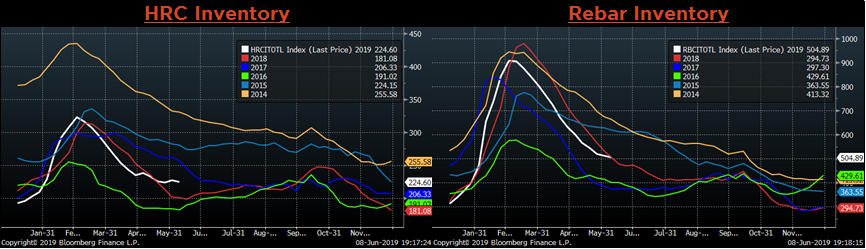
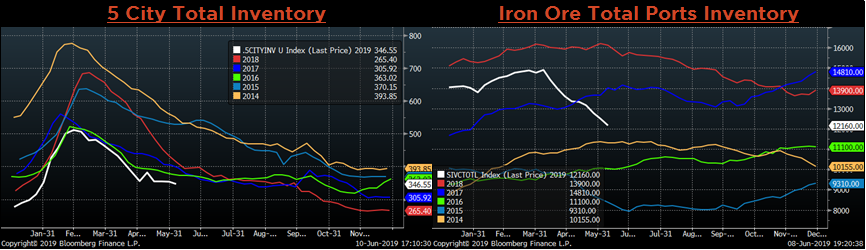
Below are inventory levels for Chinese finished steel products and iron ore. All four of the recorded inventories fell on the week. China is the largest iron ore importer, a decline this rapid of inventory suggests that prices have room to rally if global demand for steel is not stifled.
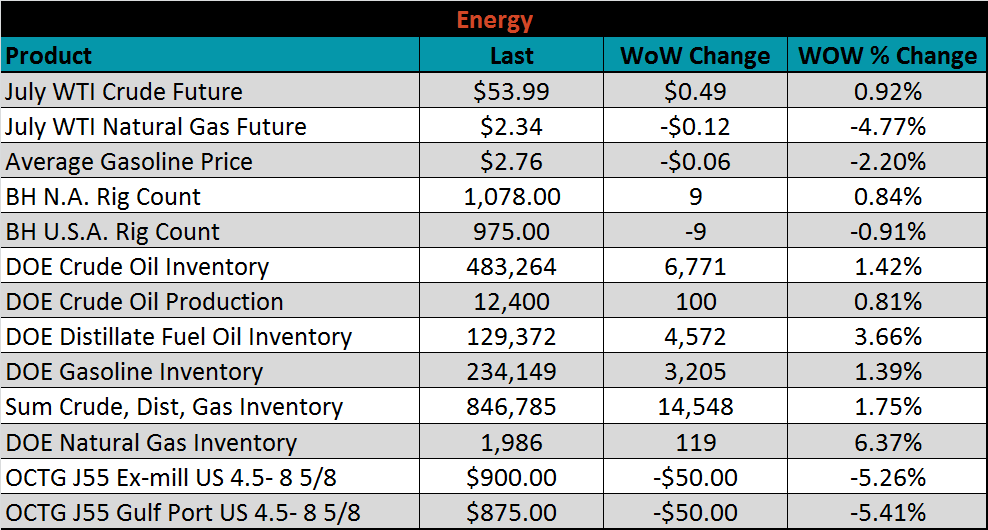
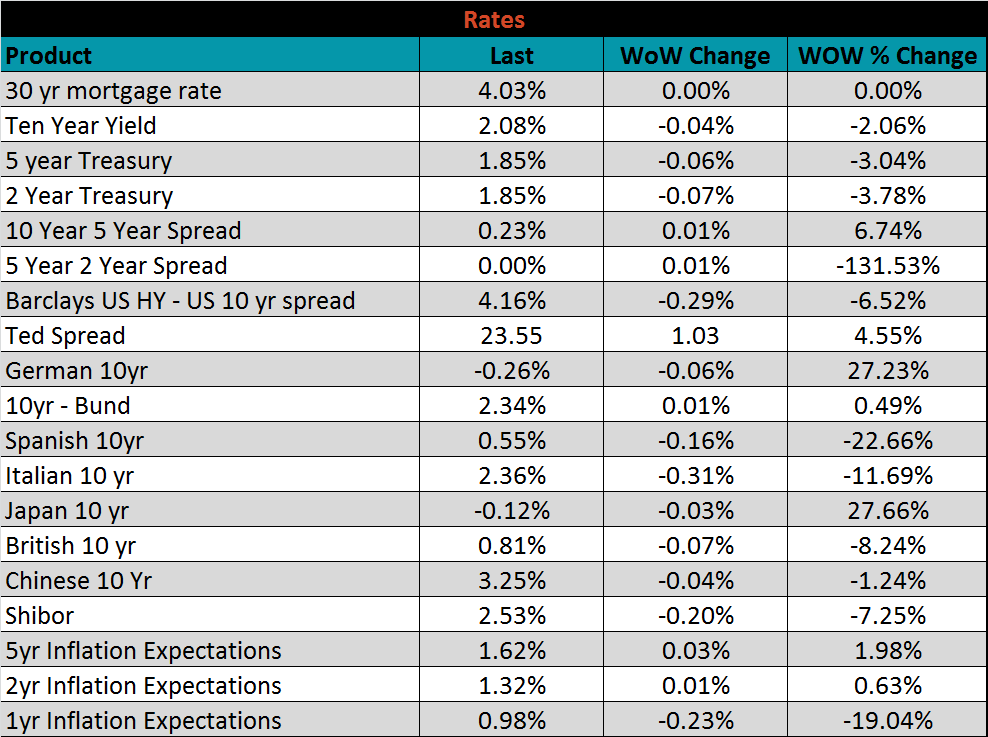
Below is the remainder of the economic data. One area of economic interest not discussed above is what the FOMC will do with interest rates over the remainder of the year. After a December rate increase, the Fed has taken a patient approach, waiting for more data before making a decision, but there has been growing pressure for a rate cut. June 18-19 is the next FOMC meeting but it is unlikely for anything other than kicking the can down the road, but a cut in July (30-31) or September (17-18) appears to be far more likely than an increase.
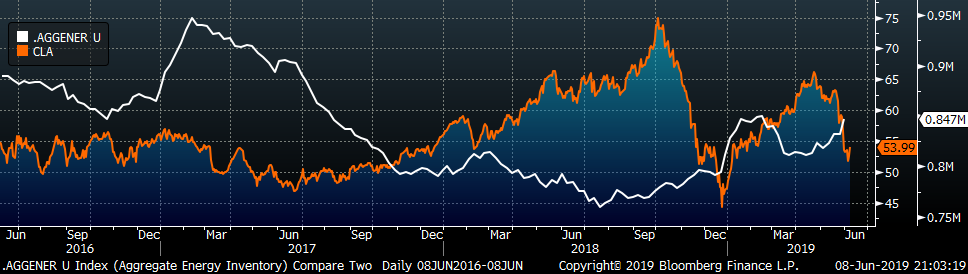
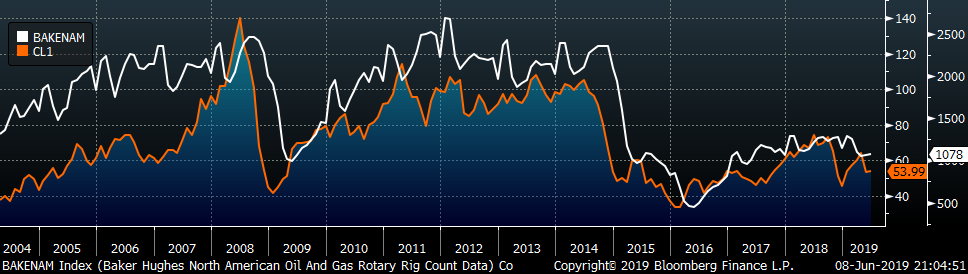
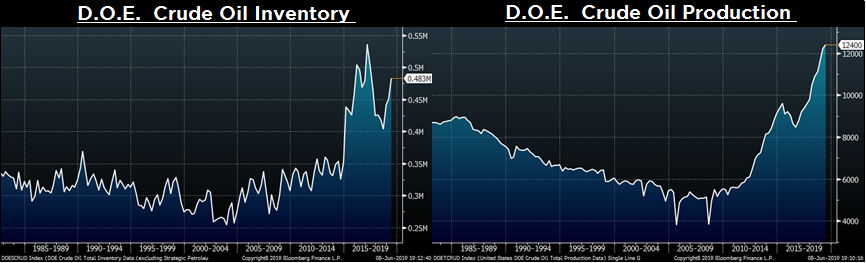
Last week, the July WTI crude oil future gained $0.49 or 0.9% to $53.99/bbl. The aggregate inventory level was up 1.8%, and crude oil production rose to 12.4m bbl/day. The Baker Hughes North American rig count gained nine rigs, while the U.S. lost nine rigs.
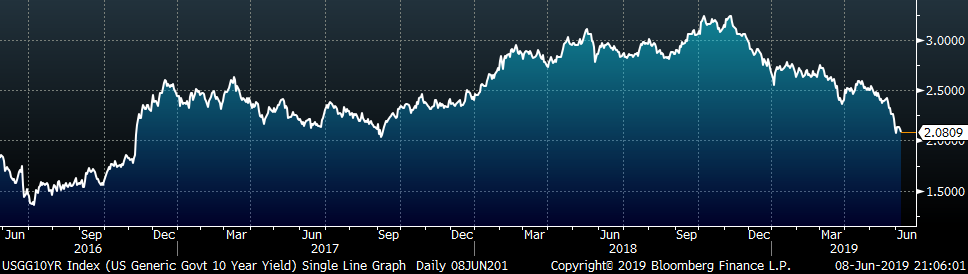
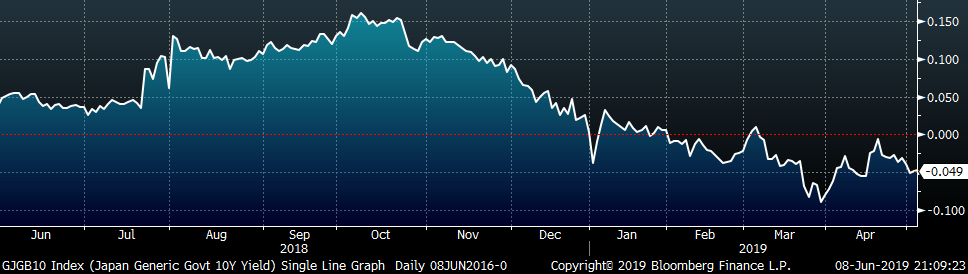
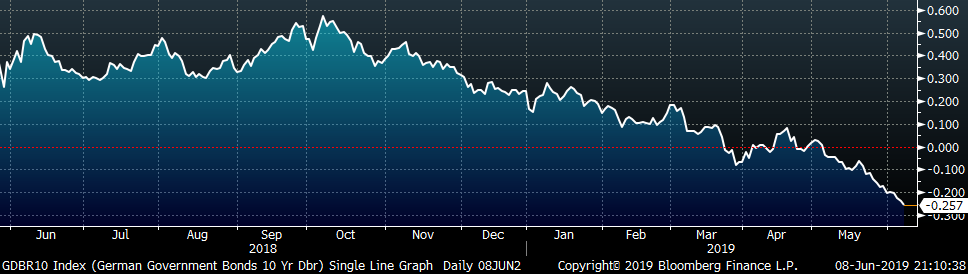
The U.S. 10-year treasury yield was down four basis points, closing the week at 2.08%. The Japanese 10-year yield was down three basis points to -0.12%, and the German 10-year yield was down six more basis points to -0.26%.
The list below details some upside and downside risks relevant to the steel industry. The orange ones are occurring or look to be highly likely. The upside risks look to be in control.
Upside Risks:
Downside Risks: