Content
-
Weekly Highlights
- Market Commentary
- Risks
- ISM PMI
- Global PMI
- Durable Goods
- Construction Spending
- Auto Sales


Proceed with caution.
For months, caution would be the one word used to describe the theme of this report. Unlike last year when there was a clear upward bias in domestic and global manufacturing data combined with the explosive upside risk of the 232 catalyst, thus far in 2019 the direction is anything but clear.
Domestic and global economic data has been weak and disappointing. Domestic mills look to have overproduced based on AISI production data and increased inventory levels reported in their most recent earnings reports. Lead times have fallen to ultra-low levels seeing only a marginal increase following the two price increase announcements. 2018 net exports through November (Dec. data hasn’t been updated) showed that while flat rolled imports fell during the first eleven months of 2018, exports fell by more.
However, January and February flat rolled import license data indicates imports have fallen dramatically to the lowest level since at least 2013 when we started tracking them. The rally in iron ore and flat rolled steel prices in Asia have resulted in unattractive tariff adjusted differentials, which will result in subdued import levels in the coming months. Service centers destocked sharply to start the year as the industry struggles with a massive hangover from 2018 including inventory write-downs, customer defaults and breached covenants. It would seem supply has tightened at the distributor level, but it remains uncertain if and/or when the service centers push their capital back into inventory.
The supply side is only half of the equation.
Months-on-hand is calculated by dividing inventory by shipments. Shipments are the result of purchase orders and if purchase orders slow, simply slowing the purchase of new material allows a manufacturer to maintain a steady M.O.H. So, when new orders began to slow in late 2018, the concern became that the slowdown in new orders for steel wasn’t the result of a buyer’s strike due to high prices, but rather a result of slowing end user demand.
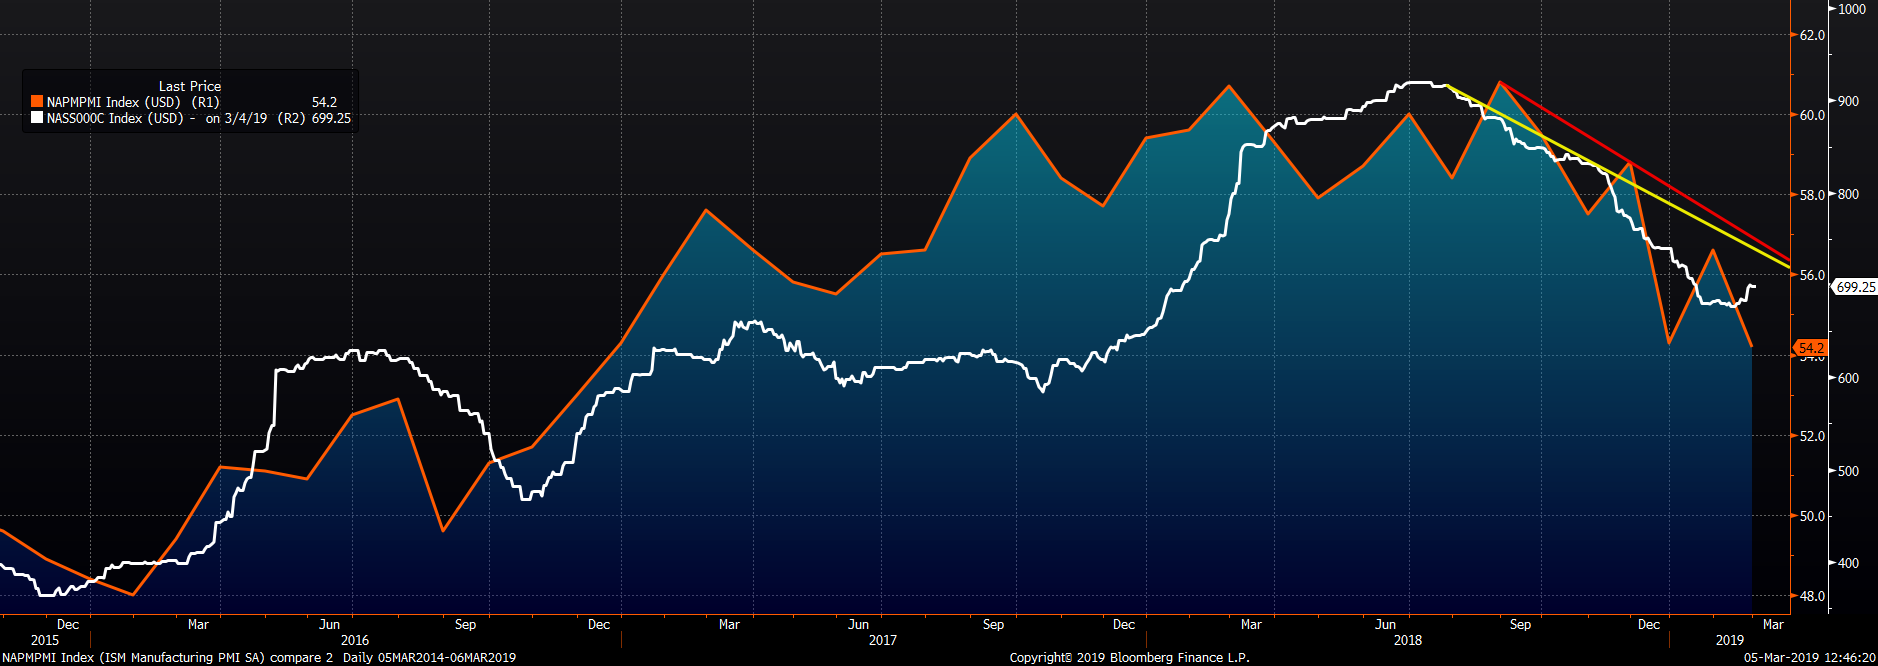
First, oil prices collapsed. Then a slowdown in residential construction became apparent. Interest rates fell and the stock market saw a sharp correction. There has been some stabilization since, but the technical damage is irreversible. The U.S. industrial economy looks to have transitioned from an uptrend to a downtrend. For instance, the three-year bull market in steel prices and the ISM Manufacturing PMI has ended and has moved into a bear market.
A slew of economic data was released in recent days confirming the down cycle has continued. The ISM manufacturing index disappointed and global PMIs were dreadful. Auto sales were weaker than expected with monthly sales at the lowest February level since 2015. December construction spending missed expectations of a 0.1% MoM gain instead contracting 0.6%.
The following issues provide the foundation of our view:
Upside Risks:
Downside Risks:
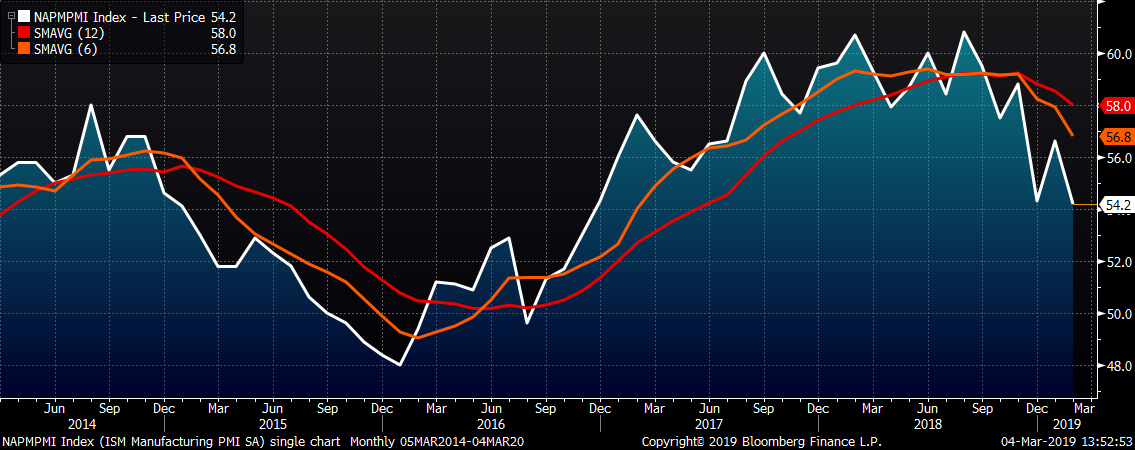
The February ISM Manufacturing PMI fell 2.4 points to 54.2 missing expectations of a fall to 55.8. February’s drop is further evidence of an economic downtrend in U.S. manufacturing.
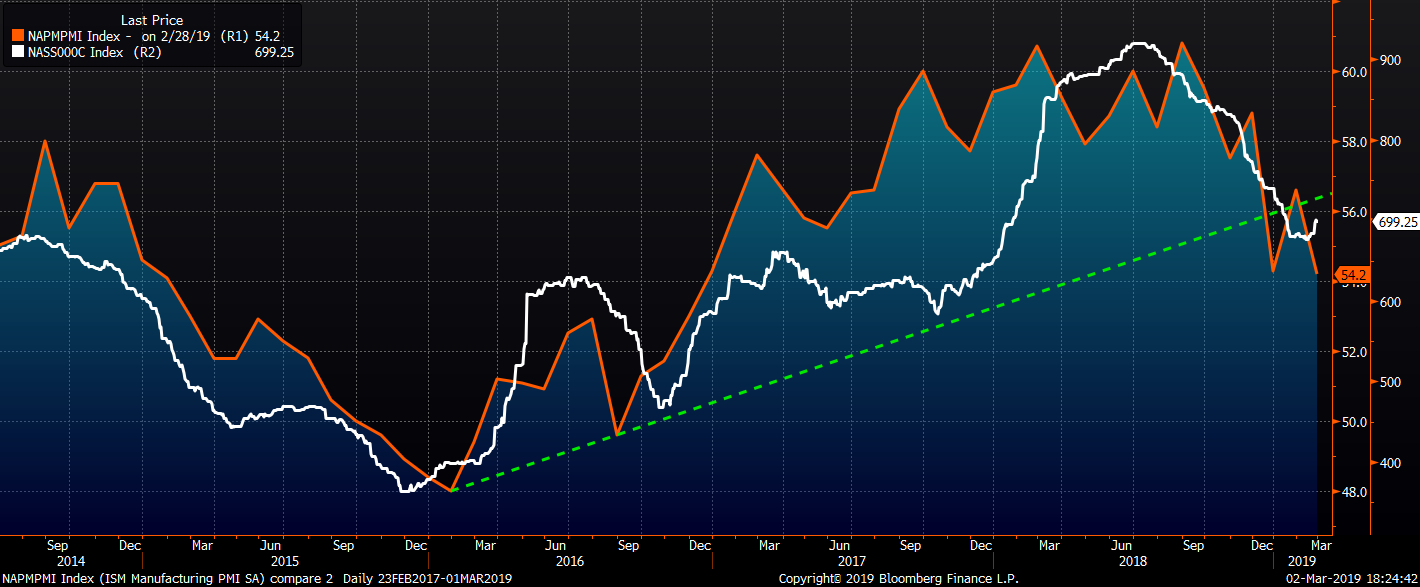
The ISM Manufacturing PMI six-month moving average decreased to 56.95 falling to its lowest level since August 2017. The six-month moving average has definitively fallen below the twelve-week moving average.
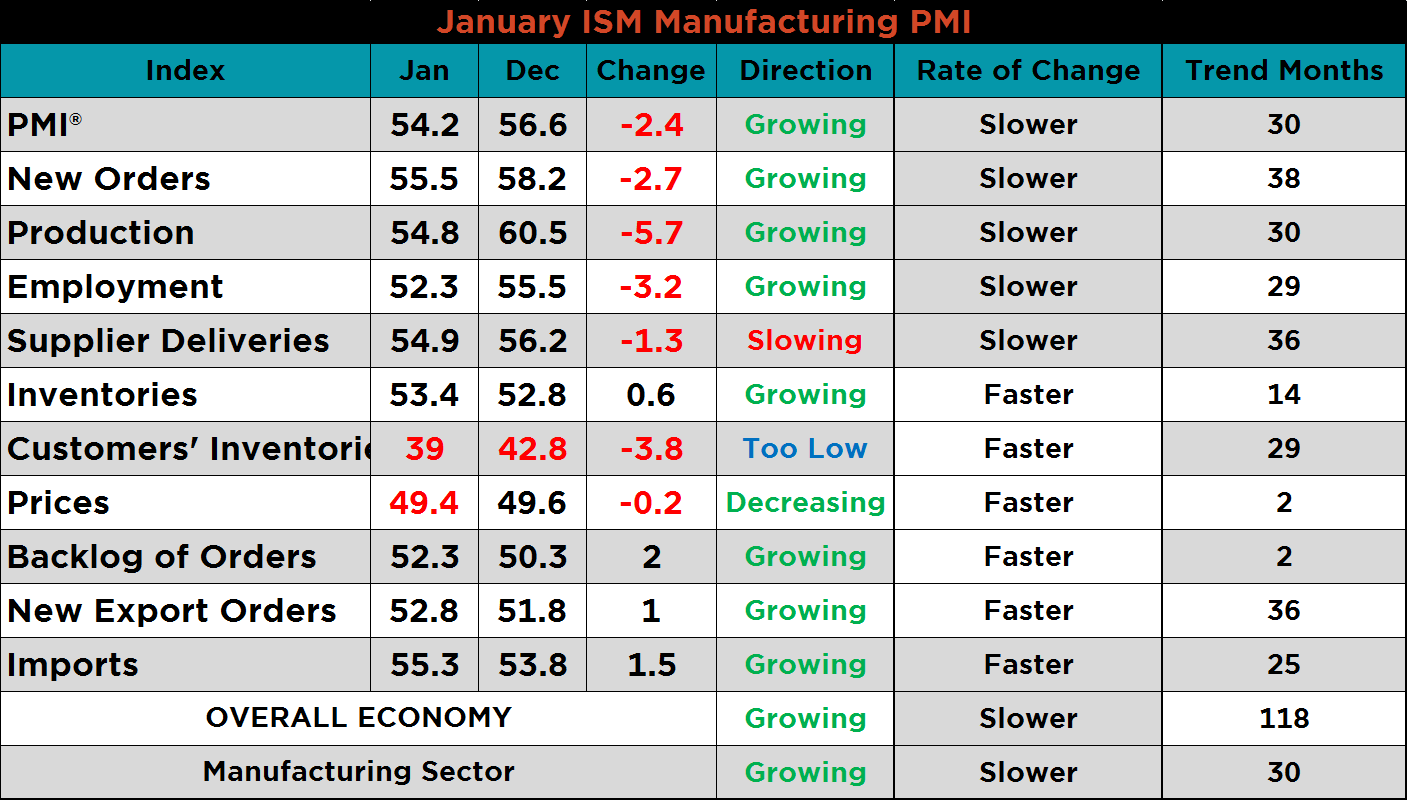
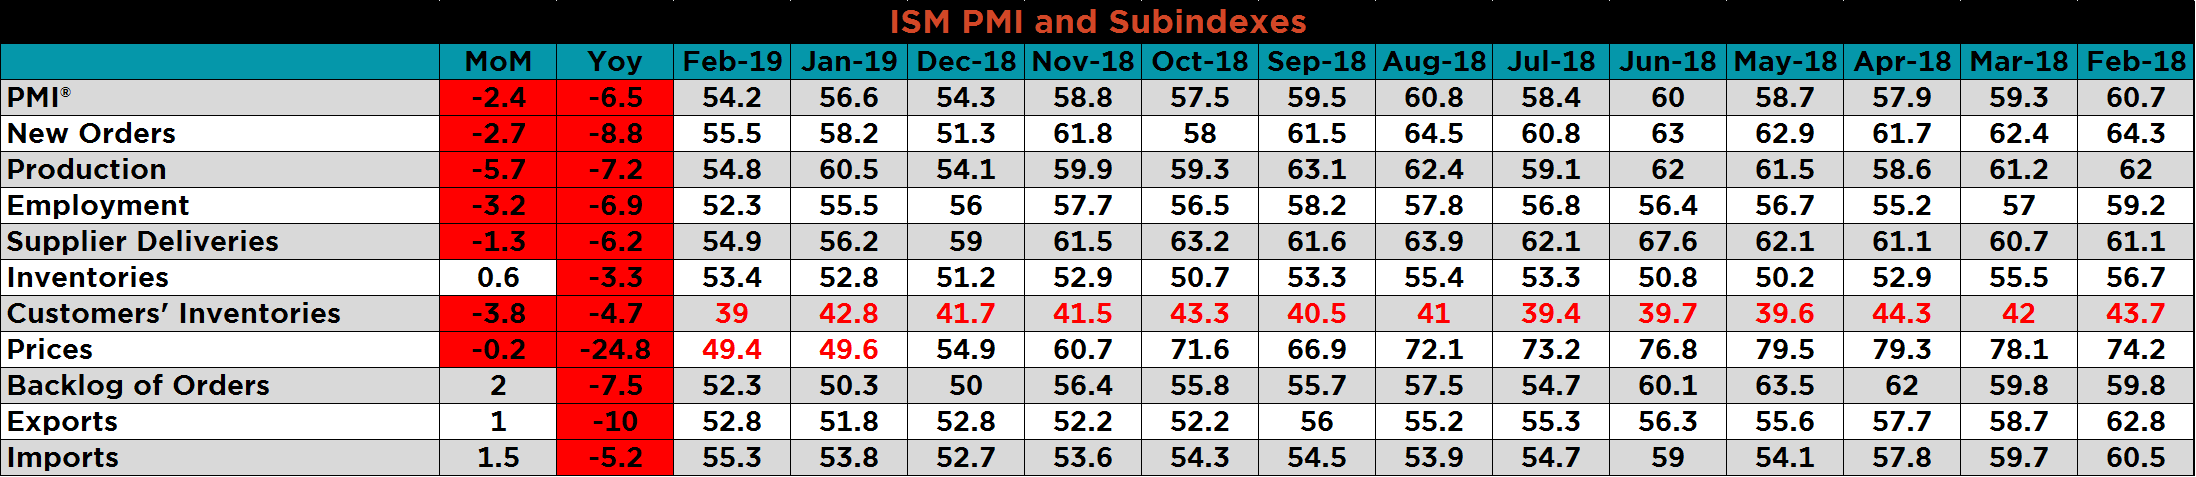
The table below shows the ISM Manufacturing PMI with subindexes. The new orders, production and employment subindexes all fell in excess of at least two points. Customers’ inventories and prices subindexes continued to contract further.
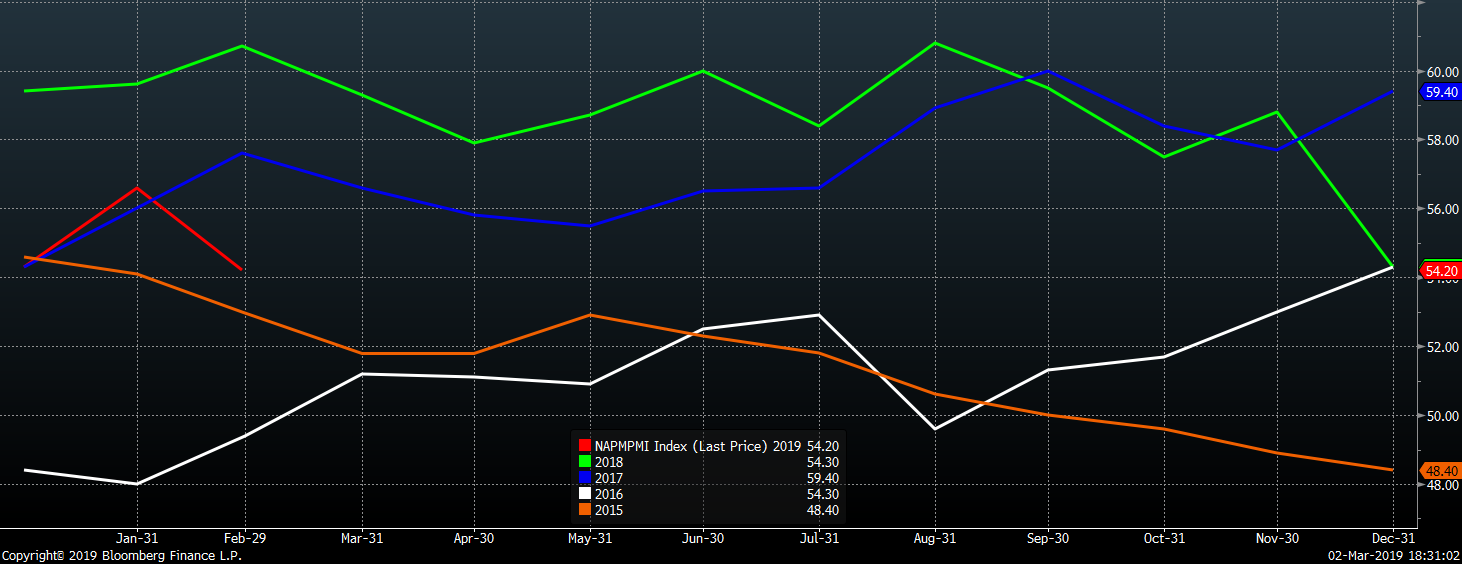
The February ISM Manufacturing PMI printed at the lowest February level of the last three years.
The next two charts compare the ISM new orders subindex and ISM prices subindex with the Platts TSI Daily Midwest HRC Index. Both subindexes remain below the Midwest HRC index indicating further price erosion for the Midwest HRC price.
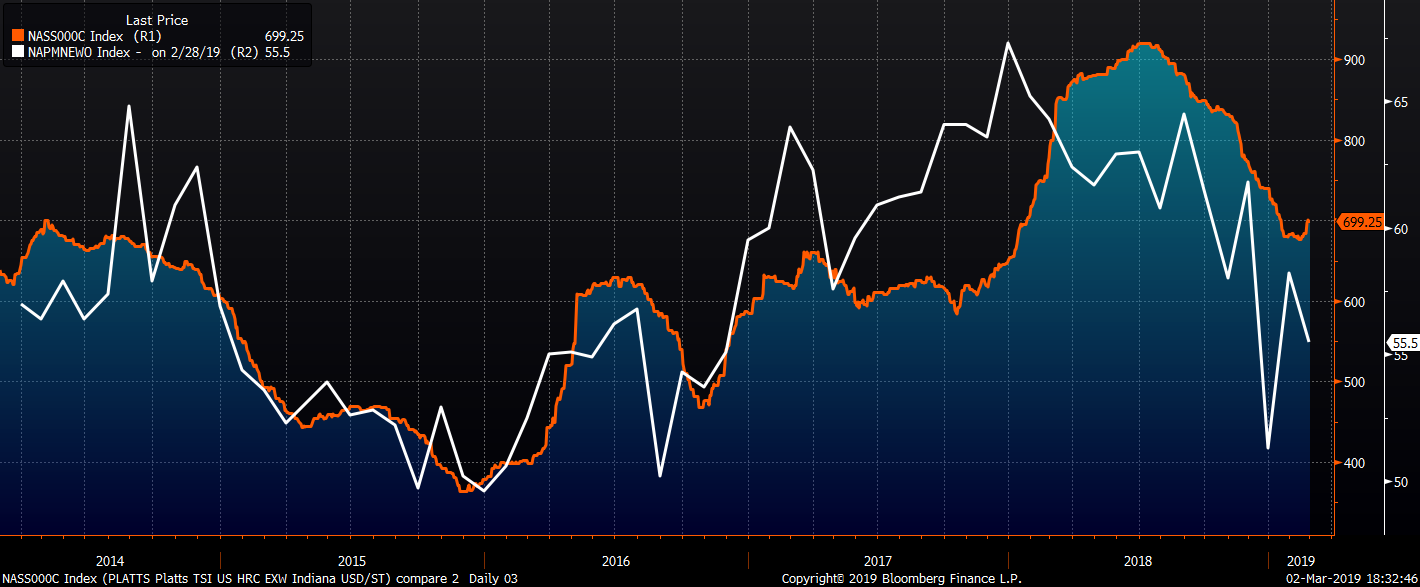
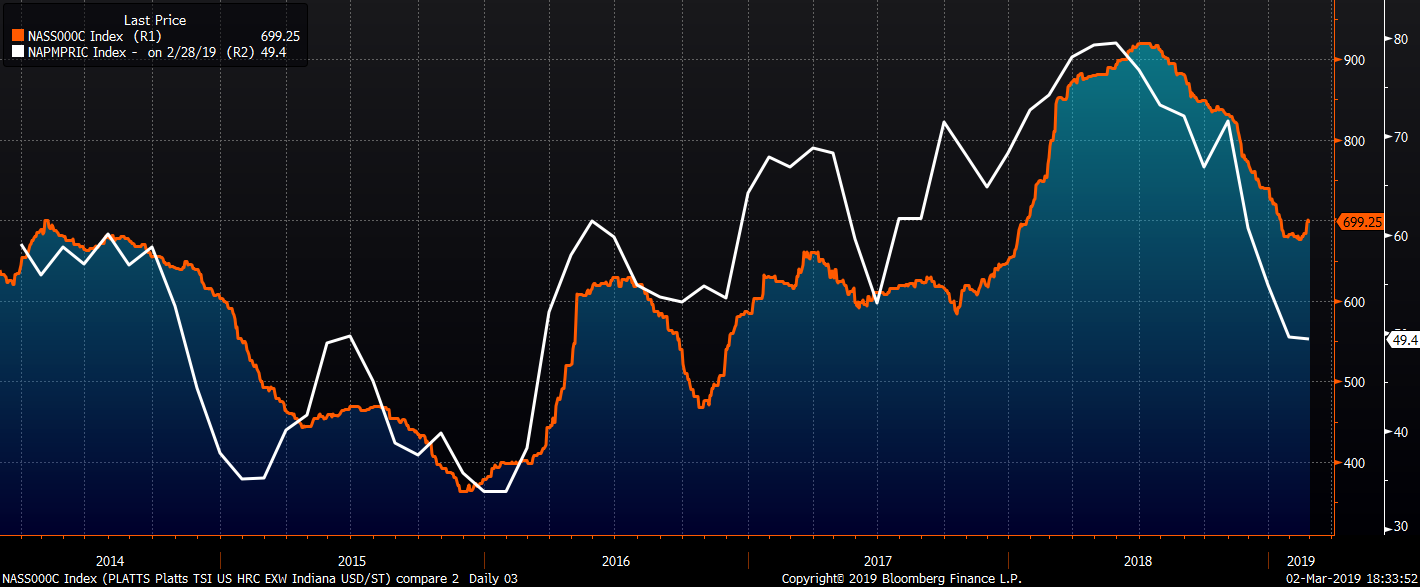
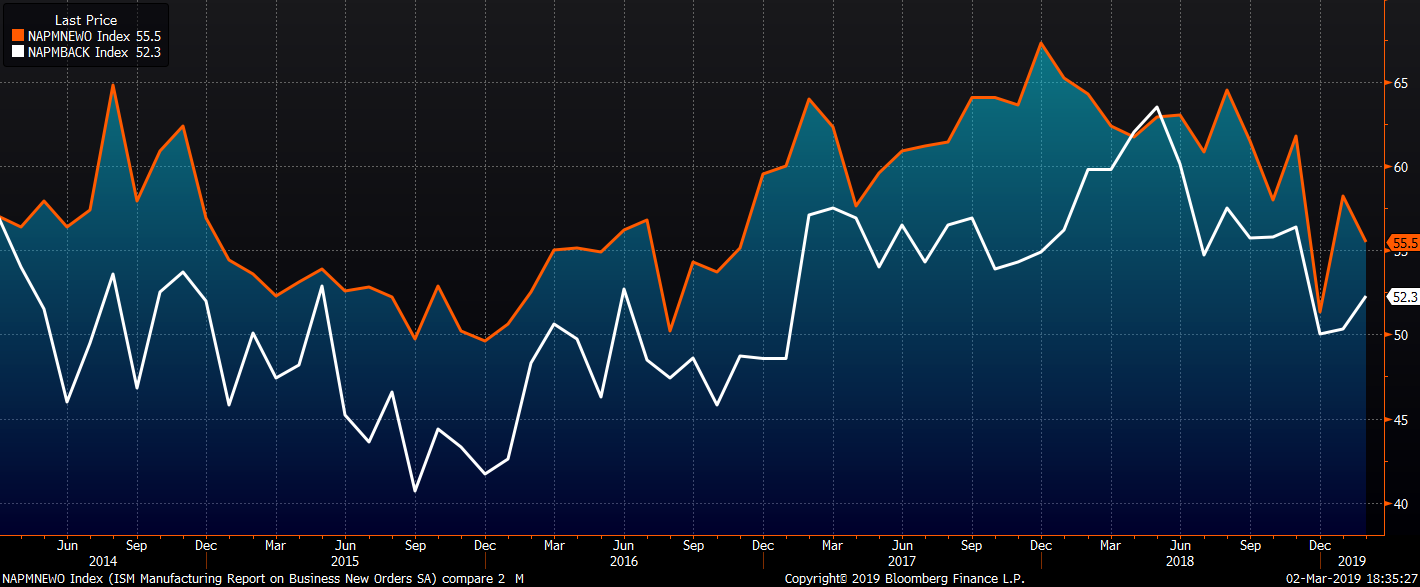
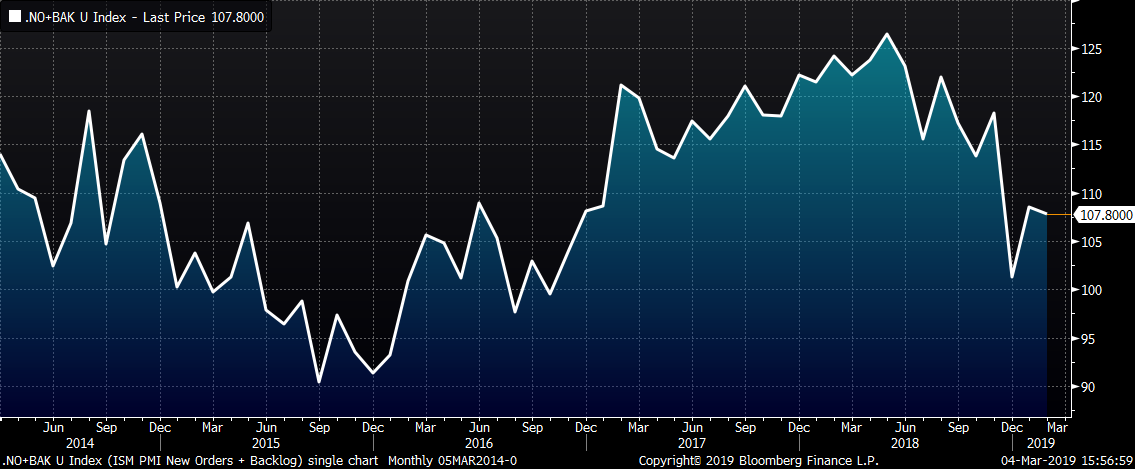
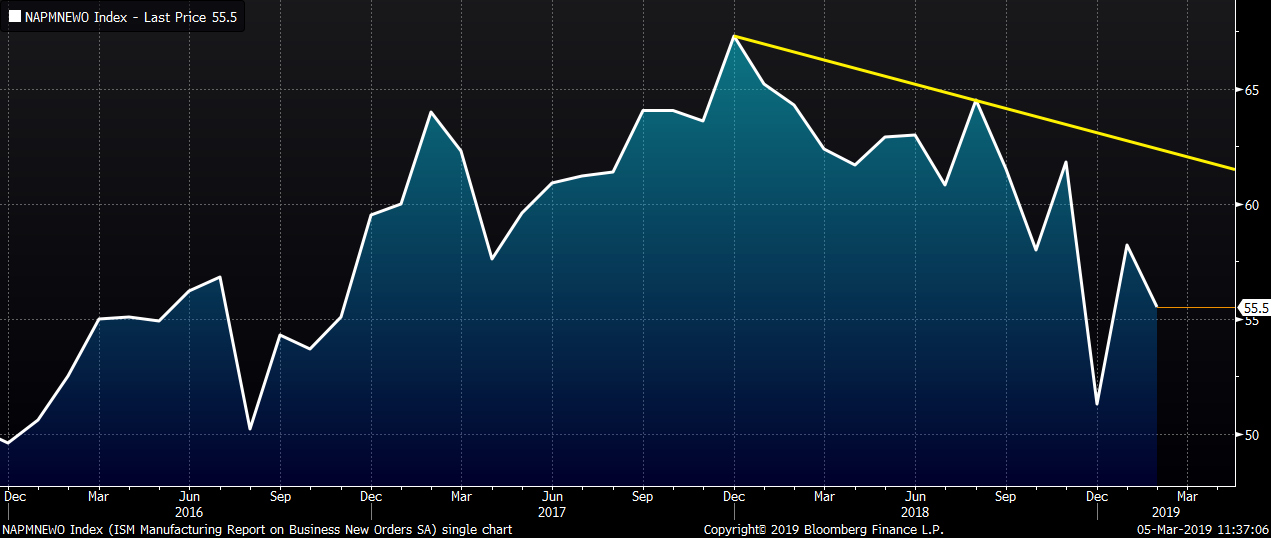
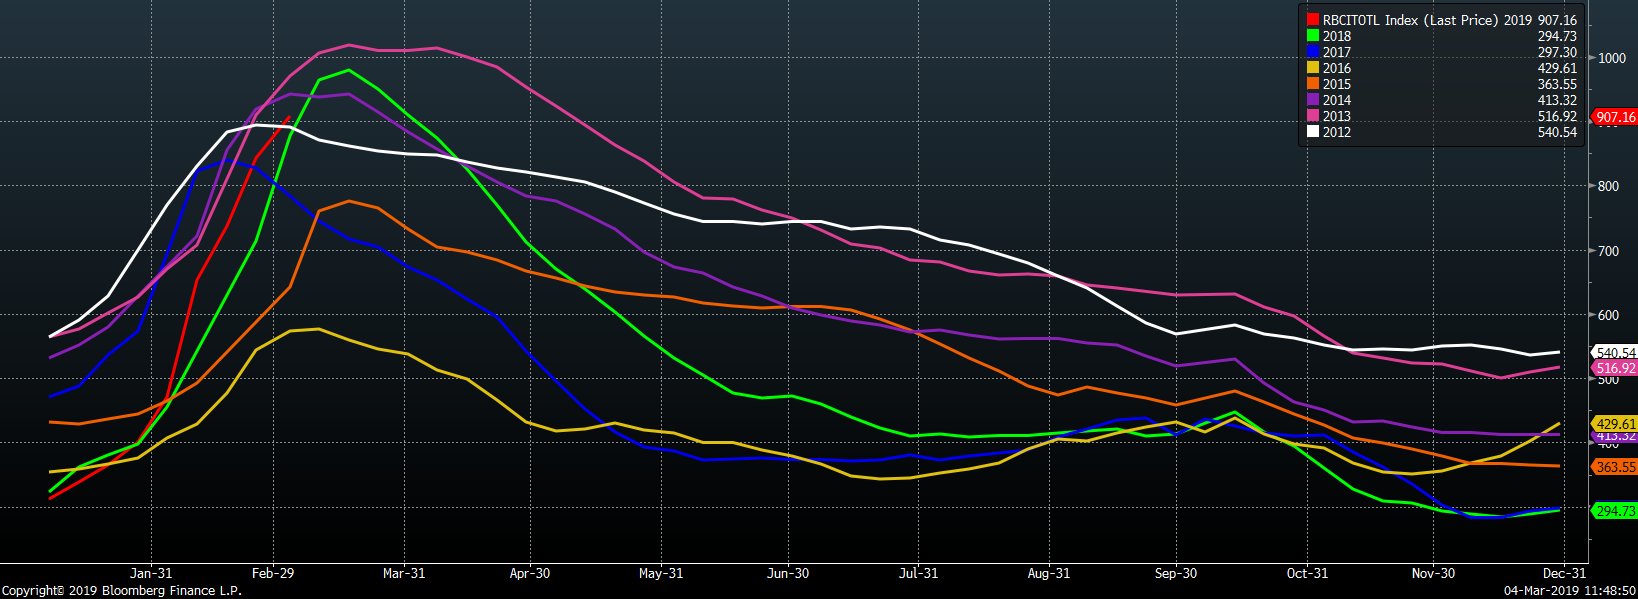
The February ISM new orders subindex fell 2.7 points to 55.5, while the backlog subindex rose 2 points to 52.3. Both fell sharply YoY.
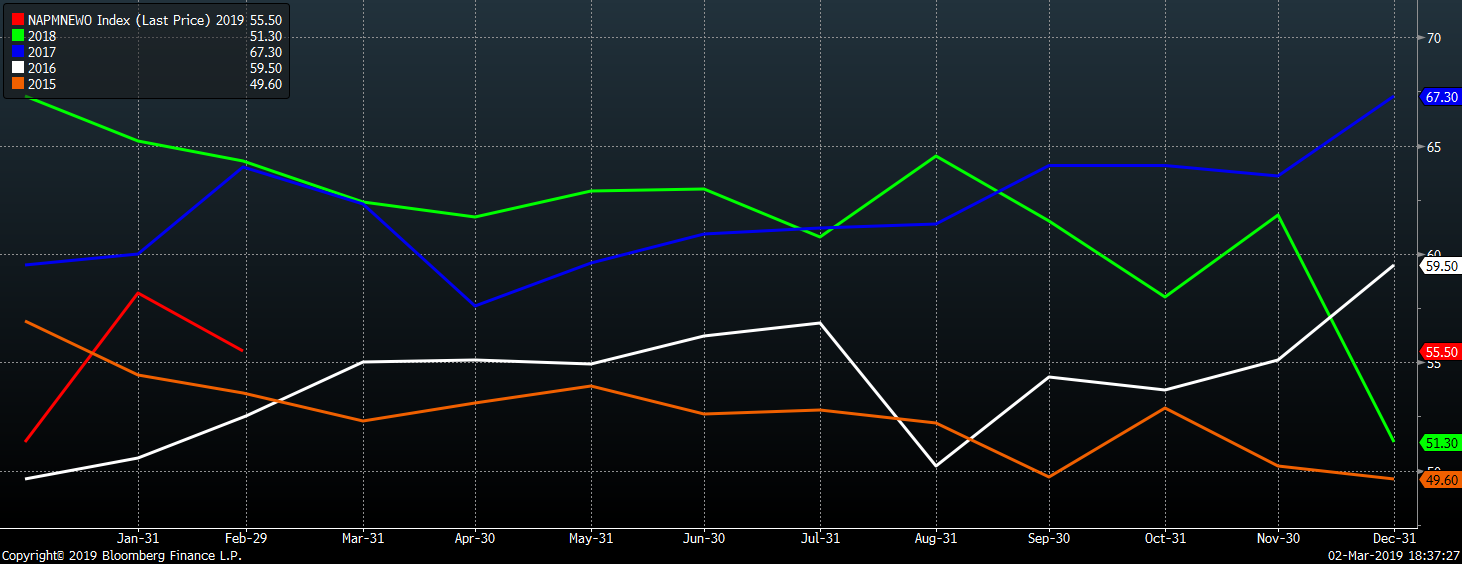
The new orders subindex fell 2.7 points to 55.5, the lowest February level since 2016. The new orders subindex was down 8.8 points YoY.
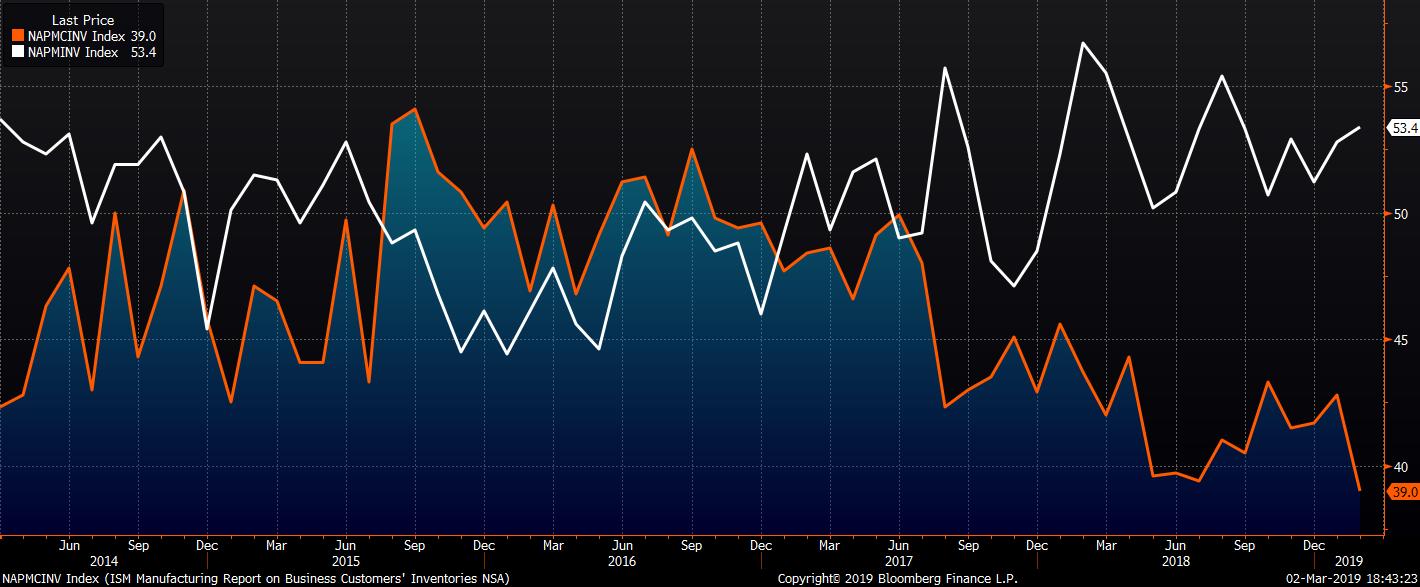
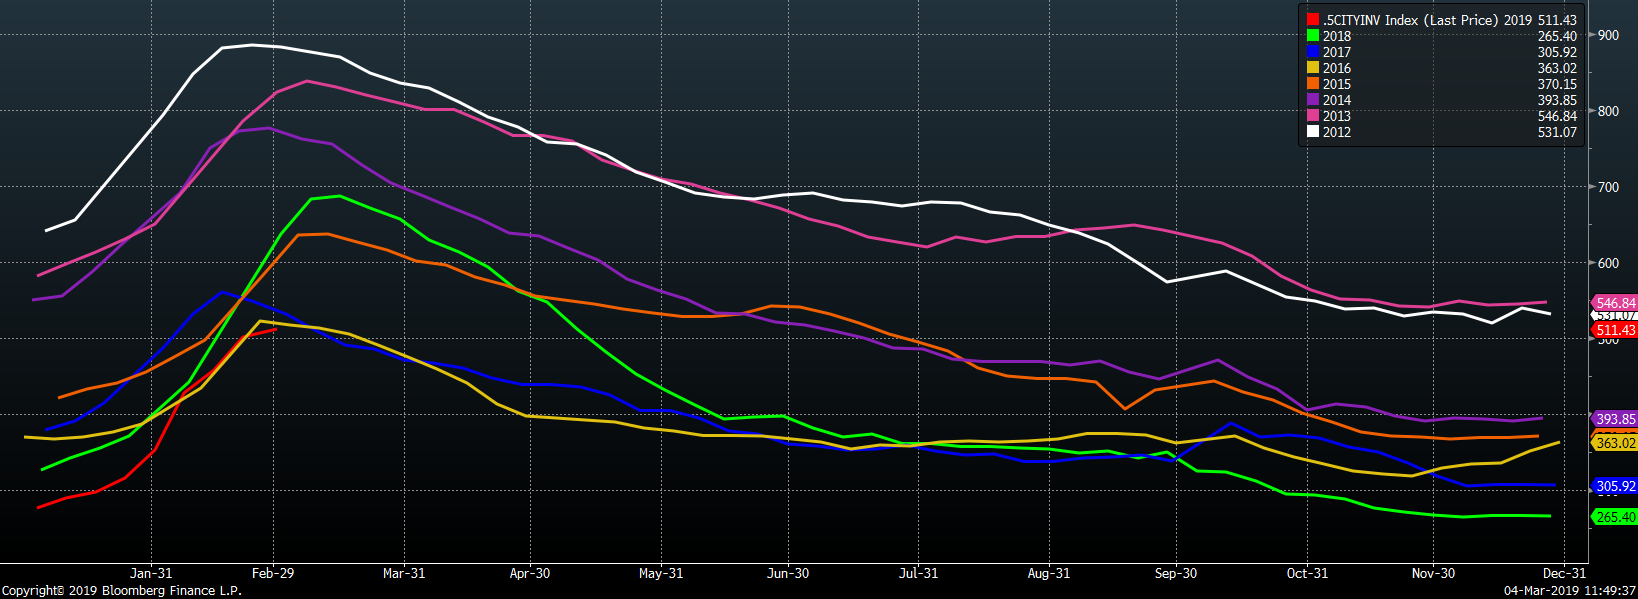
The chart below shows the producer inventory subindex up 0.6 points to 53.4, while the customer inventory subindex fell to 39 points, the lowest level since December 2010.
This table shows the monthly ISM PMI and subindexes back to February 2018. Every subindex is down YoY with the prices subindex down a massive 24.8 points.
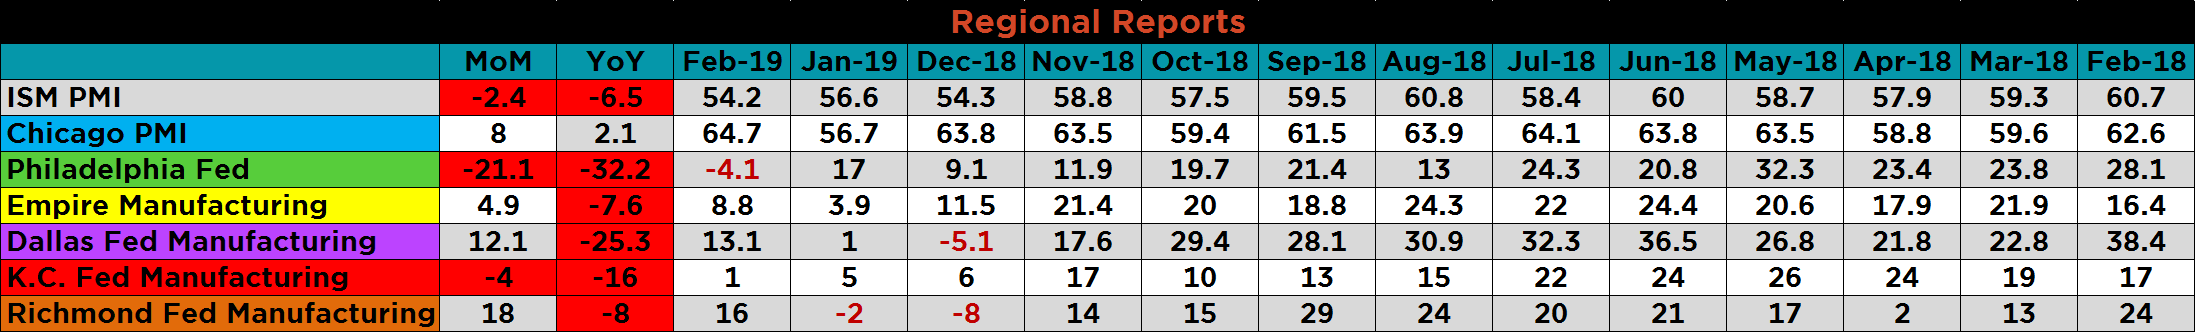
The table below shows the monthly ISM and regional PMIs back to February 2018. While the seven indexes show conflicting monthly data, the Chicago Fed PMI is the only one with a YoY increase. Most strikingly, the Philadelphia Fed printed down 21.1 MoM and 32.2 YoY; this is its first negative print since May 2016. The Dallas and K.C. Fed reports fell significantly YoY confirming the weakness in the energy industry following the sharp drop in the price of WTI crude oil at the end of 2018.
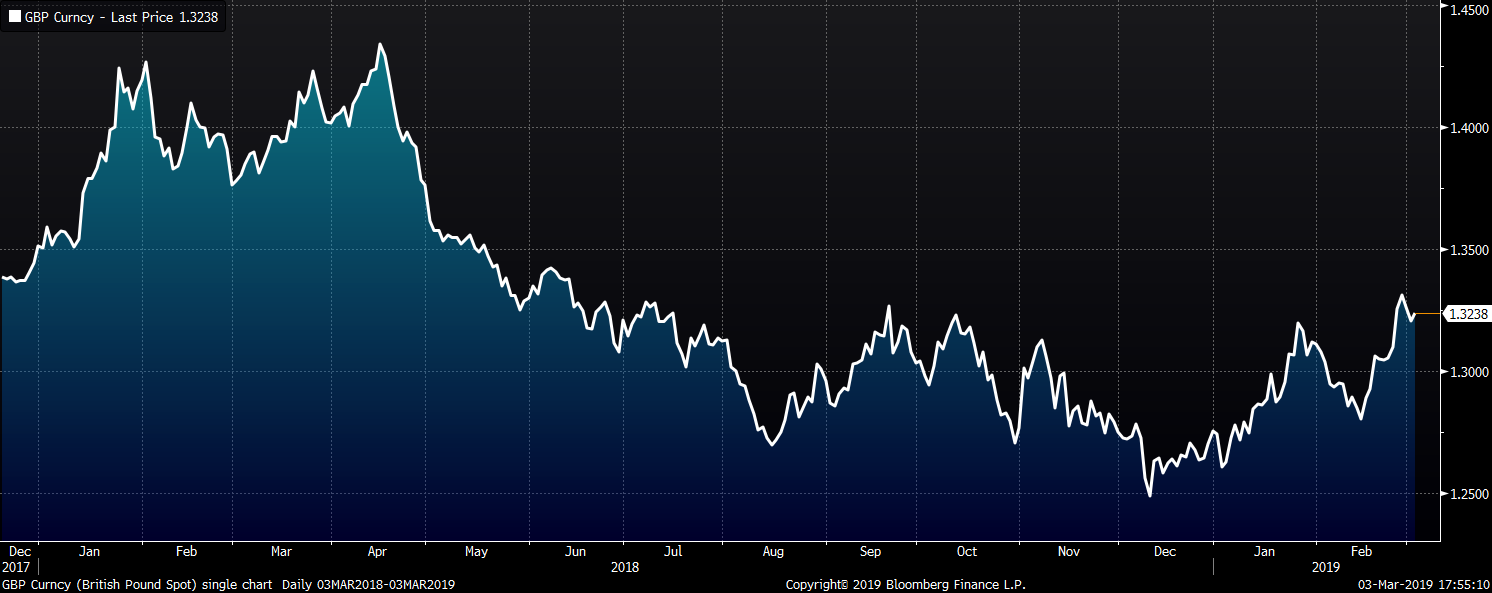
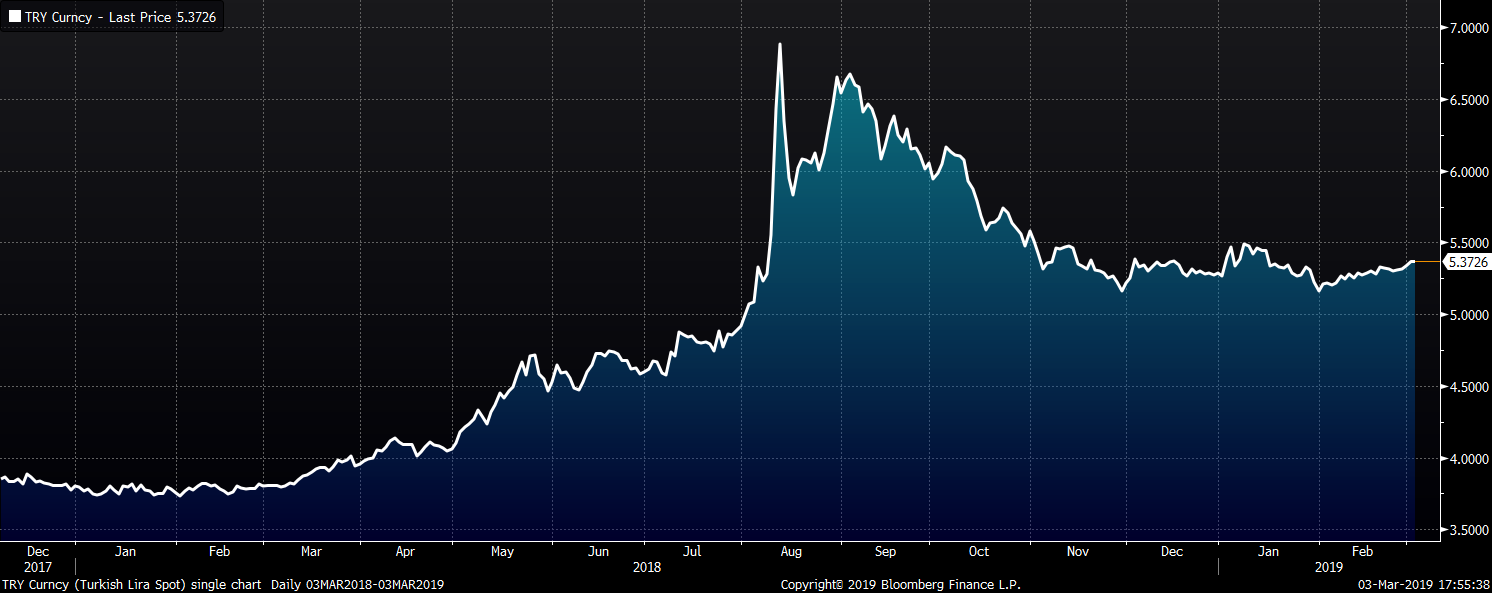
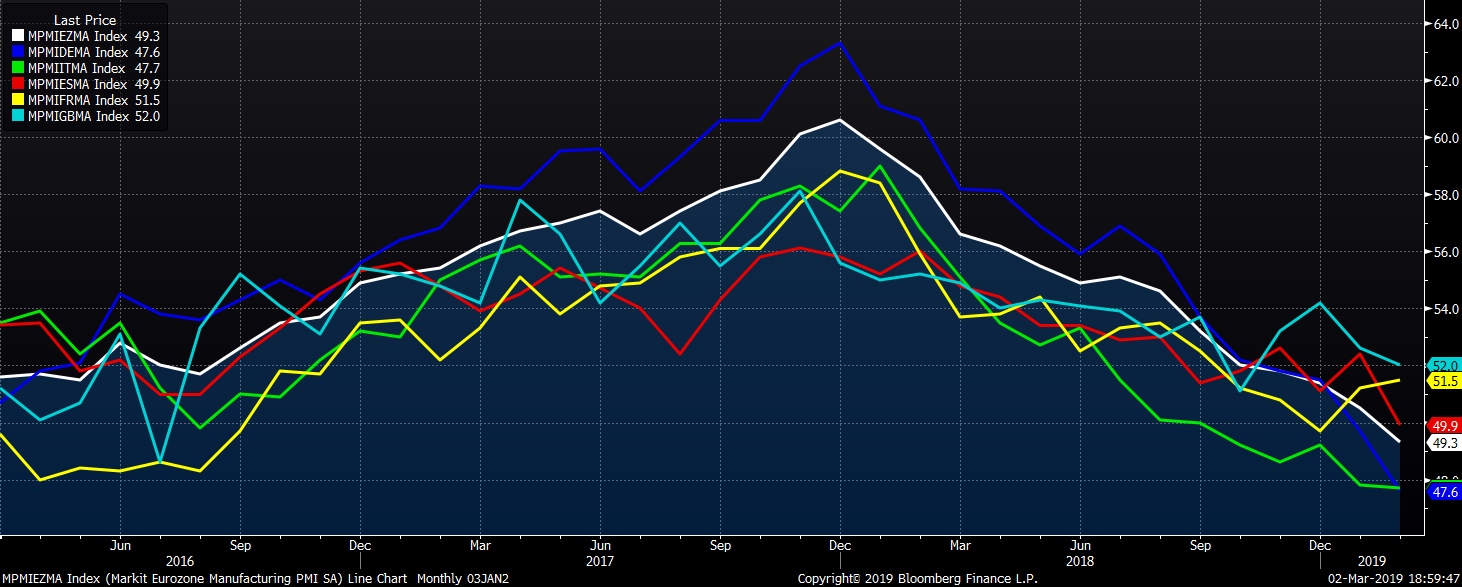
The February global purchasing manager indexes indicate that the global manufacturing industry continues to get worse. Eight countries and the Eurozone saw their February manufacturing PMIs below fifty indicating contraction. This group includes the Eurozone, Germany, Spain, Italy, China, Japan, South Korea, Taiwan and Turkey.
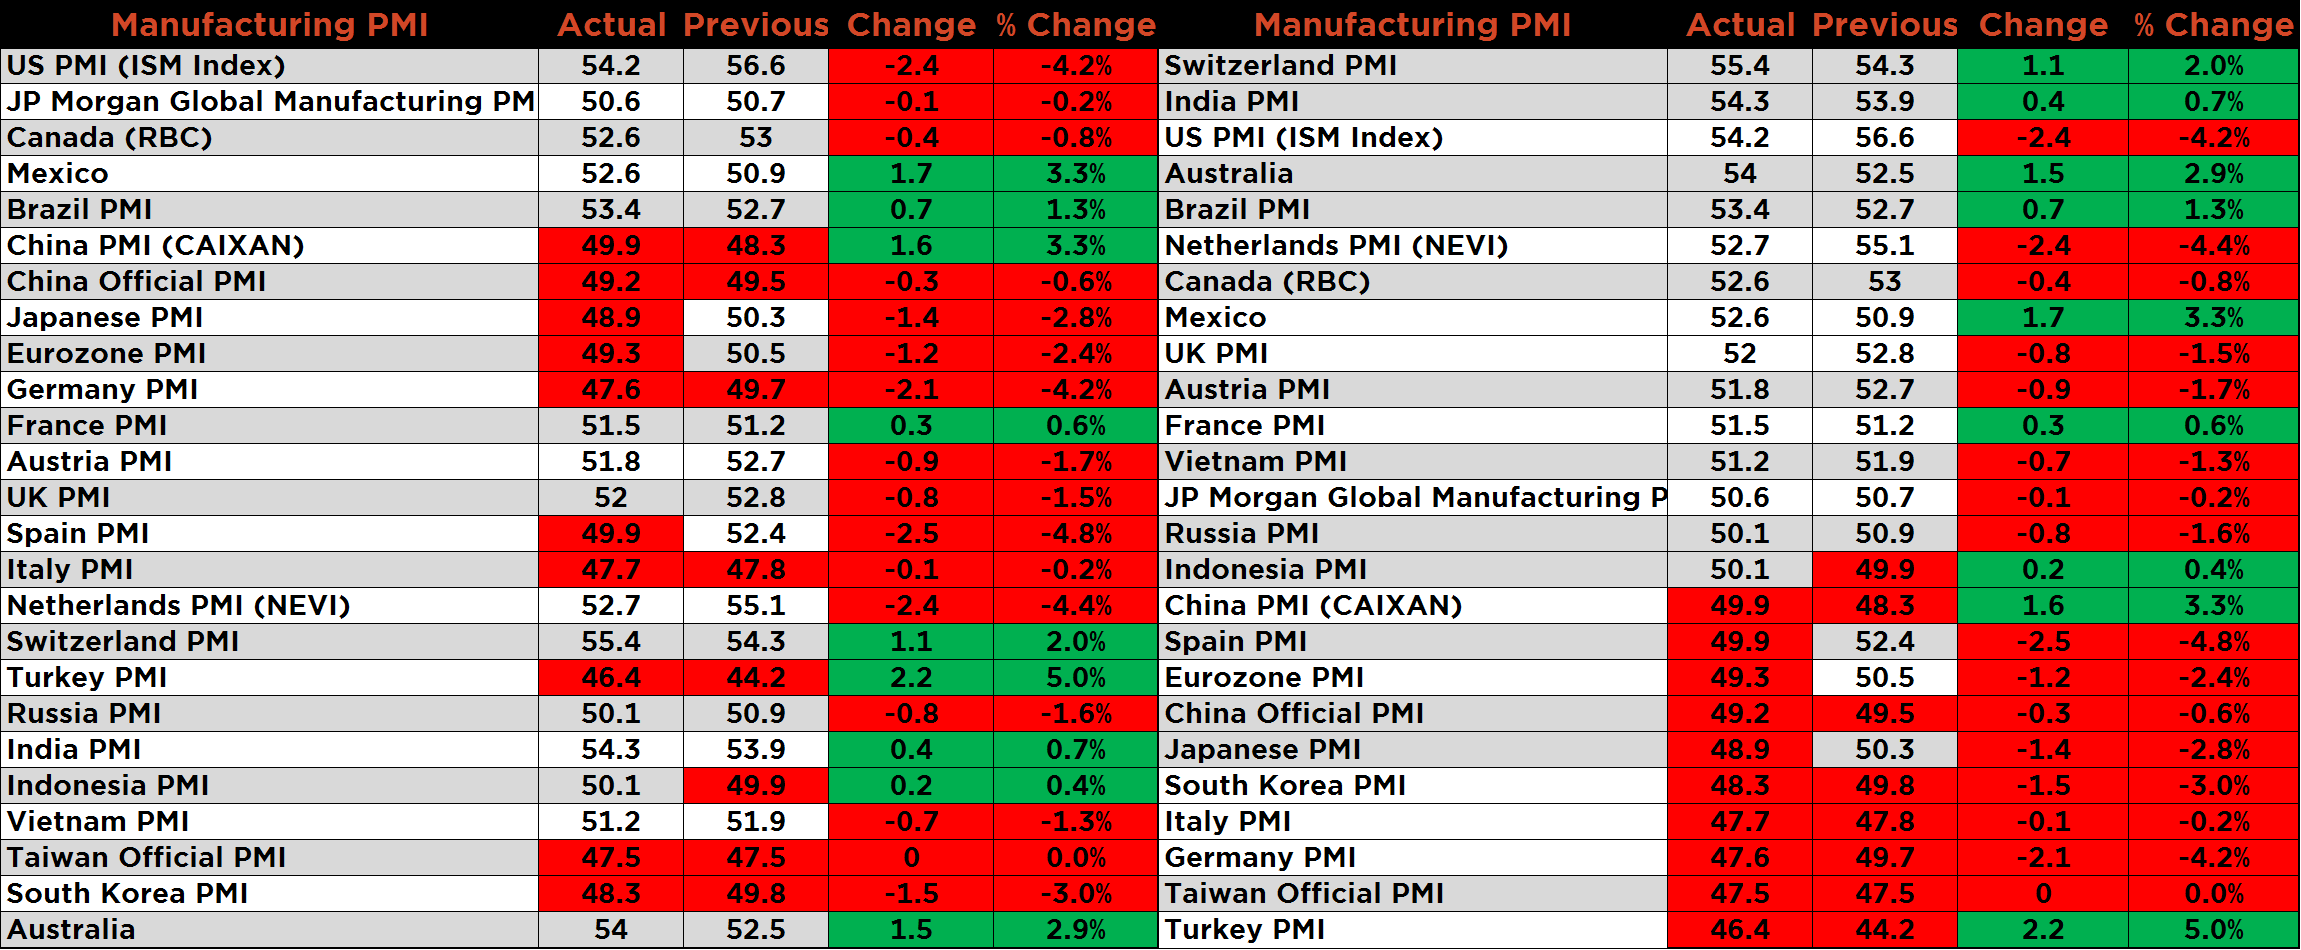
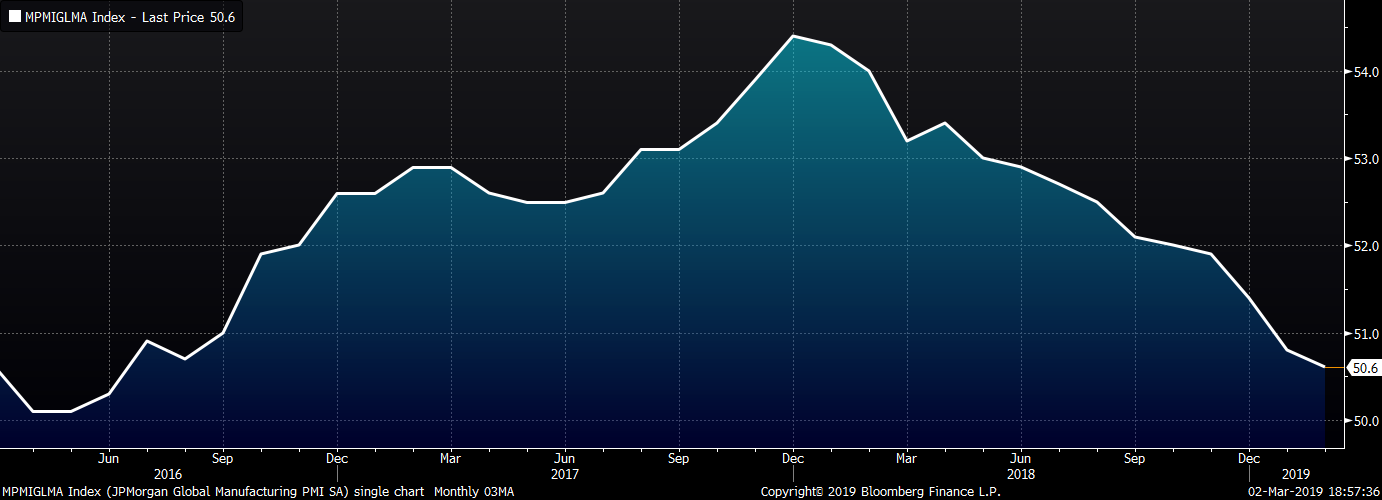
The JP Morgan Global Manufacturing PMI continued to decline falling 0.1 points to 50.6, its lowest level since August 2016.
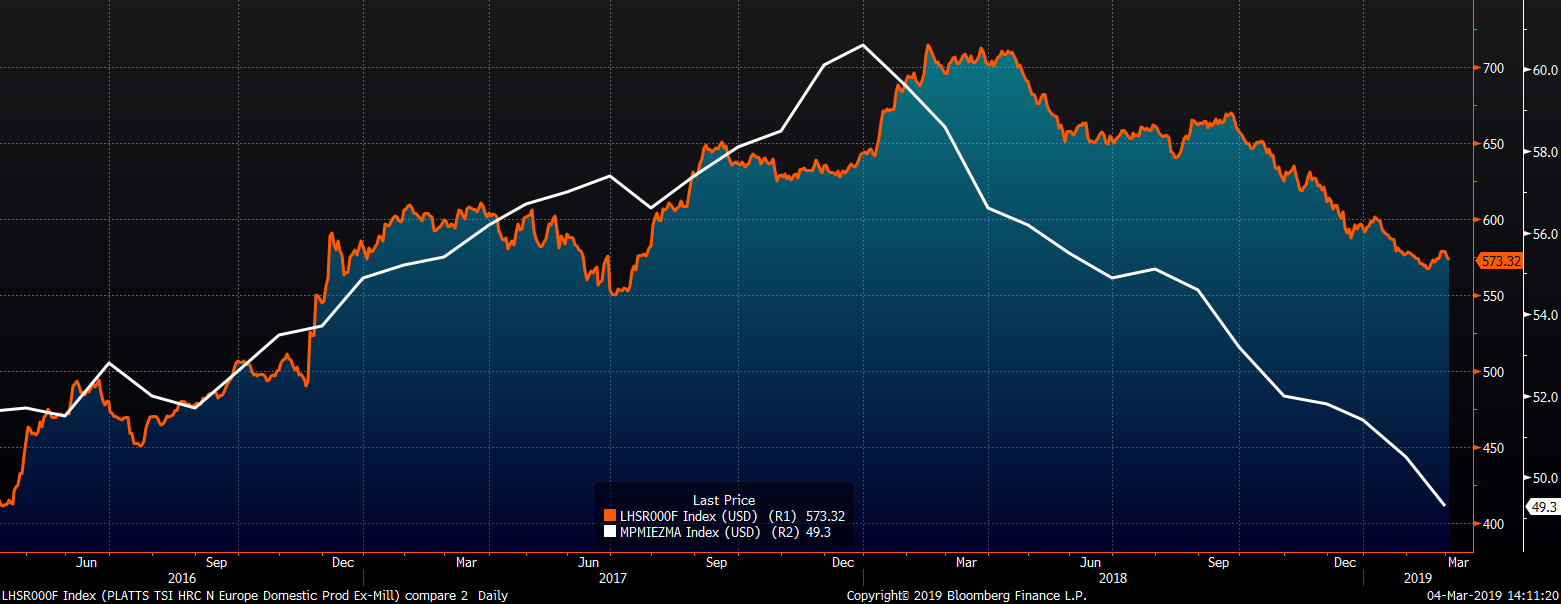
The chart below shows the Eurozone PMI and the TSI North European HRC Index. While the Eurozone’s PMI continues to deepen its long-term downtrend, North European HRC prices have fallen, but at a slower pace, likely due to European safeguard measures.
The PMIs of Europe, Japan, China and the U.S. all moved lower. The U.S. is the only country printing in expansion.
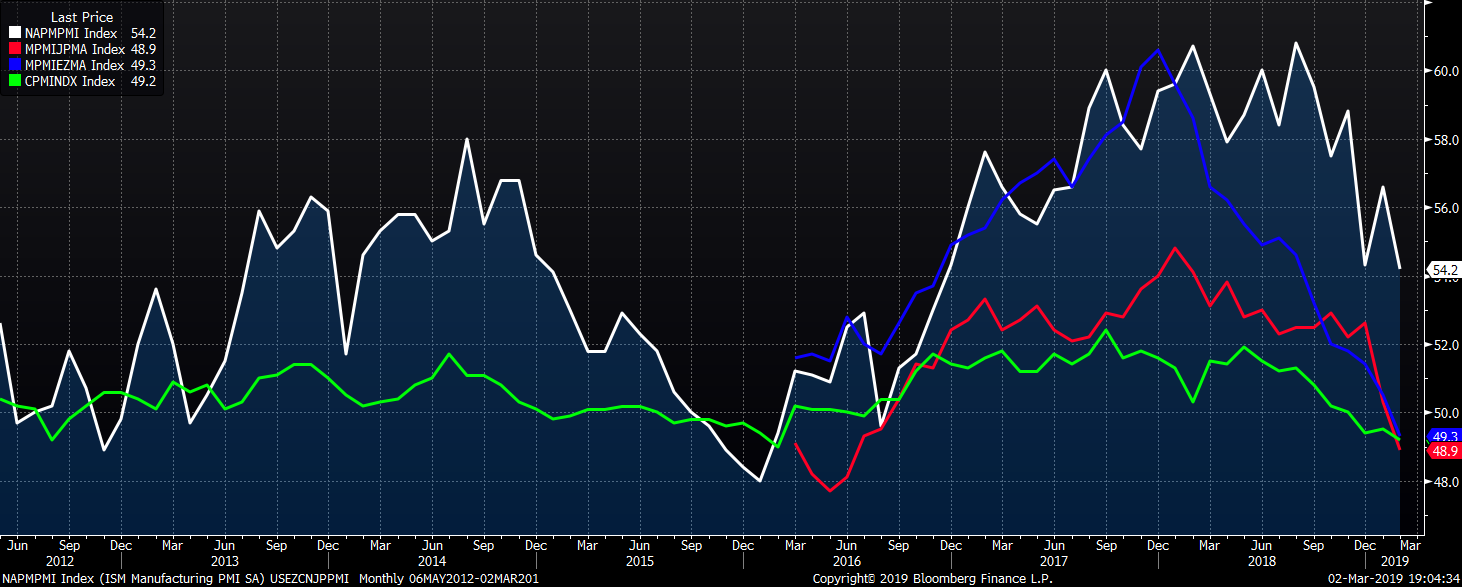
Despite the sharp increase in the Caixan Manufacturing PMI, both PMIs remain below 50 in contraction territory. China’s Official Manufacturing PMI is at its lowest level since February 2016.
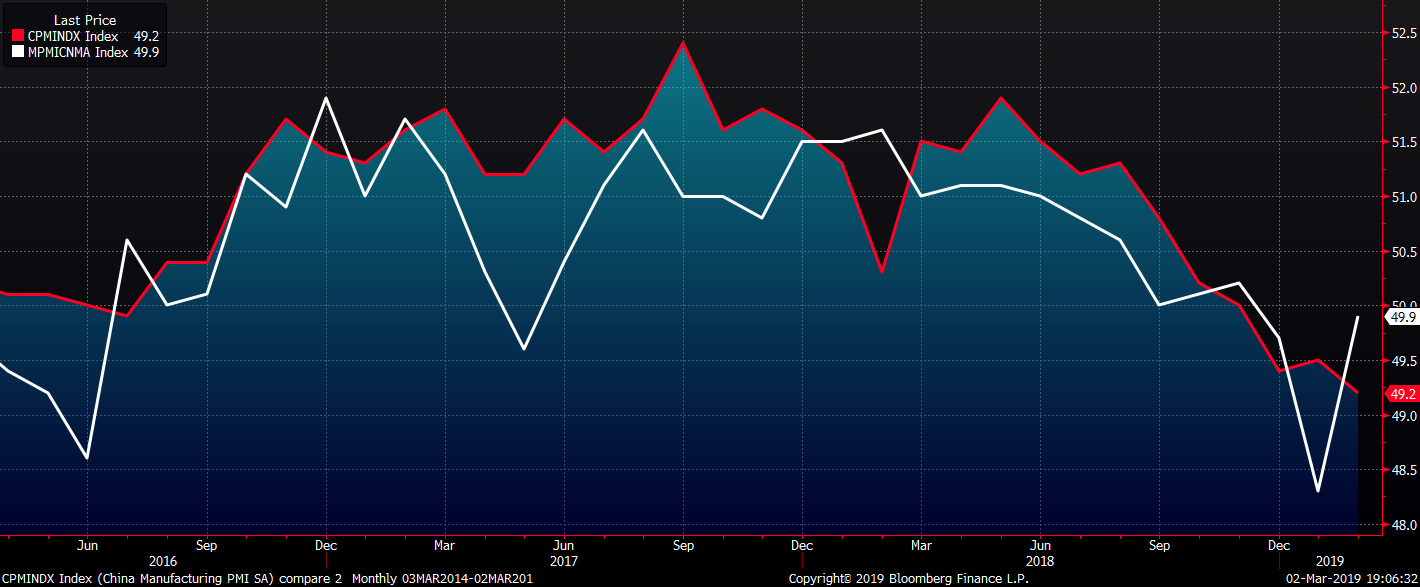
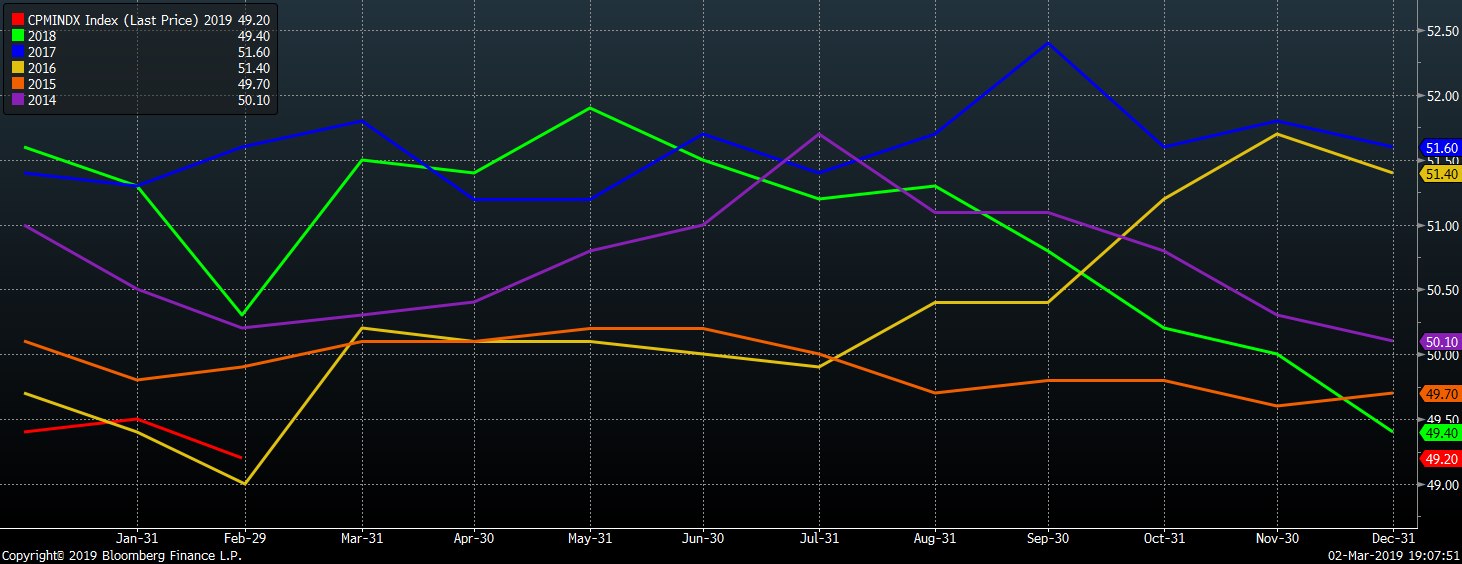
China’s official PMI printed at the second lowest February level of the last six years.
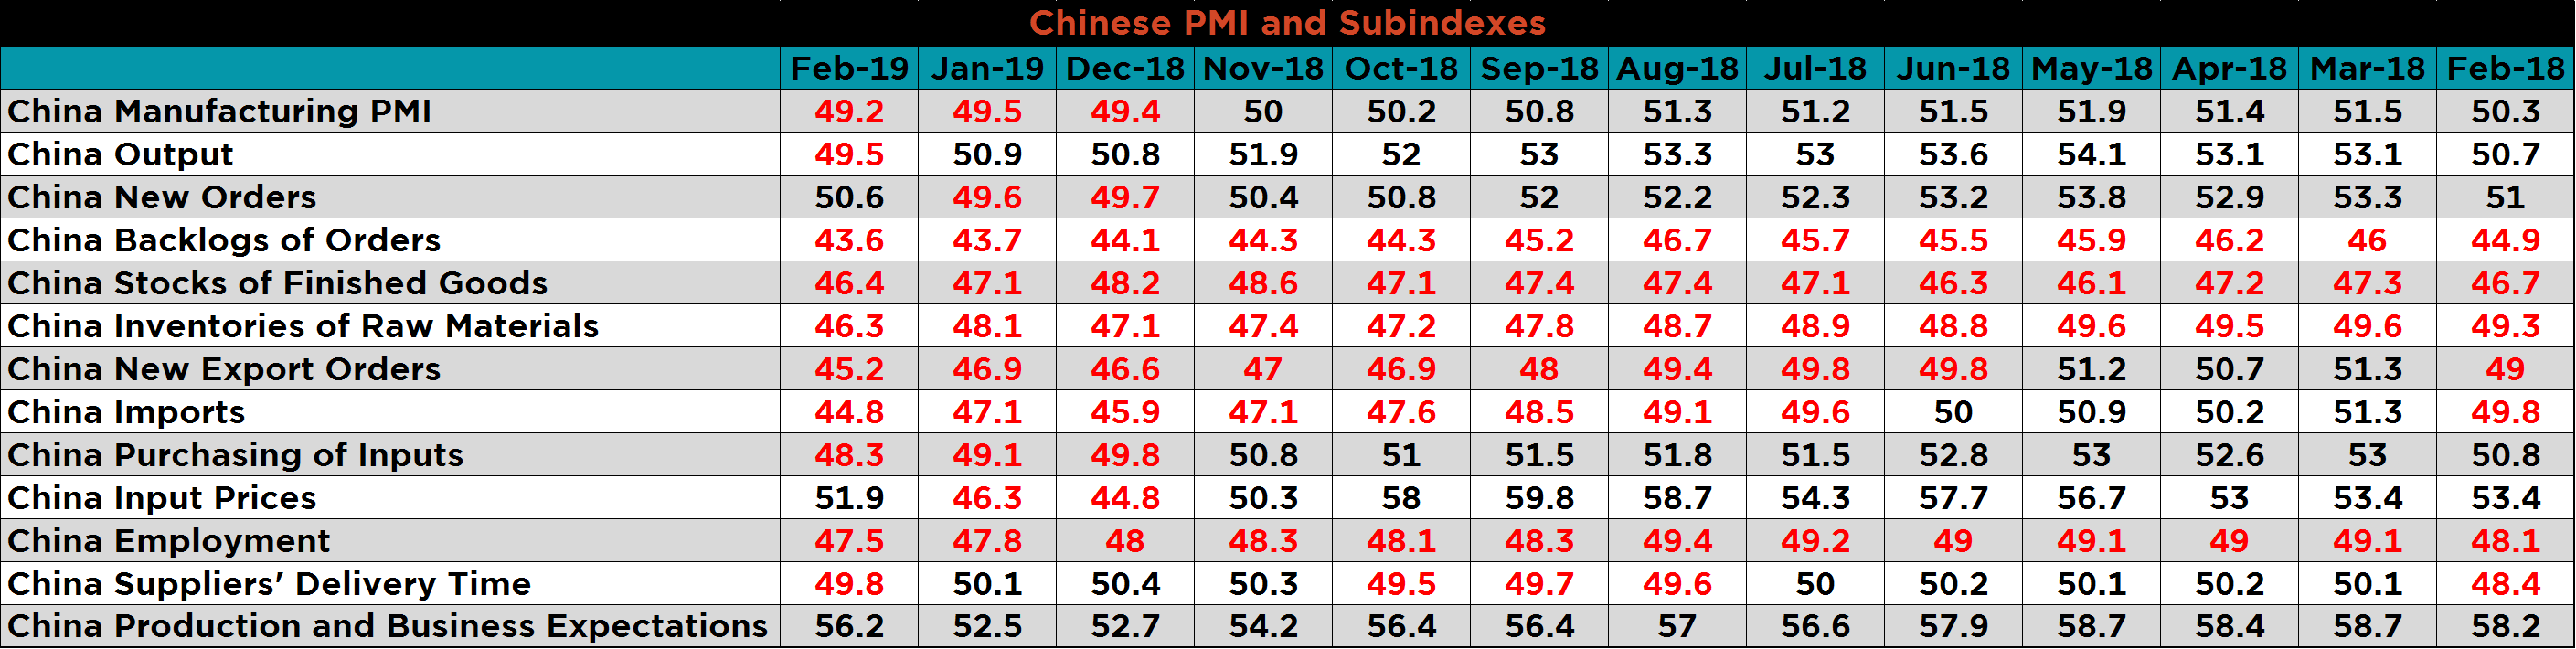
The table below breaks down China’s official manufacturing PMI subindexes. Ten of the thirteen subindexes are in contraction, but the new orders subindex rose back above 50 and the business expectations subindex gained sharply perhaps indicating government stimulus will improve conditions in coming months.
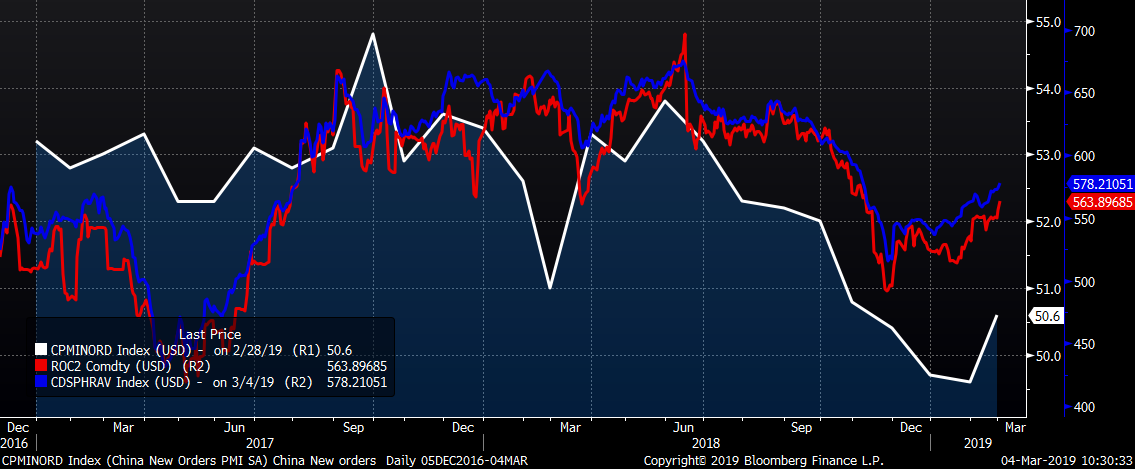
China’s new orders subindex rose into expansion while Chinese HRC futures and the Chinese HRC spot price have continued to rally.
The final December Durable Goods Report showed that new orders for durable goods were mostly higher YoY.
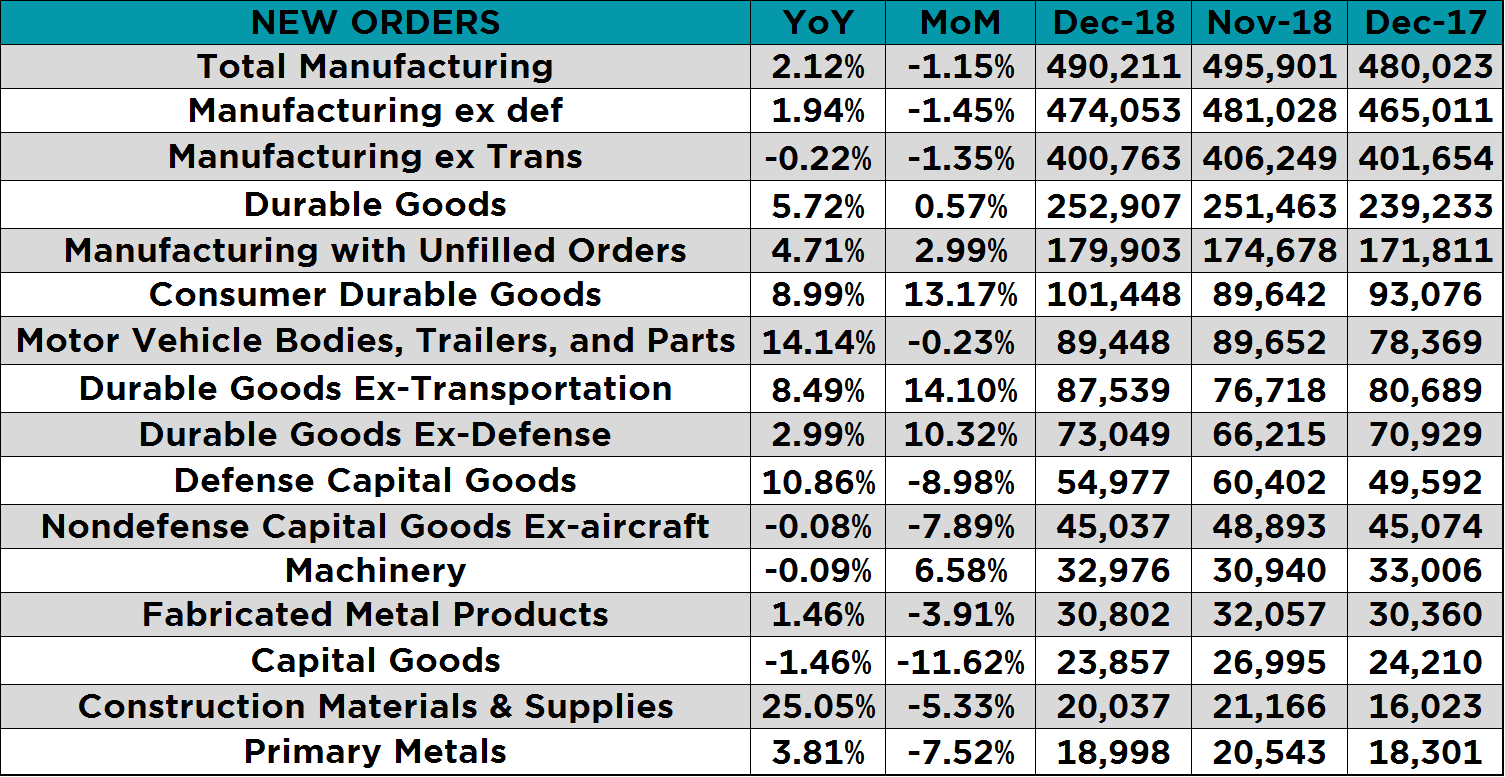
This correlates well with the uptick we saw in January’s ISM new orders subindes, however the subindex moved back down to 55.5 in the most recent report. Demand looks to be trending lower and the data will likely make lower highs and lower lows in the coming months.
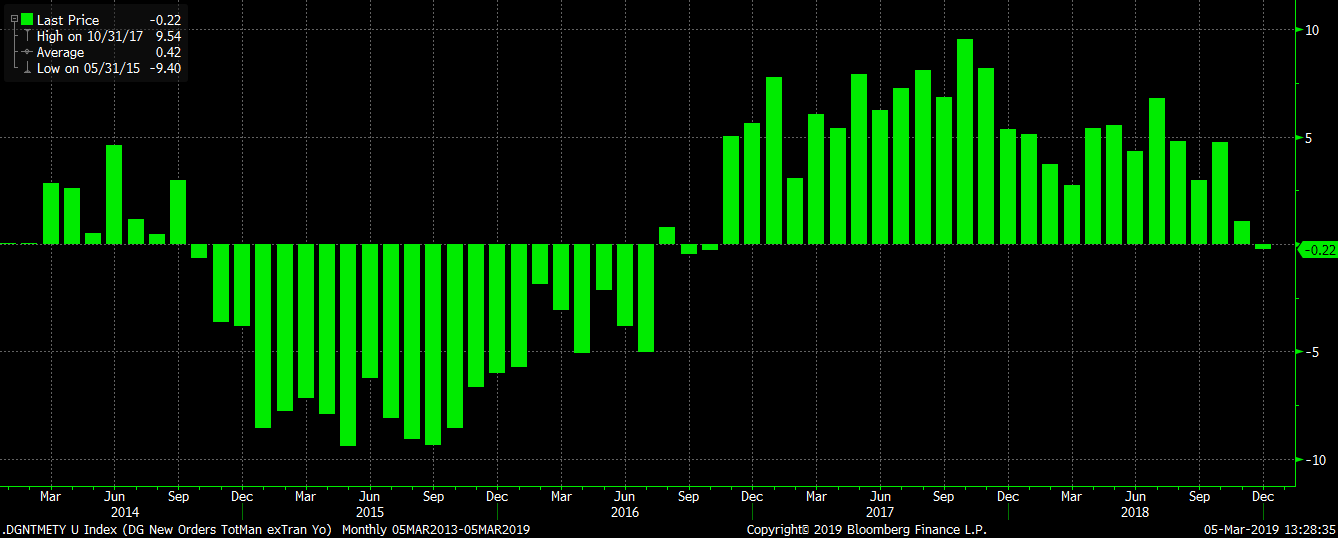
This chart shows the YoY percentage change in new orders for manufacturing ex-transportation. This chart does a better job showing the downtrend or slowing in growth.
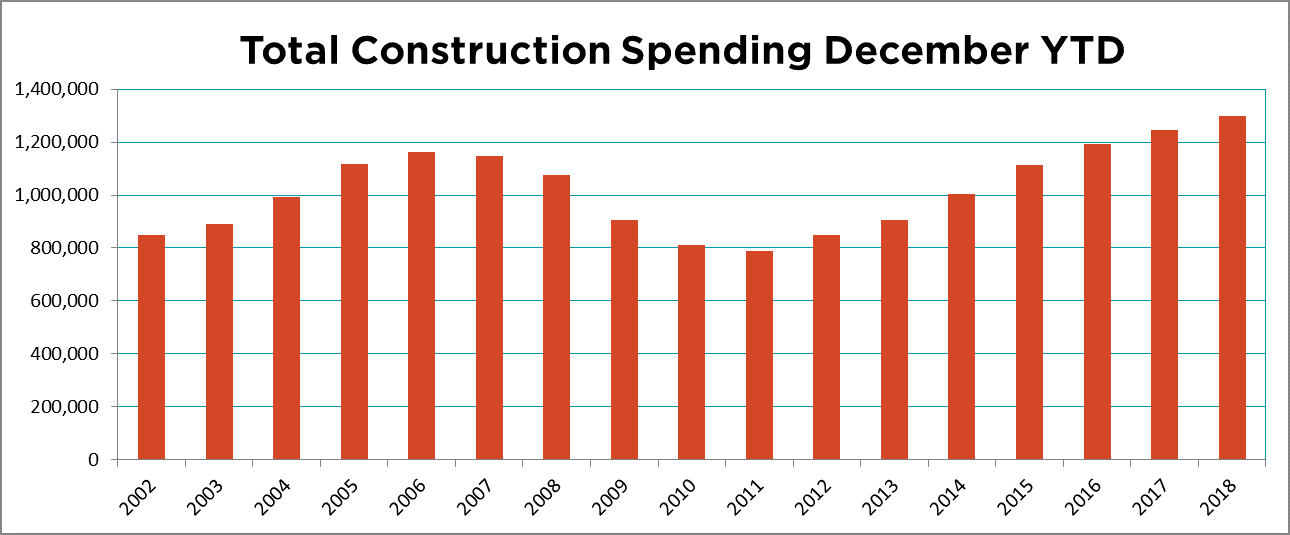
Seasonally adjusted December U.S. construction spending was down 0.6% MoM.
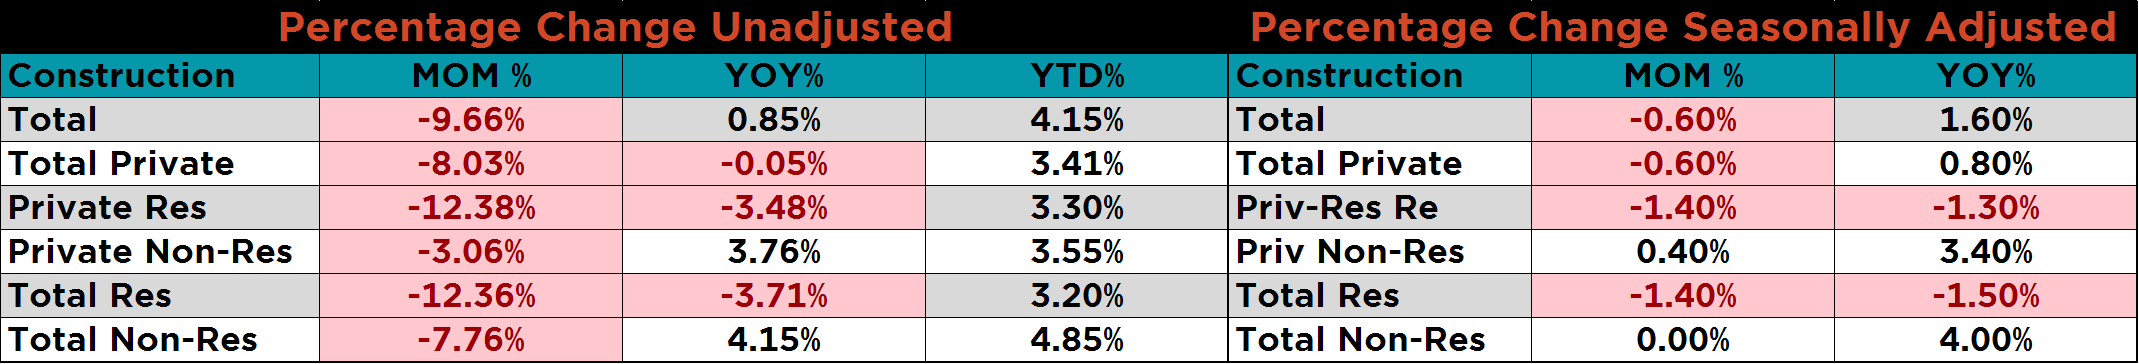
Unadjusted December total construction spending was 0.9% higher YoY while YTD spending gained 4.2% YoY.
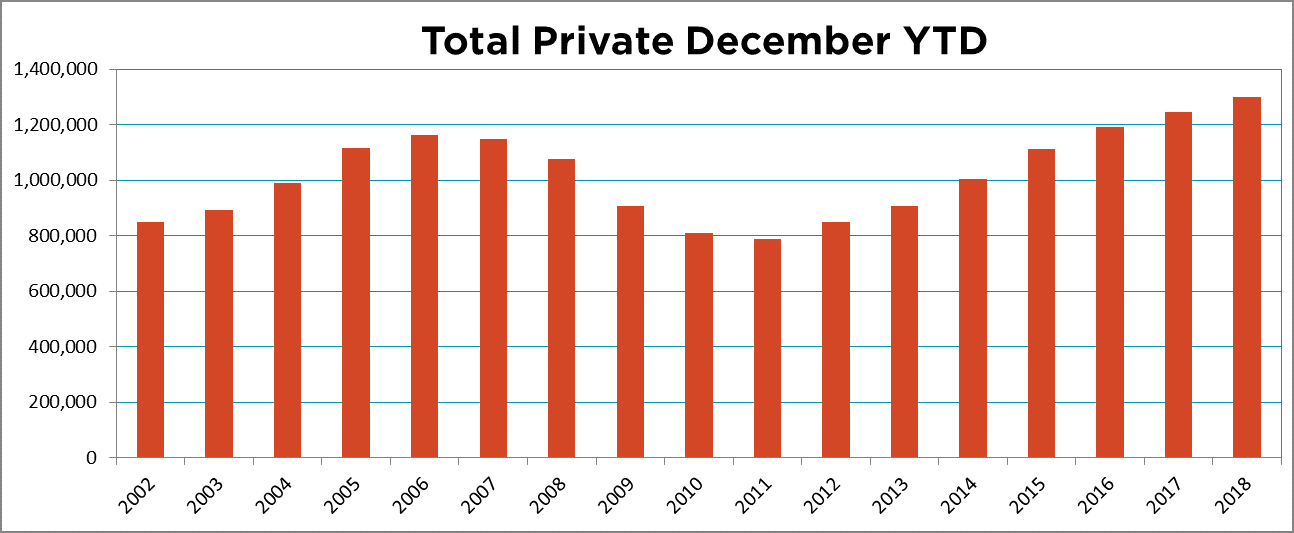
Unadjusted December total private construction spending was 0.1% lower YoY while YTD spending gained 3.4% YoY.
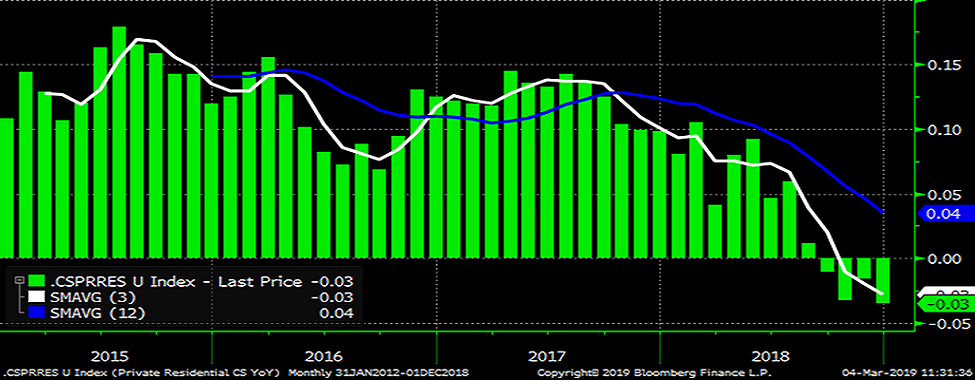
Unadjusted December private residential construction spending was down 3.5% YoY, while YTD spending gained 3.3% YoY.
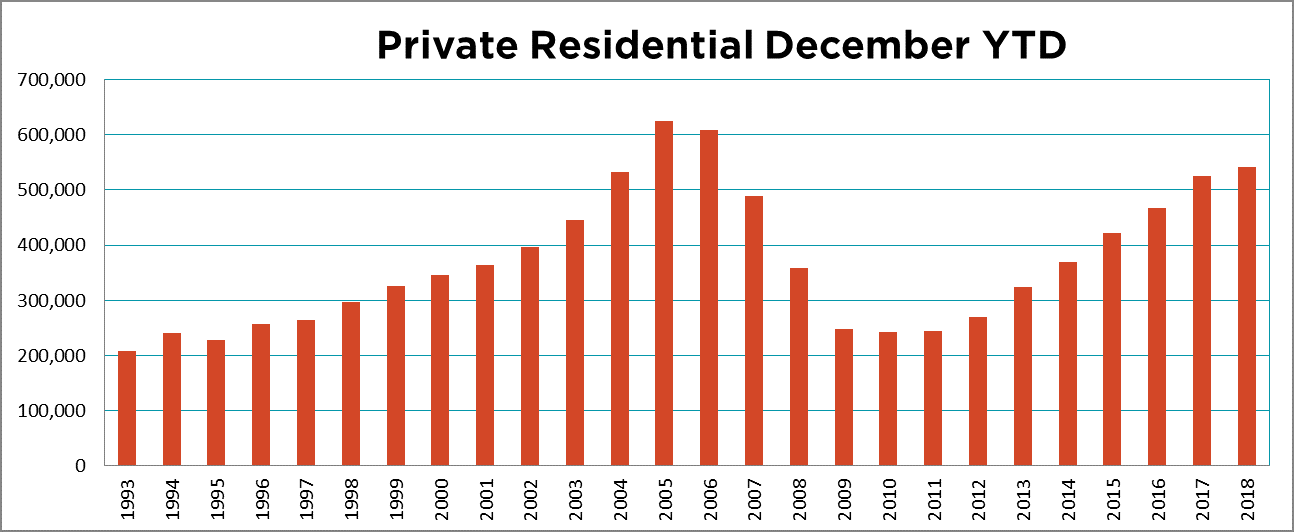
This seasonality chart shows the pattern of increased YoY spending in residential construction coming to an end.
This chart shows unadjusted private residential construction spending YoY percentage change falling into negative territory for the fourth straight month.
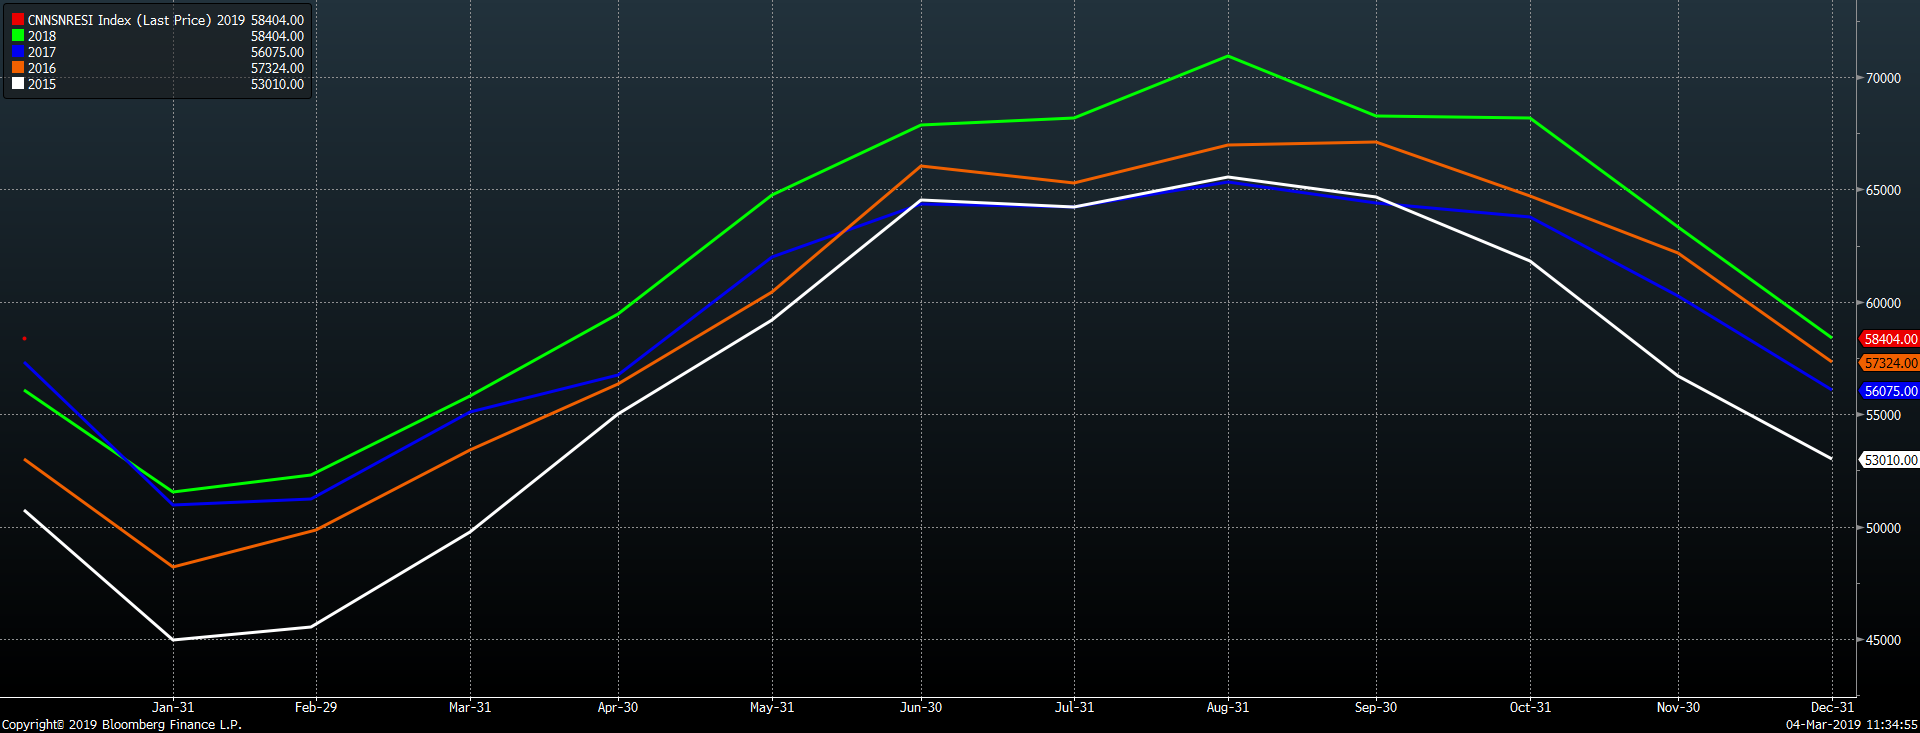
Unadjusted December private nonresidential construction spending was 3.8% higher YoY while YTD spending gained 3.6% YoY.
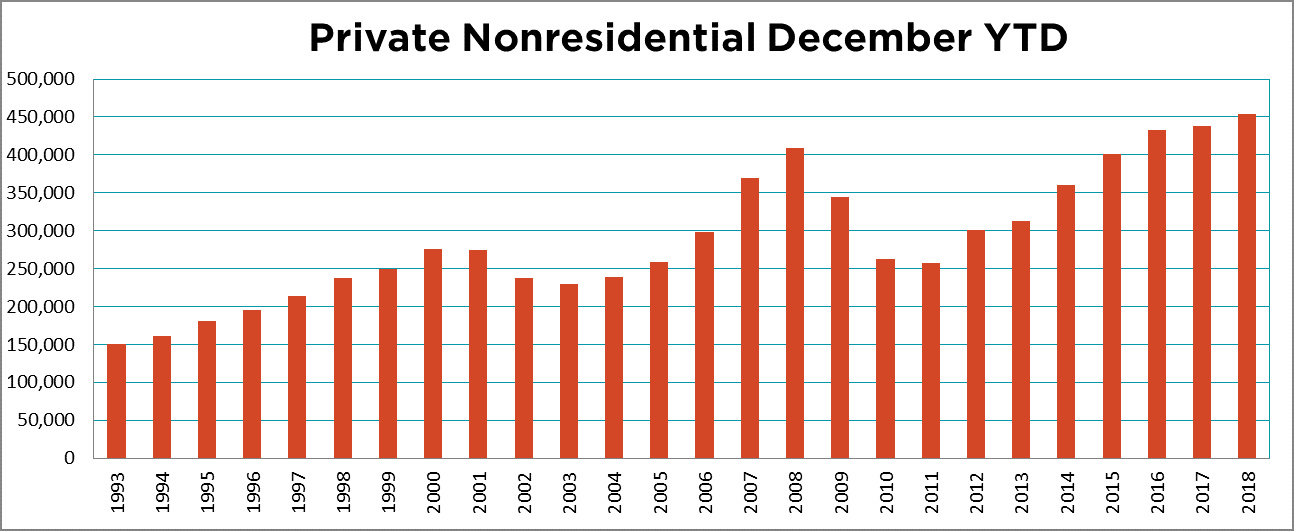
Unadjusted December U.S. construction spending remained higher YoY, but the gap is shrinking.
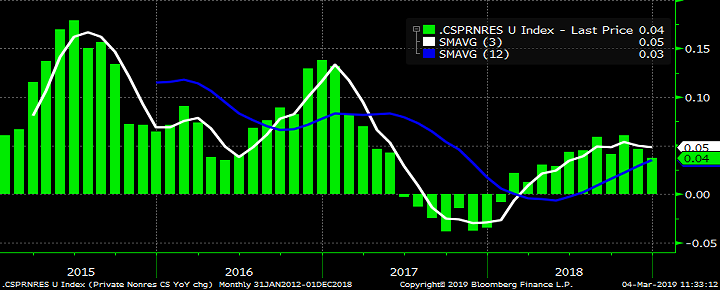
This chart shows U.S. nonresidential construction spending NSA YoY percentage change with the 3-month average approaching the twelve-month average.
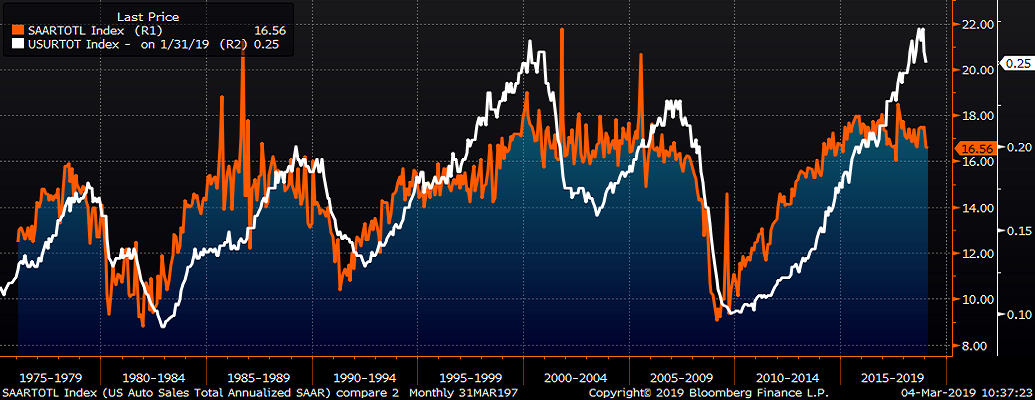
February U.S. light vehicle sales were down to a 16.56m seasonally adjusted annualized rate (S.A.A.R).
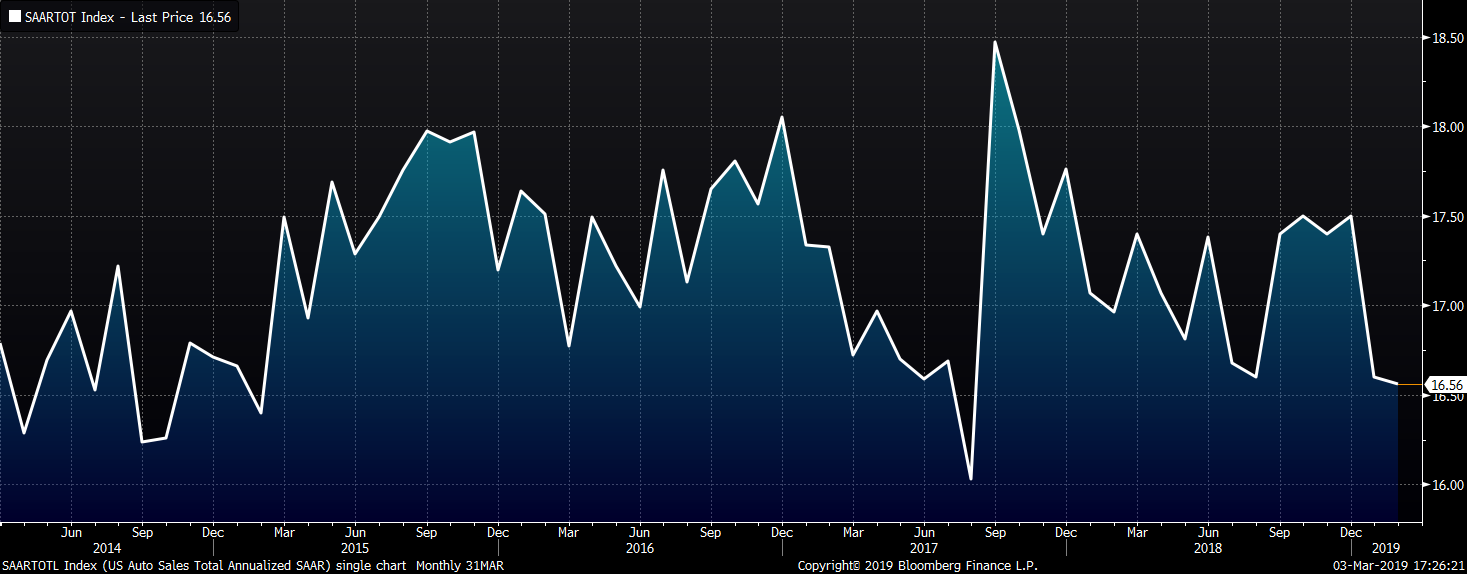
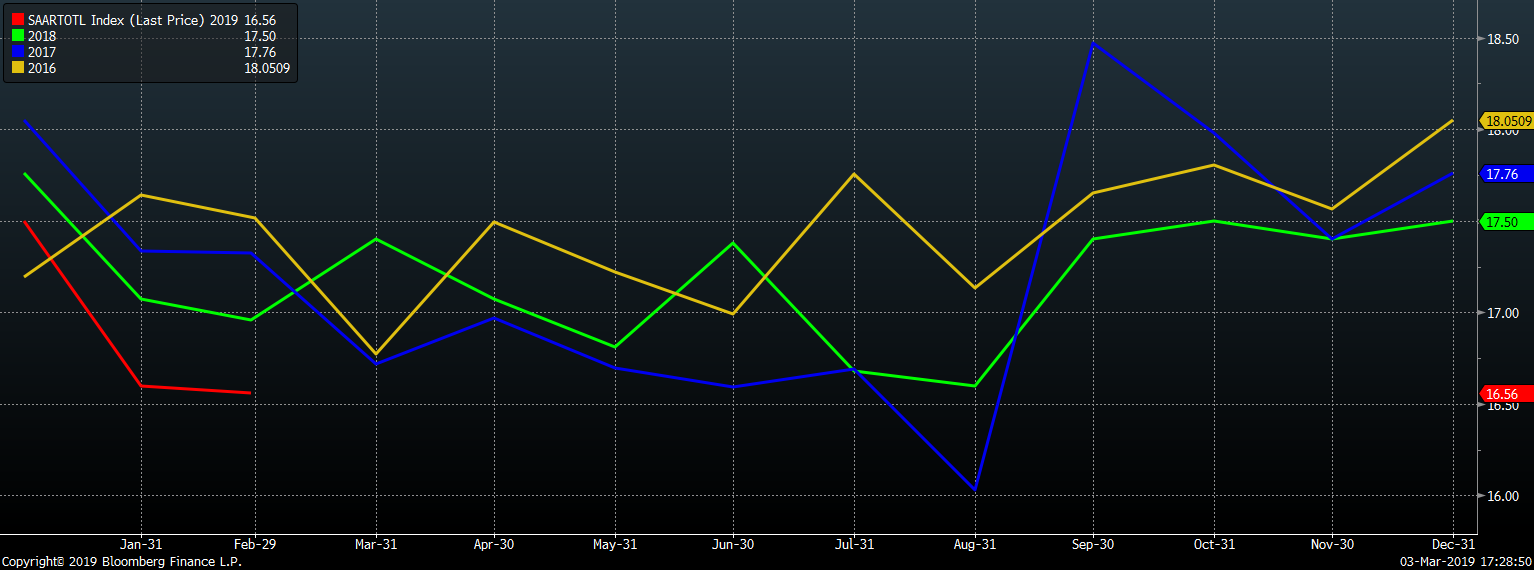
The February U.S. auto sales annualized rate remains at its lowest point in the last four years.
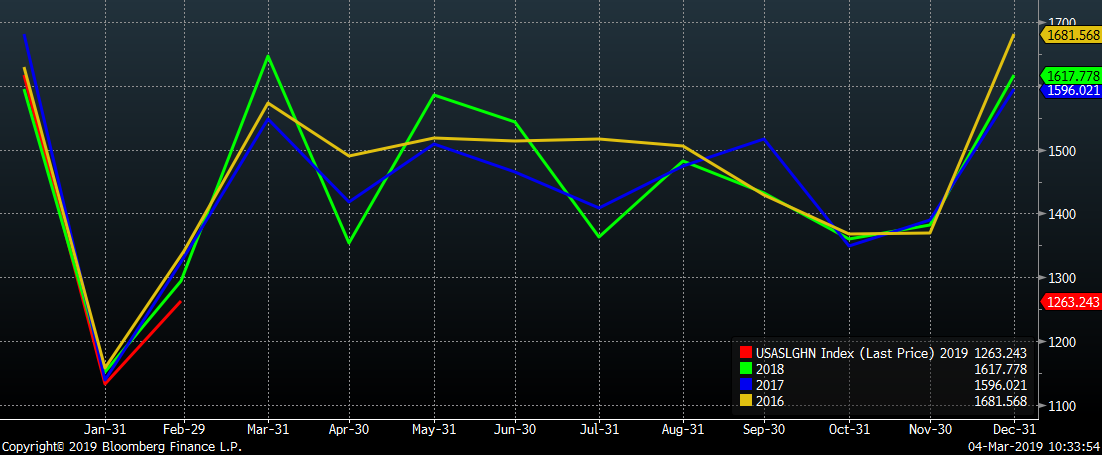
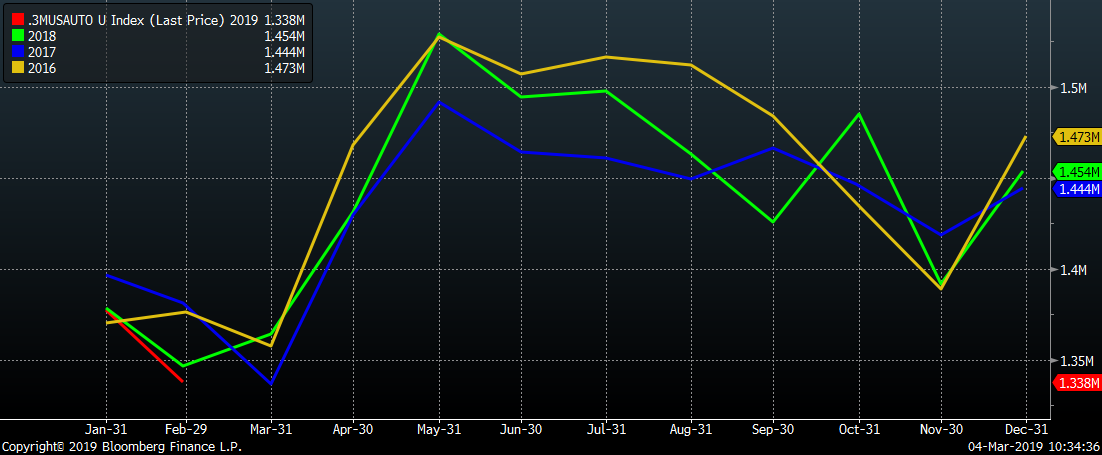
February unadjusted monthly auto sales rose to 1.26m units.
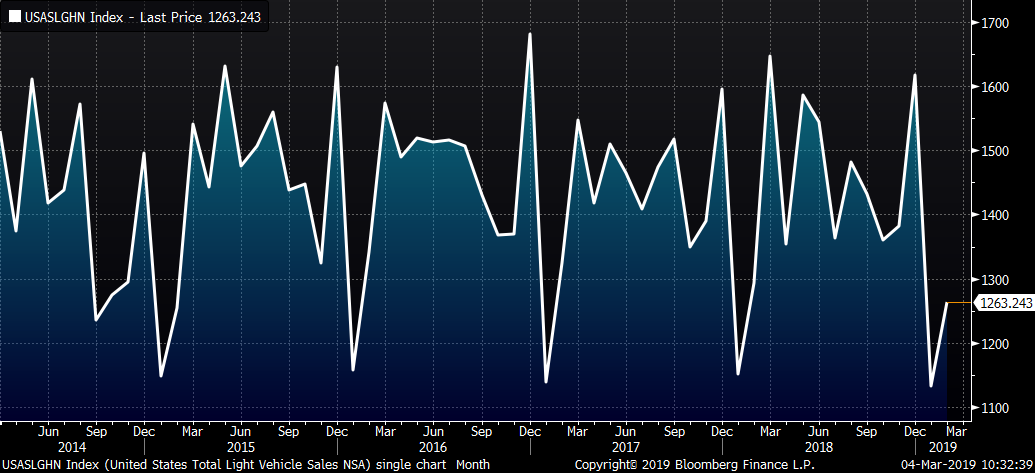
1.26m in light car and truck sales is at the lowest February level since February 2015.
The U.S. monthly auto sales three-month moving average continues to trend lower falling to the lowest the level since last March 2018.
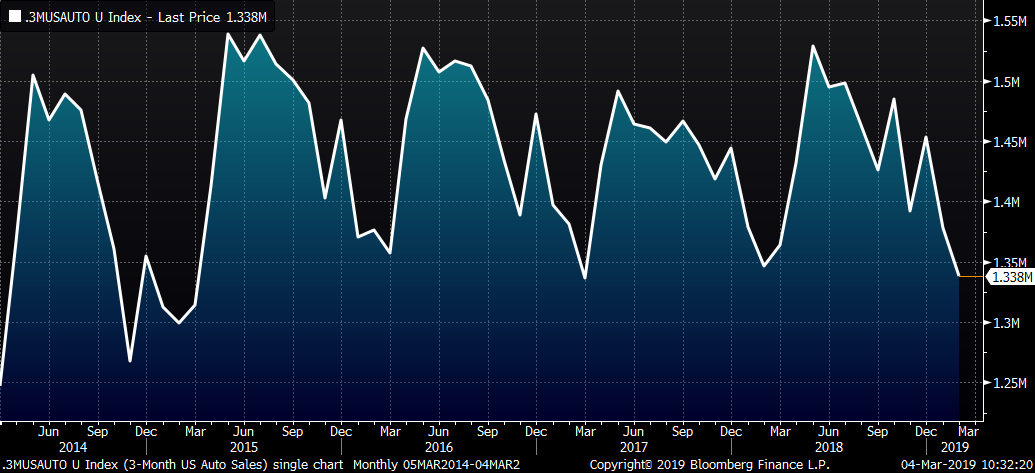
The U.S. monthly auto sales three-month moving average fell to the lowest February level since 2016 while approaching the four-year low from March 2017.
February annualized auto sales fell to 16.6m, while the U.S. unemployment rate rose to 4.0%.
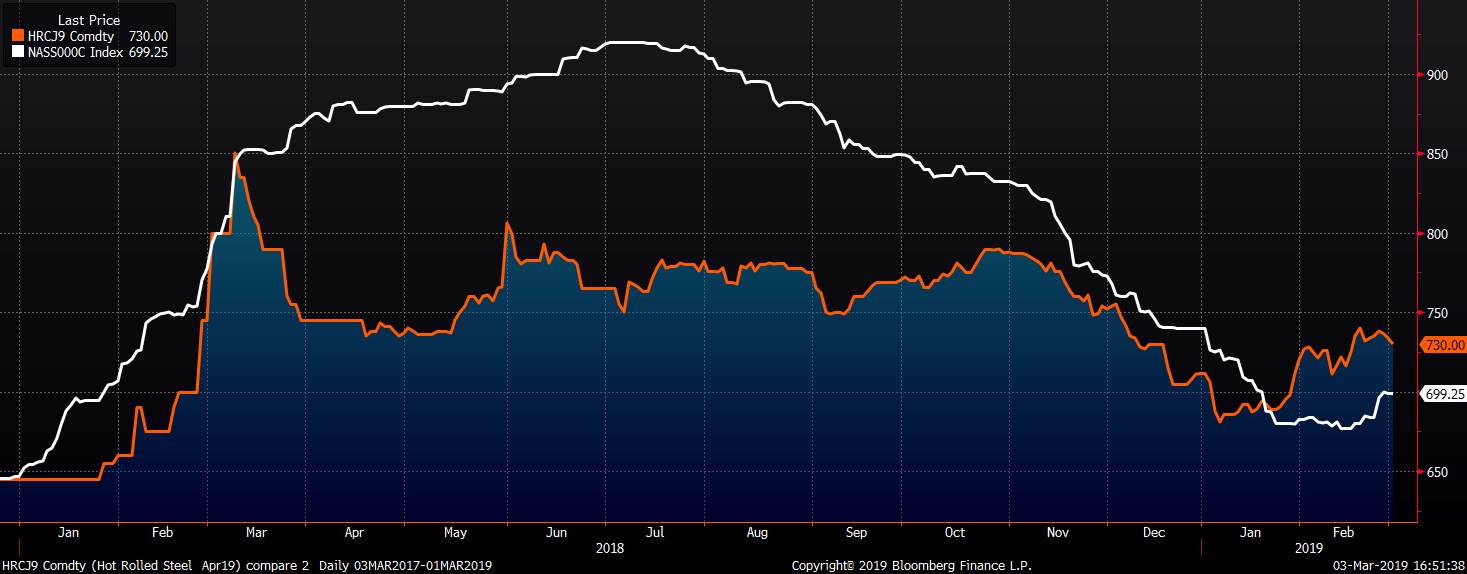
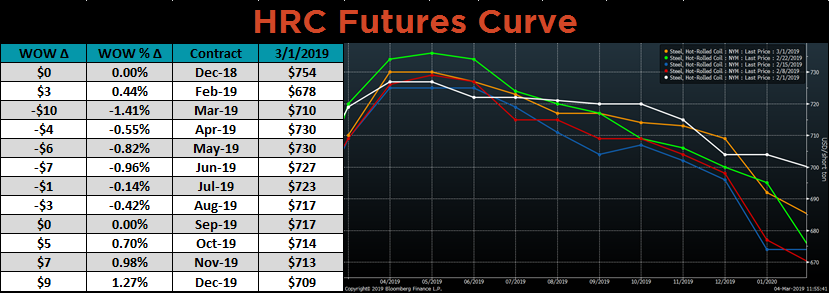
Week over week, the April CME Midwest HRC future lost $4 to $730 while the Platts TSI Daily Midwest HRC Index was up $15 to $699.25.
The CME Midwest HRC futures curve shown below with last Friday’s settlements in orange.
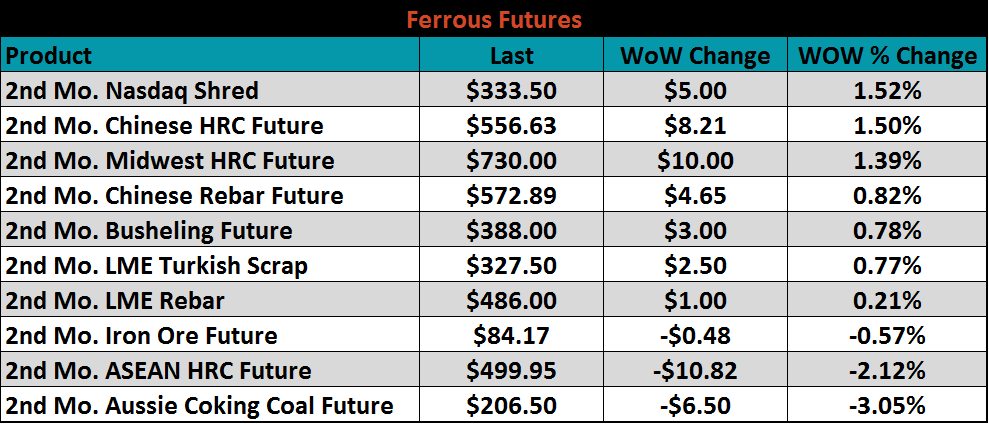
April ferrous futures were mixed. The coking coal future lost 3.1% and the ASEAN HRC future fell 2.1%..
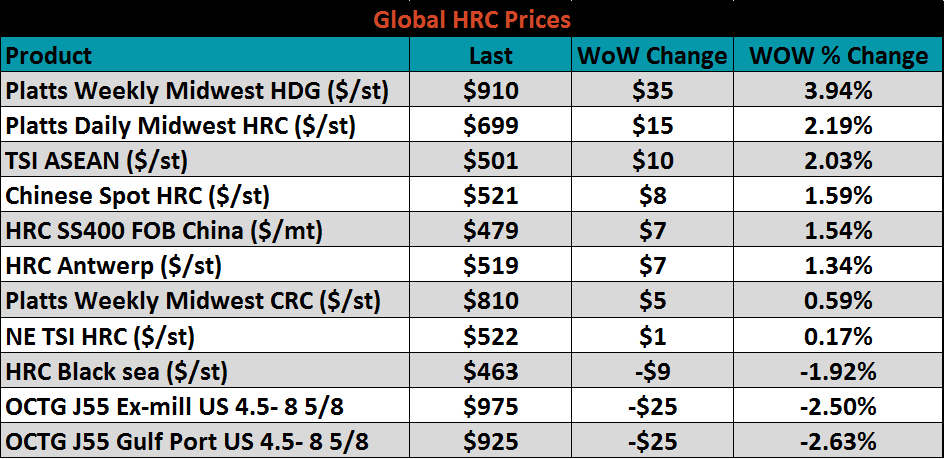
Flat rolled indexes were mixed. Platts Midwest HRC is up 4%, while U.S. OCTG prices were once again under pressure.
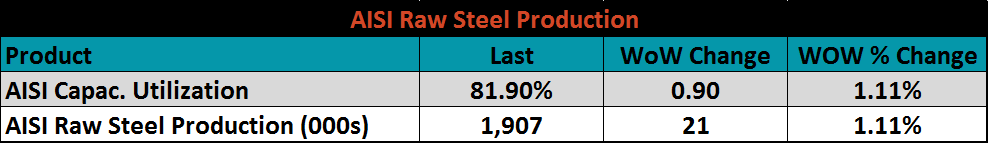
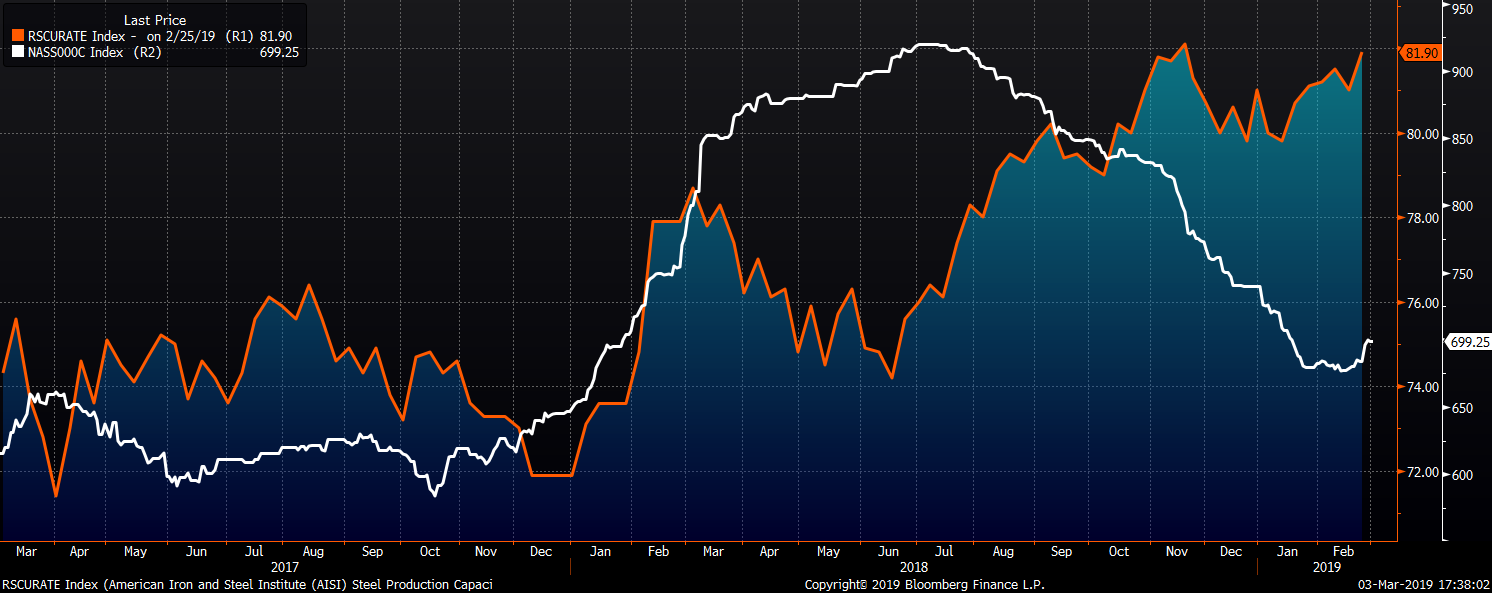
The AISI Capacity Utilization Rate increased to 81.9% continuing to produce above 80% despite slowing demand.
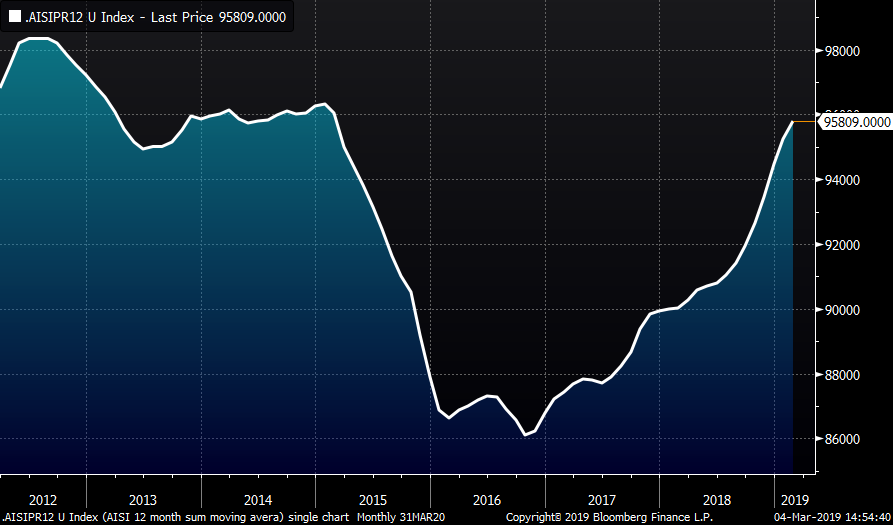
This chart shows the moving sum of the previous 52 weeks of AISI raw steel production showing an annualized production level moving back to the levels last seen in early 2015.
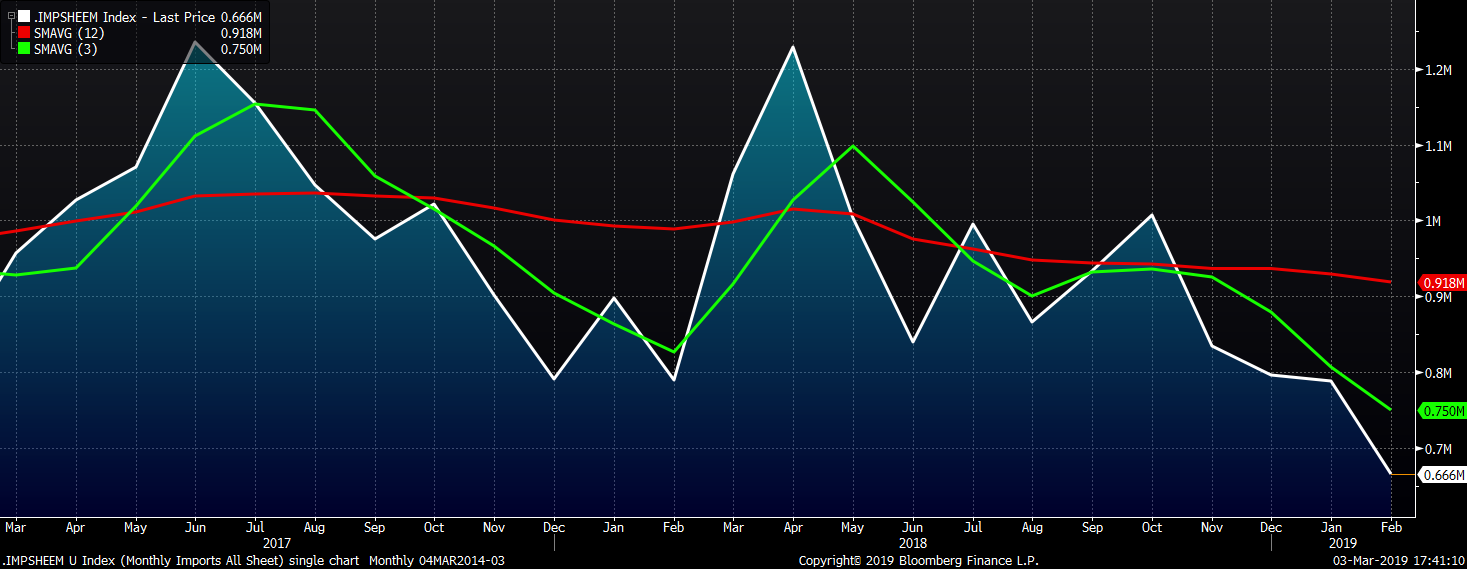
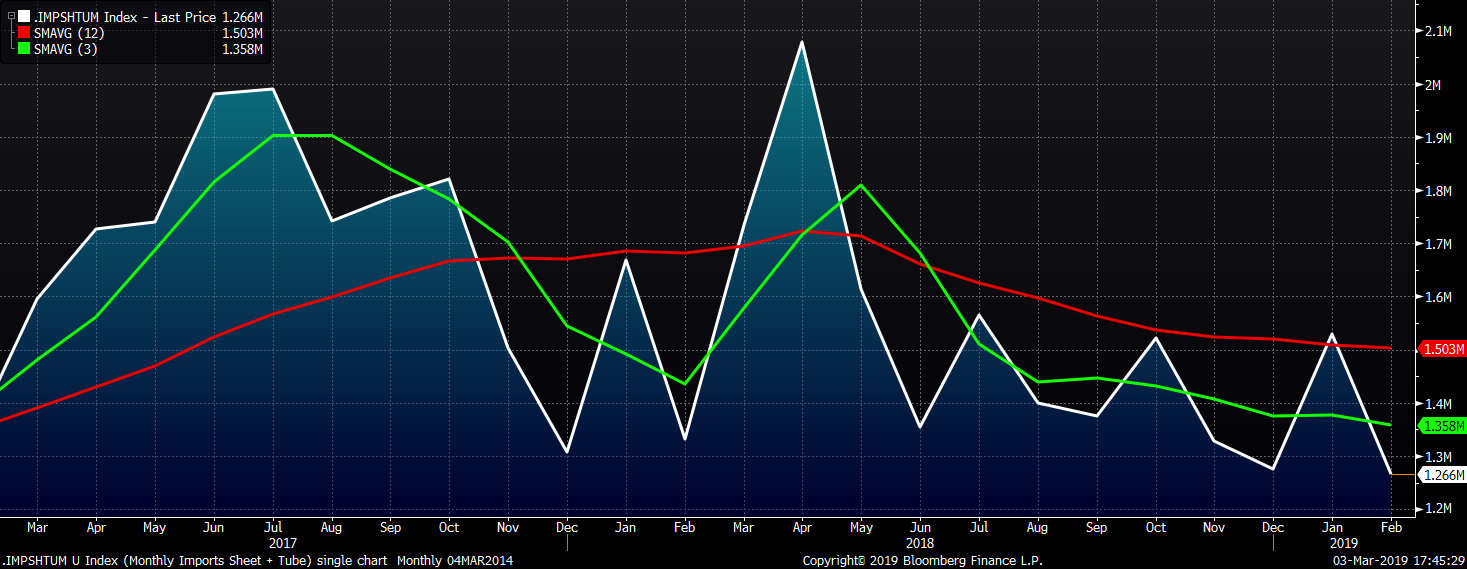
February flat rolled import licenses are forecast to fall 123k tons MoM to 666k while January flat rolled import licenses are forecast to fall 8k tons MoM to 789k.
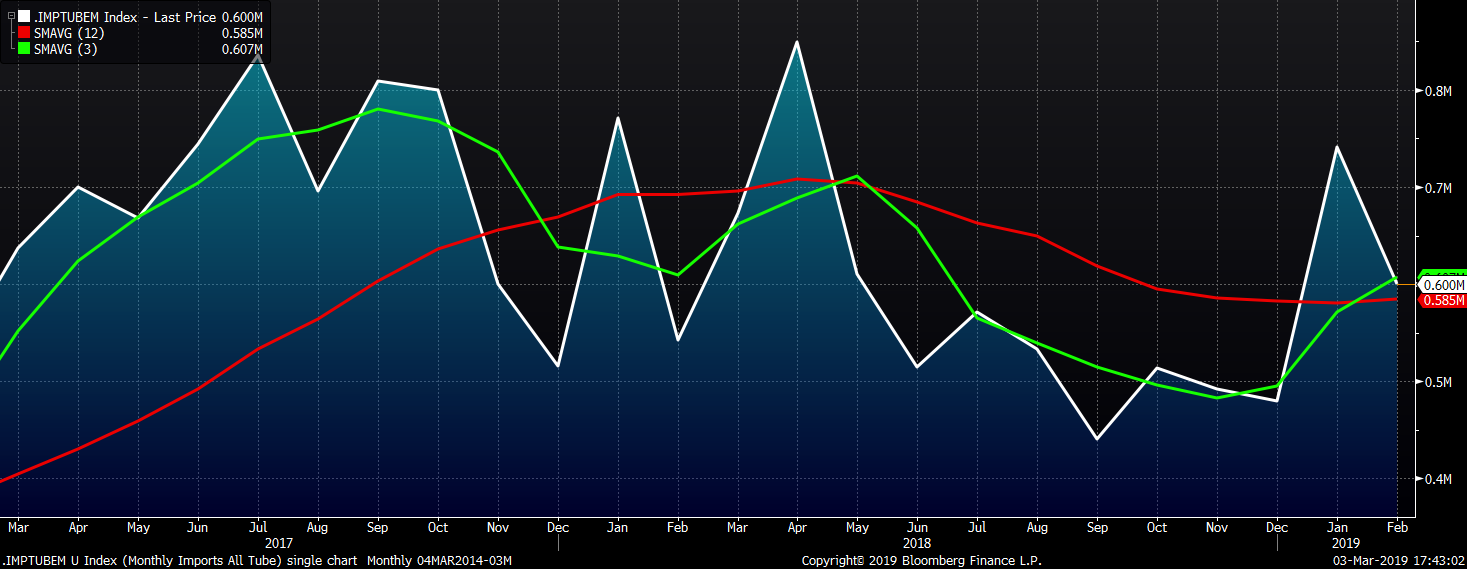
February tube import license data is forecasted to fall 141k to 600k tons MoM after a sharp rise in January.
The combined flat and tube import license forecast looks to fall 264k tons in February after a 249k MoM increase forecast in January due to a big increase in tubular products, much of which was imported from Korea.
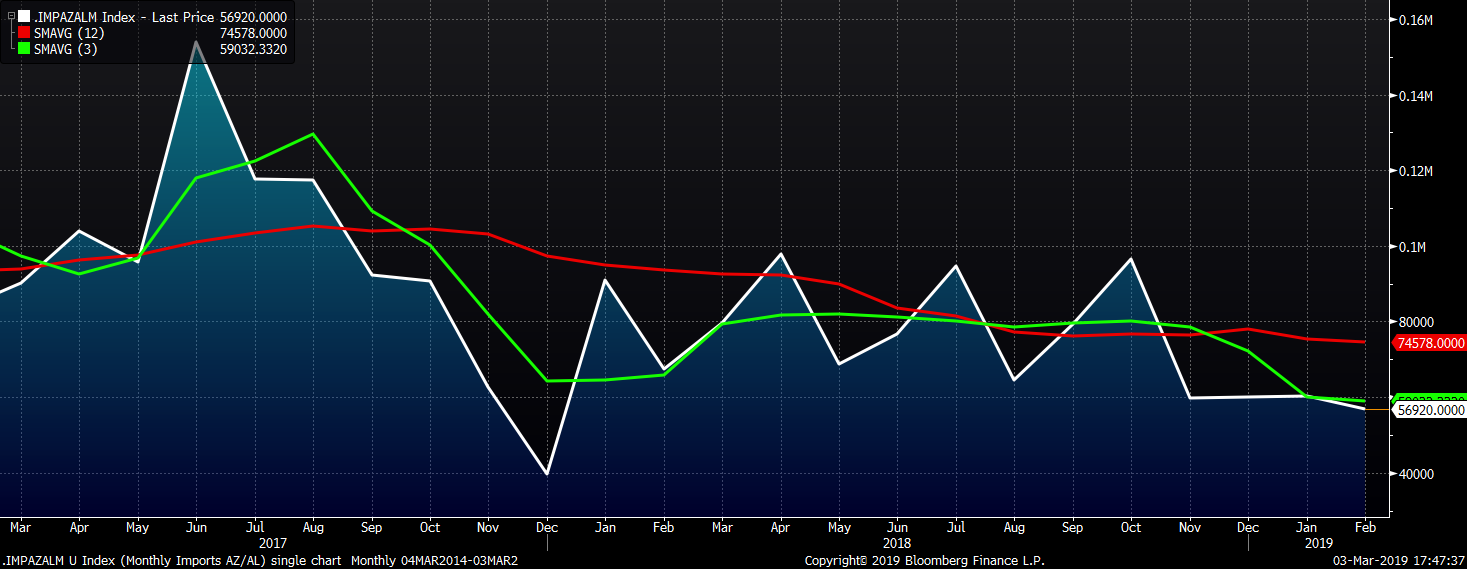
AZ/AL import licenses have become well entrenched around 60k with February licenses forecast at 57k.
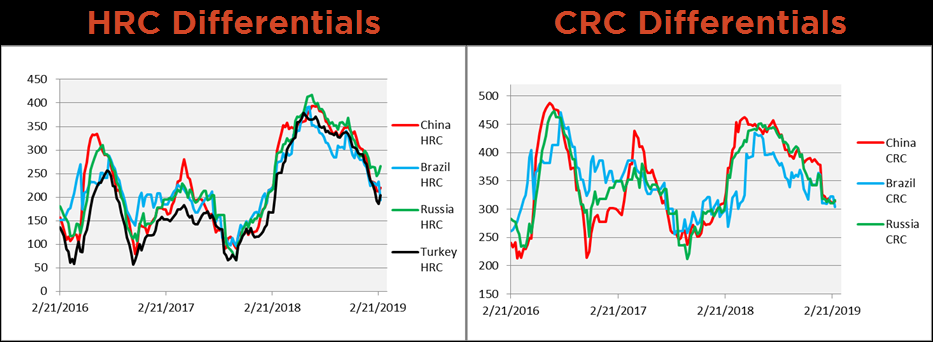
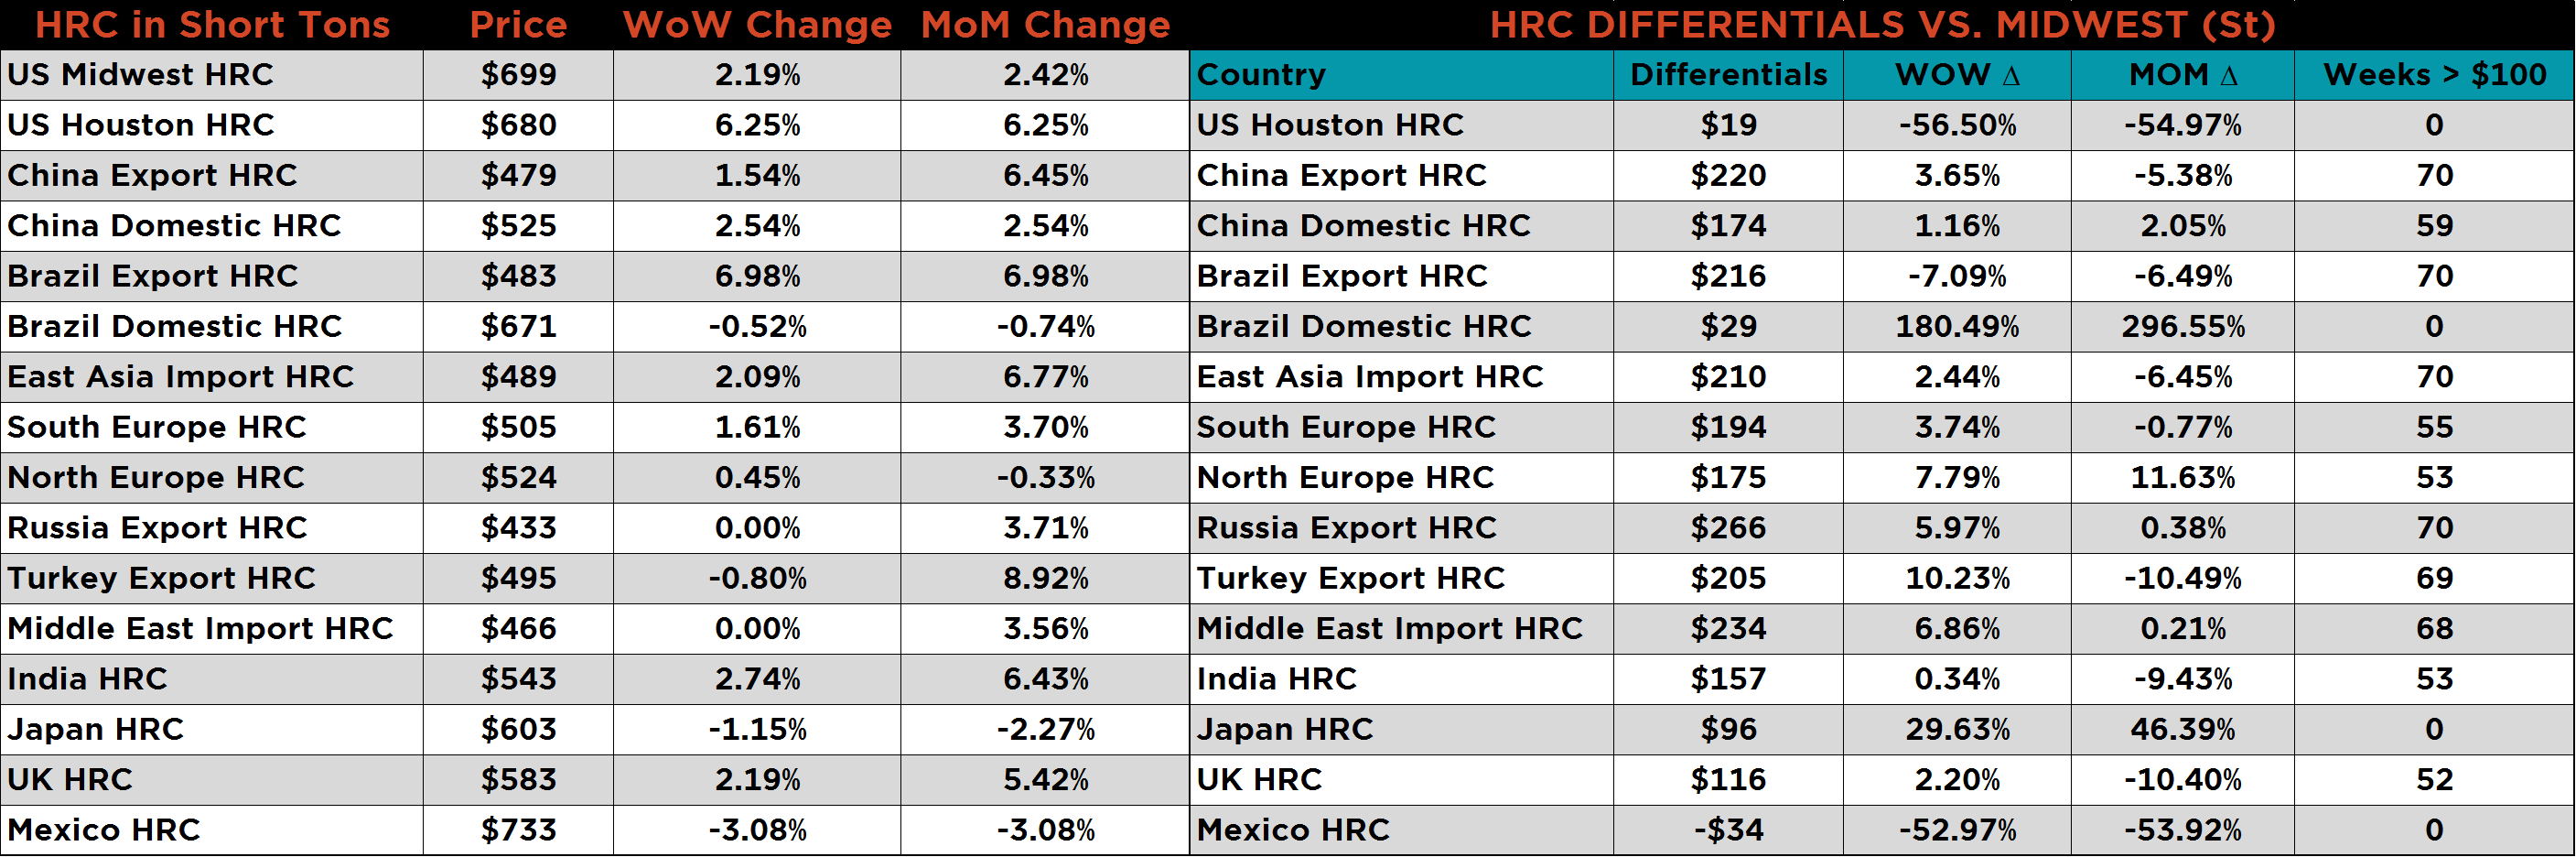
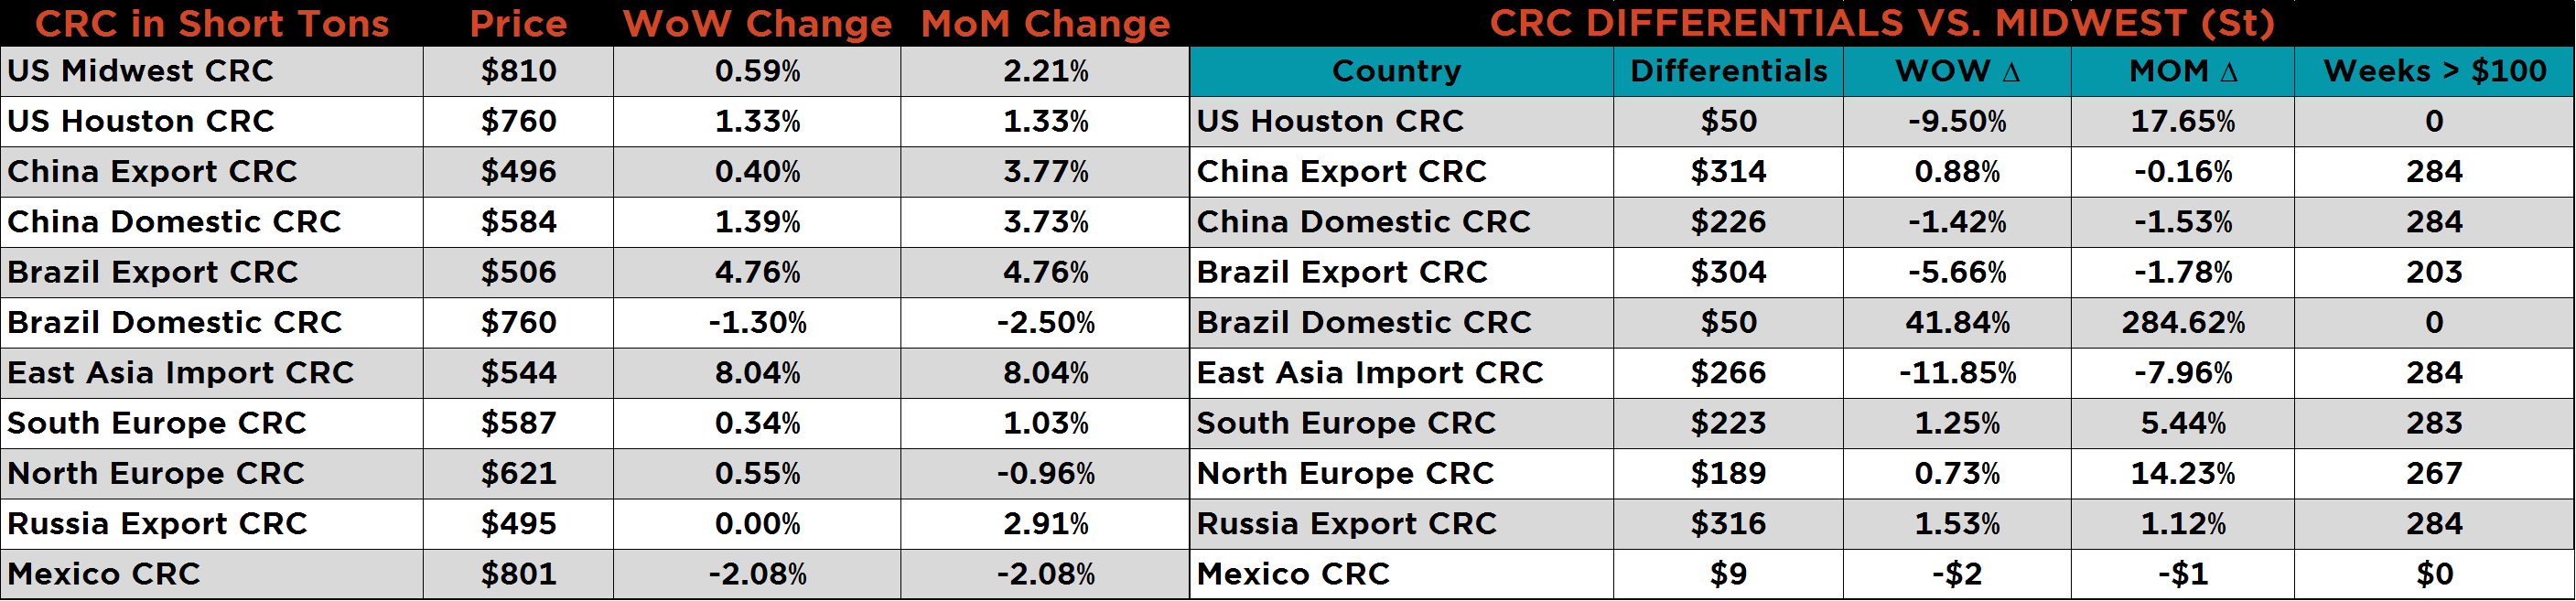
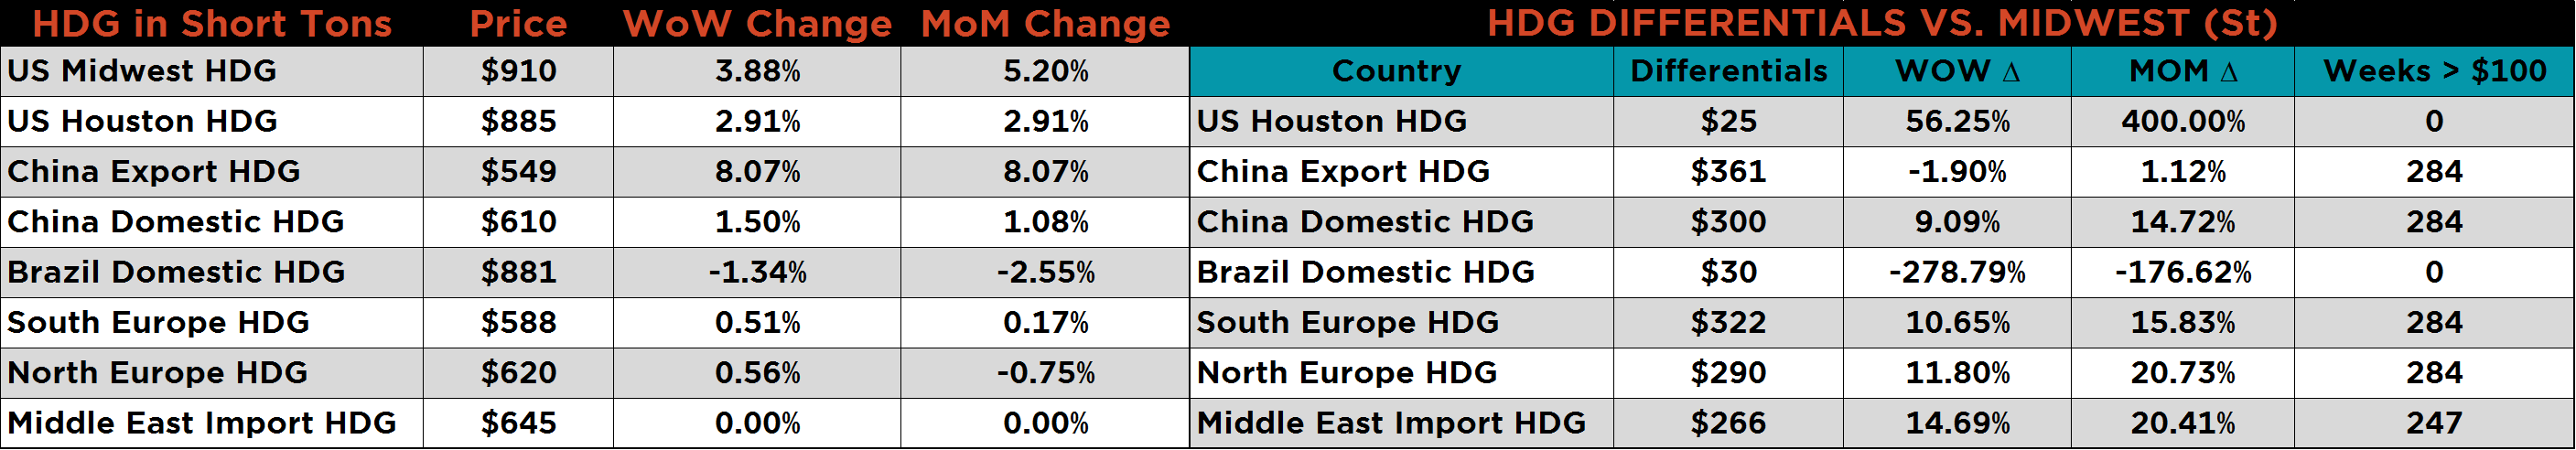
Below are HRC and CRC Midwest vs. each country’s export price differentials using pricing from SBB Platts. Both Chinese and Russian HR and CR price differentials continued to rally, while the Brazilian HR and CR differentials declined. Turkish HR ticked up after a long downtrend.
SBB Platt’s HRC, CRC and HDG WoW pricing is below. The Midwest HRC prices rose 2.2% while HDG gained 3.9%. The Houston HRC price gained 6.25% to 680. Brazilian export prices jumped sharply with HRC up 7% and CRC up 8%. HRC prices in Asia were up, expect in Japan. Mexican HRC and CRC were down.
Midwest scrap prices were higher along with NOLA pig iron. East Coast shred was down 4.4%.
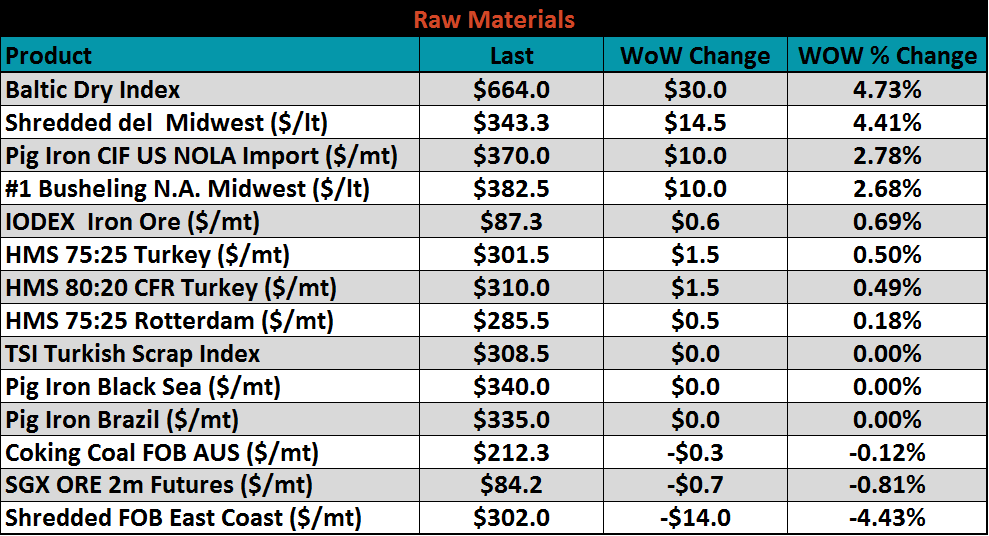
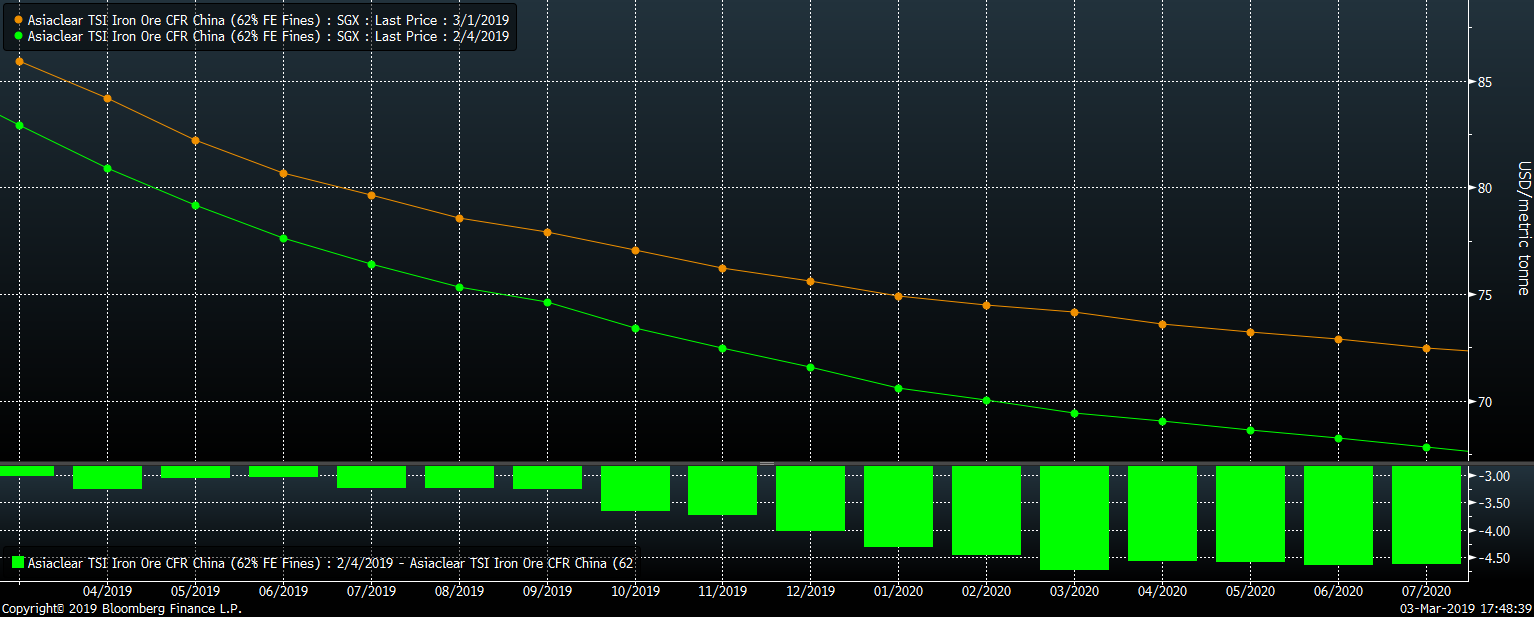
The April SGX iron ore future gained $1.33 to $84.17 and the April Turkish scrap future added $1 to $327.50.
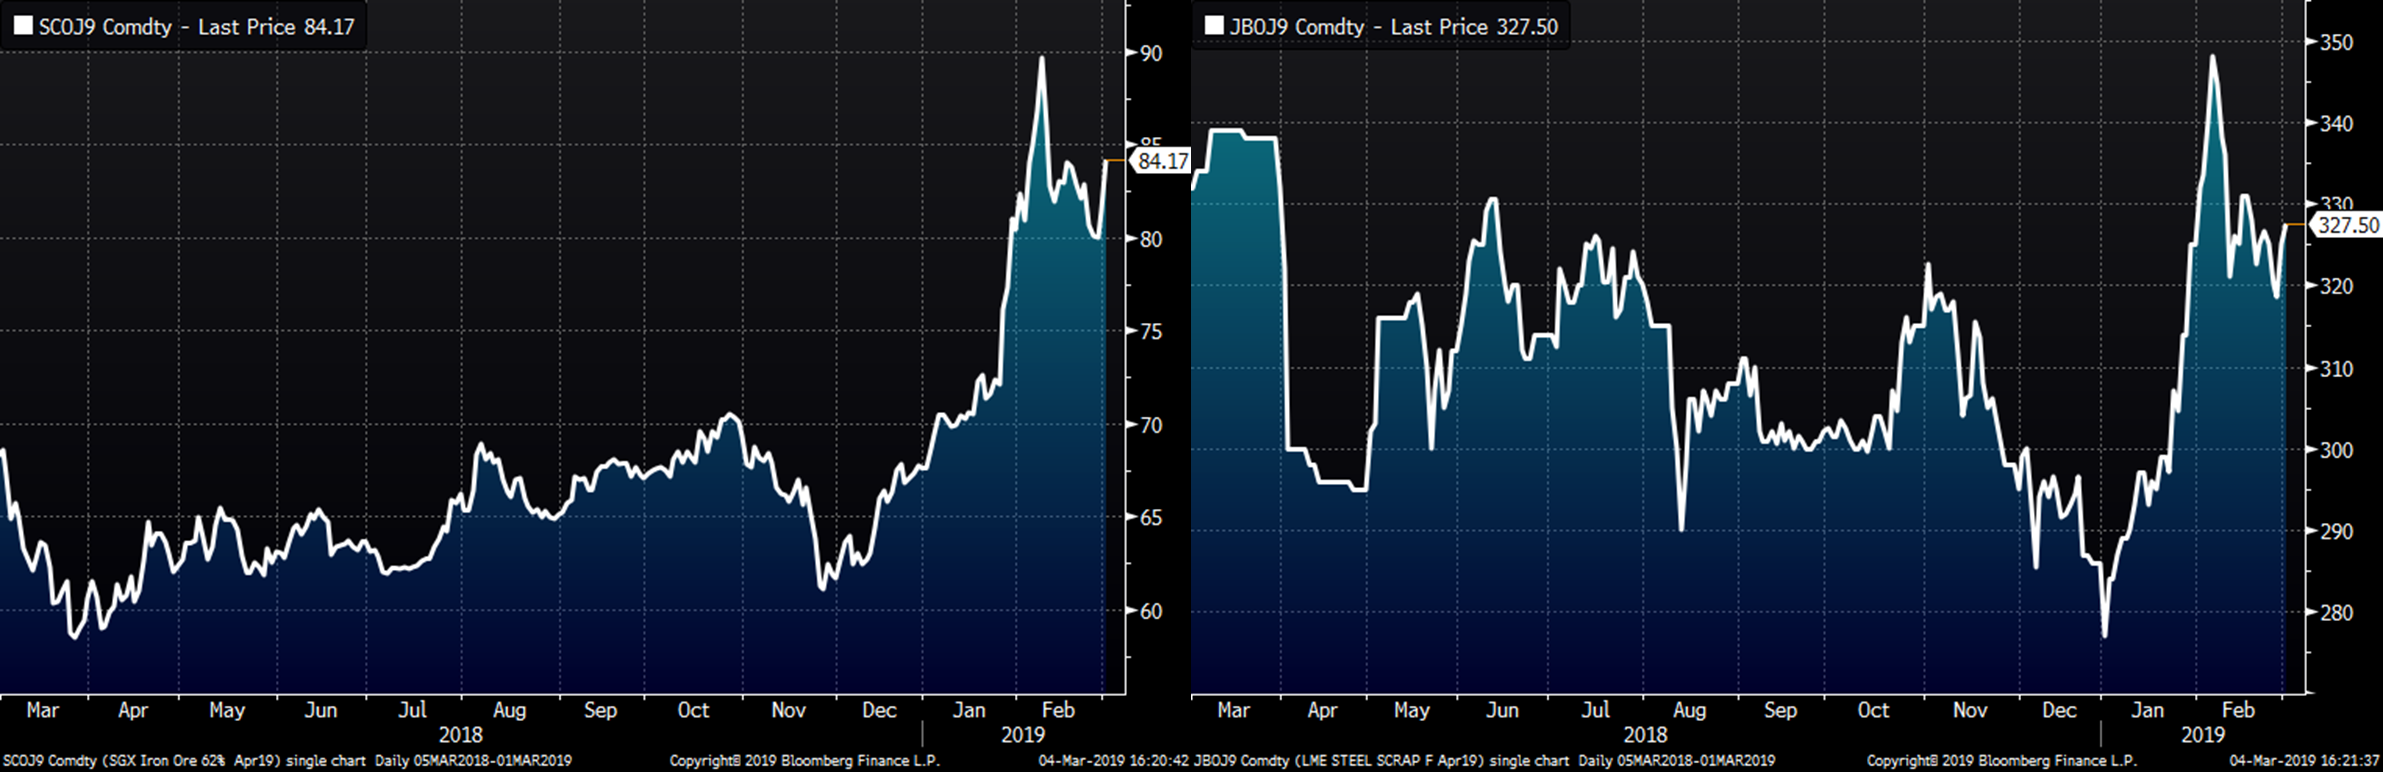
The SGX iron ore futures curve has continued to rally over the last month while also flattening.

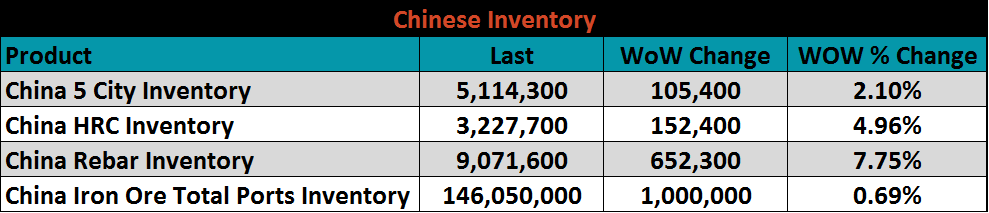
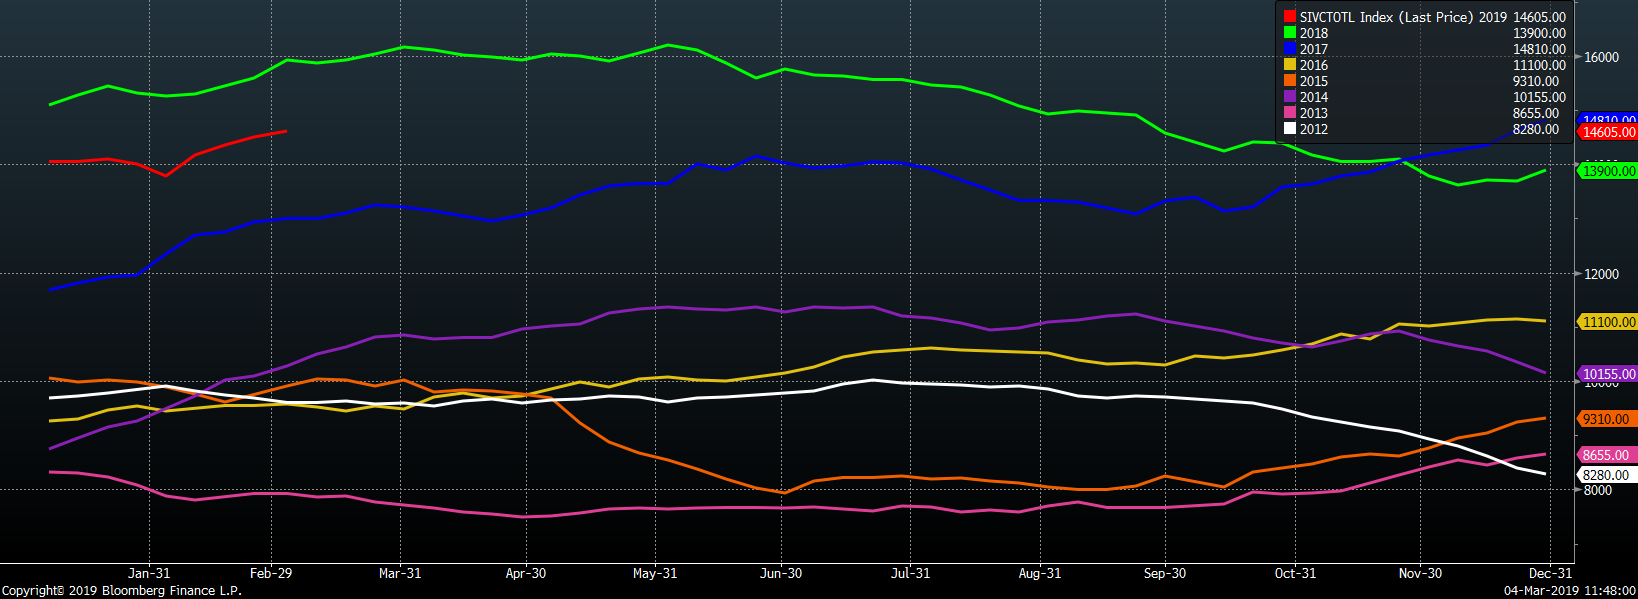
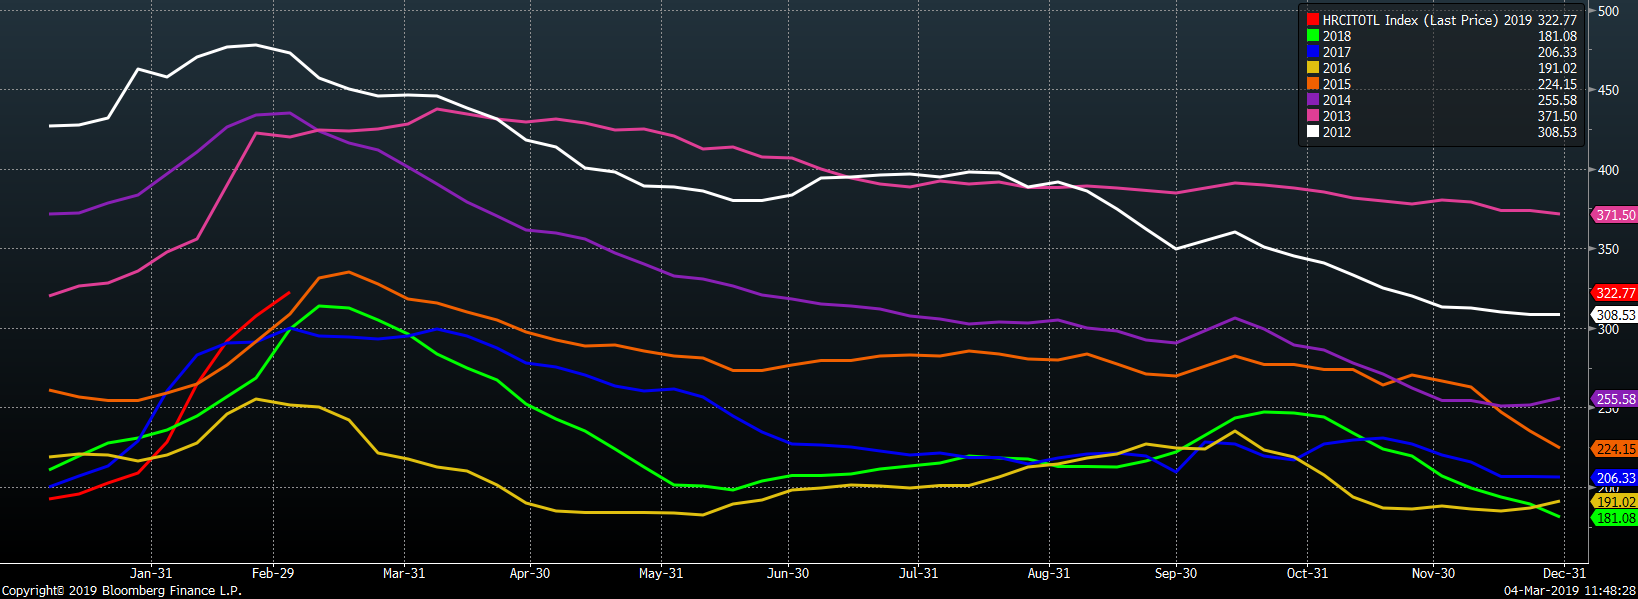
Below are inventory levels for Chinese finished steel products and iron ore. HRC and rebar inventory levels are at their highest level for this week since 2014.
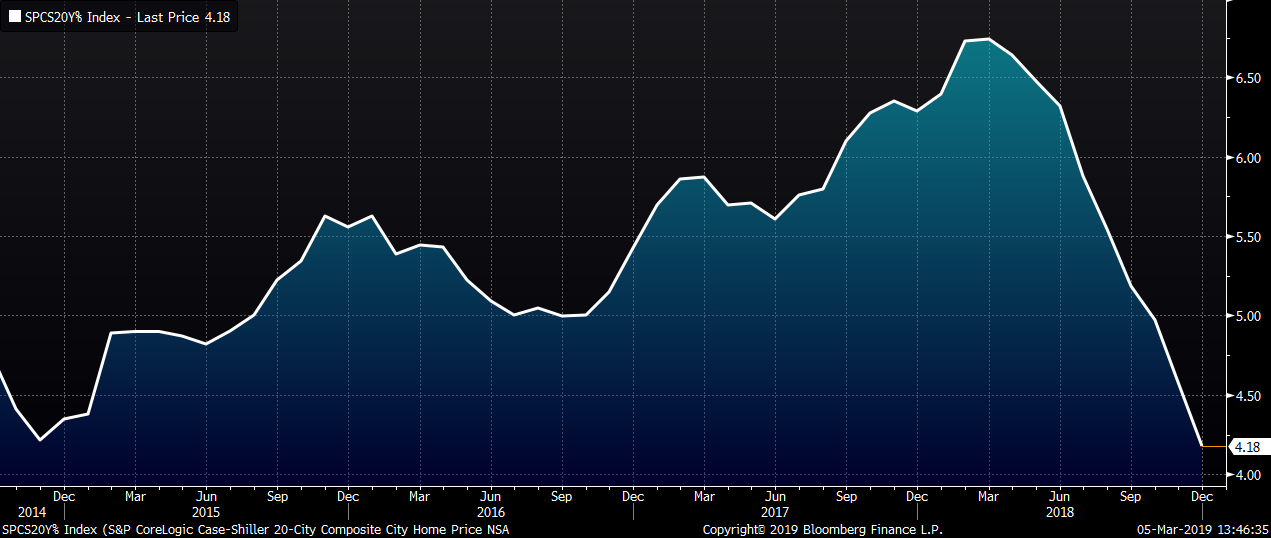
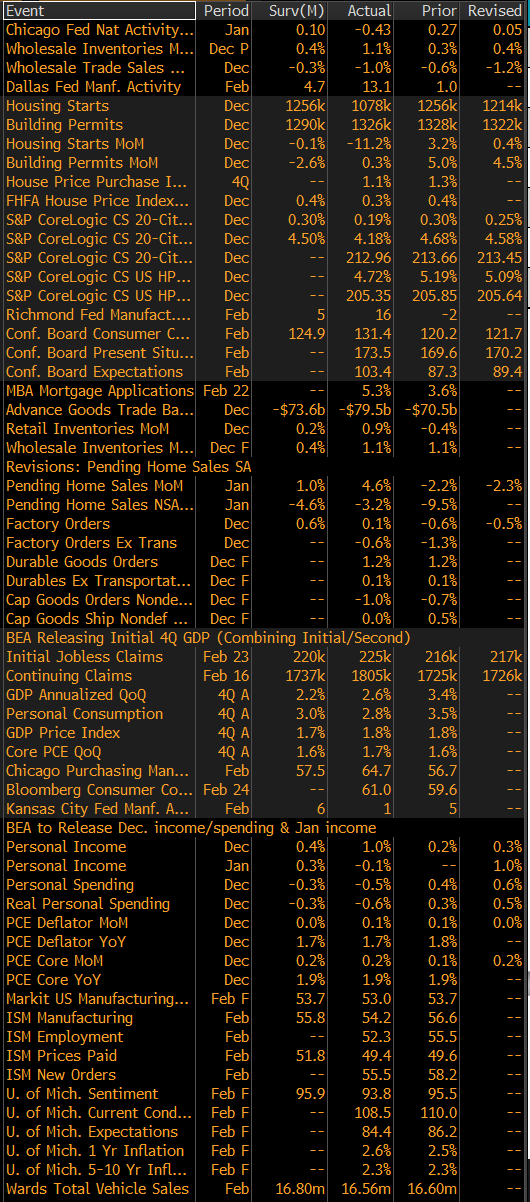
Most of last week’s economic releases have been covered. The table to the right lists all of the economic data released last week. December housing starts were were down 11.2% vs. expectations of a drop of 0.1%. The December Case-Shiller 20 City Home Price Index saw YoY gains fo 4.18% missing expectations of 4.5% gain. The index is charted below clearly showing the slowdown in home price appreciation. However, January pending home sales were better than expected growing 4.6% MoM.
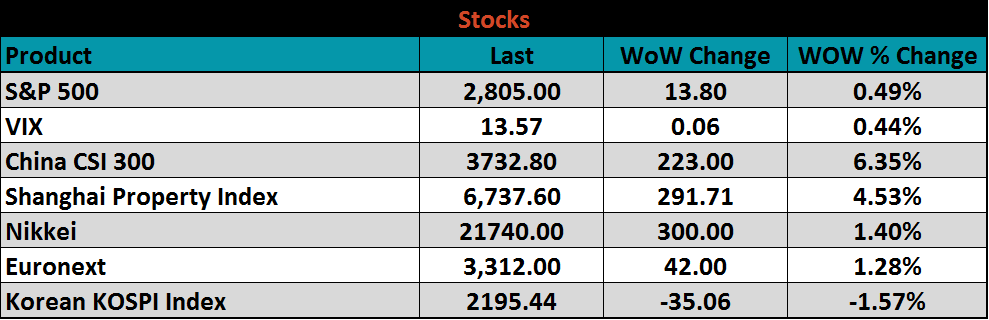
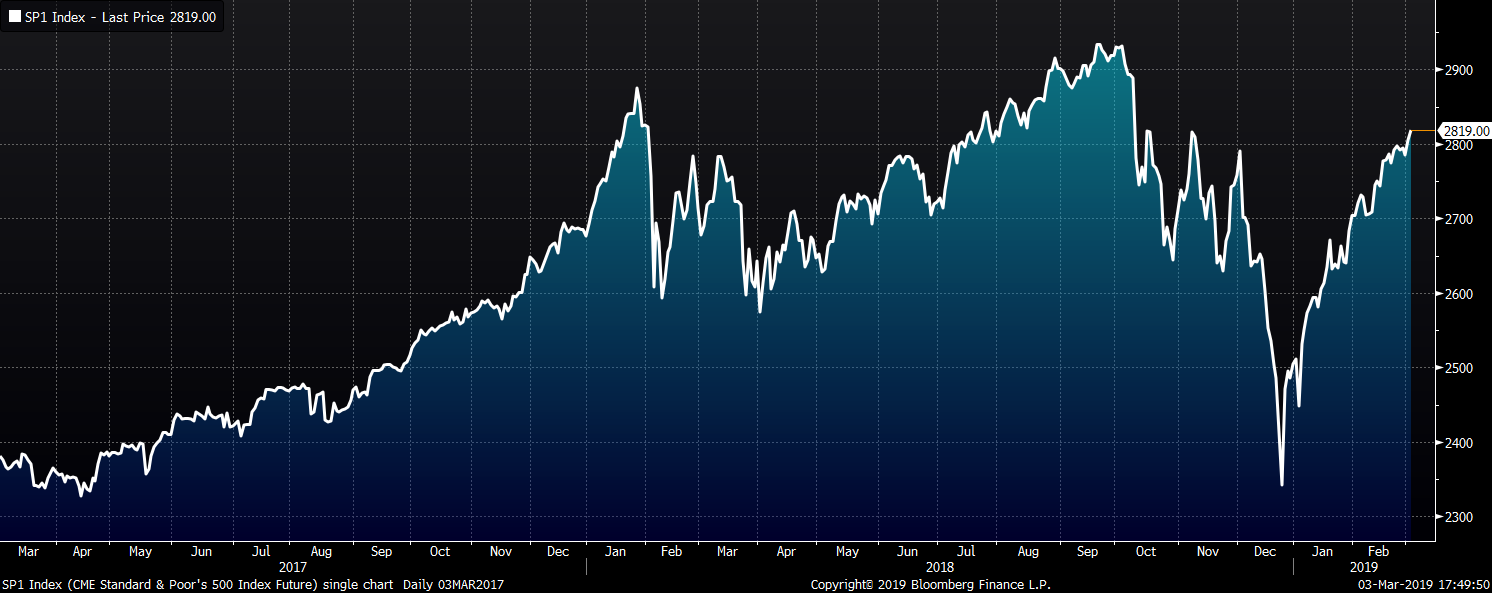
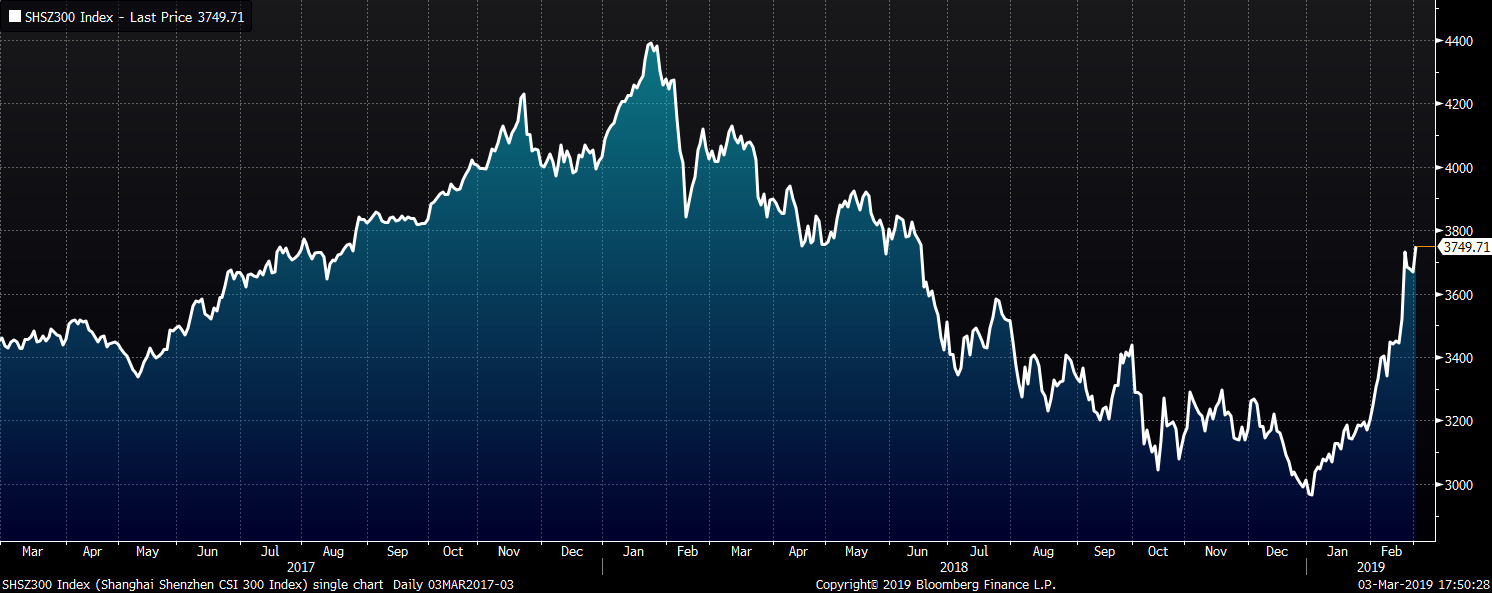
The S&P 500 saw another week of gains. China’s stock markets continue to rally now up 25% YTD.
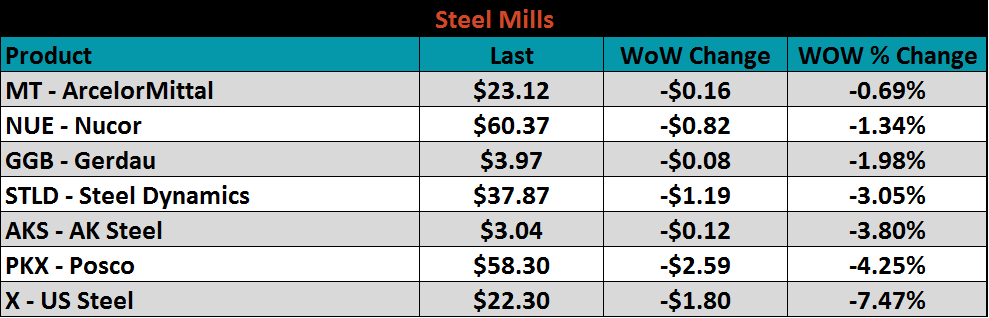
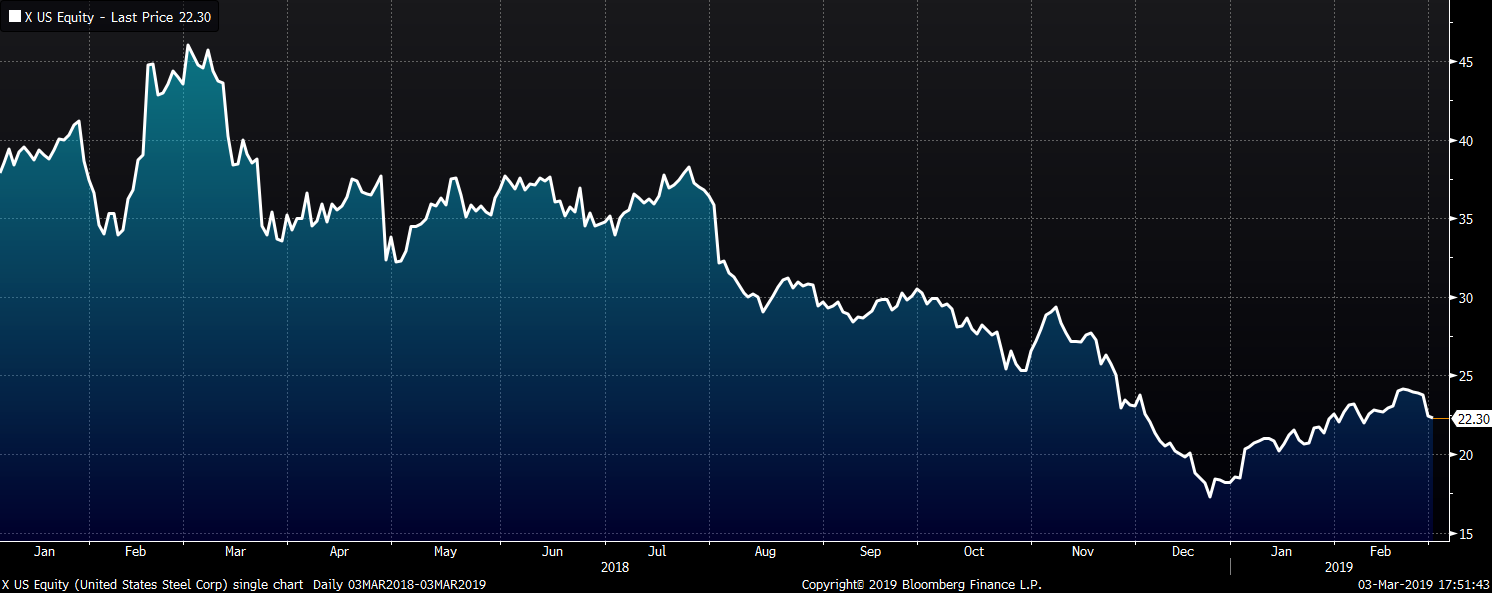
Steel mill stocks were all lower last week. U.S. Steel and Posco were down 7.5% and 4.3%, respectively.
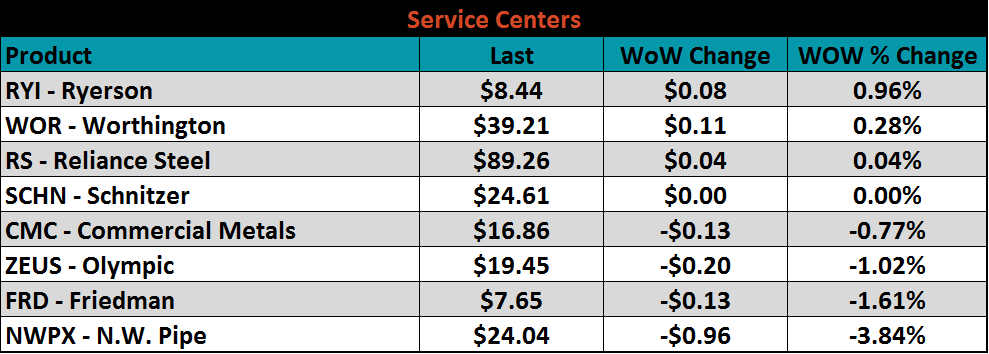
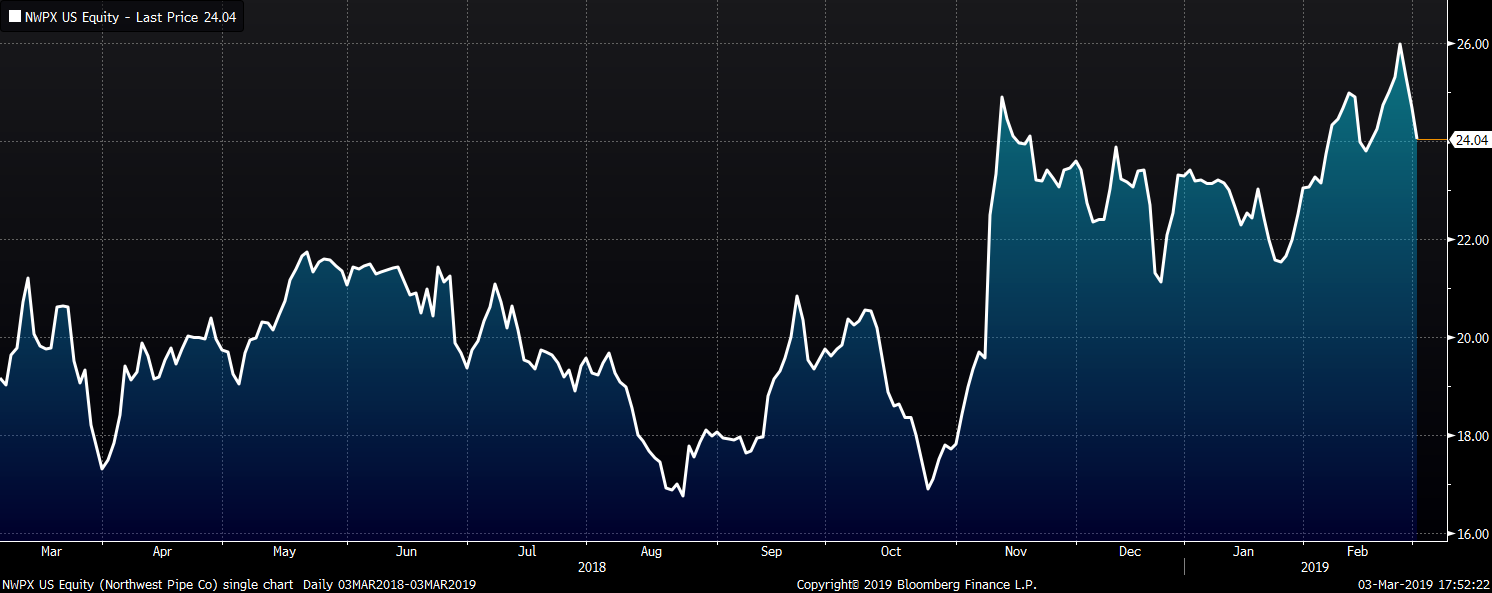
Service center stocks were mixed. Northwest Pipe was down 3.8%.
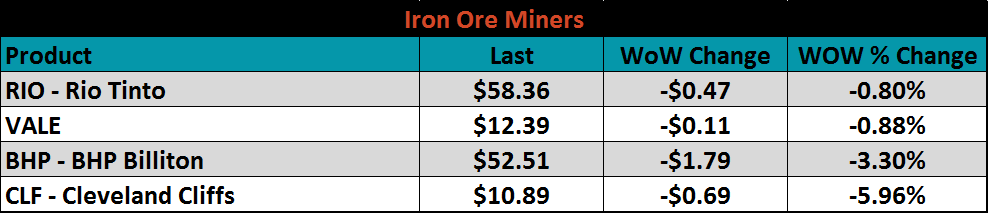
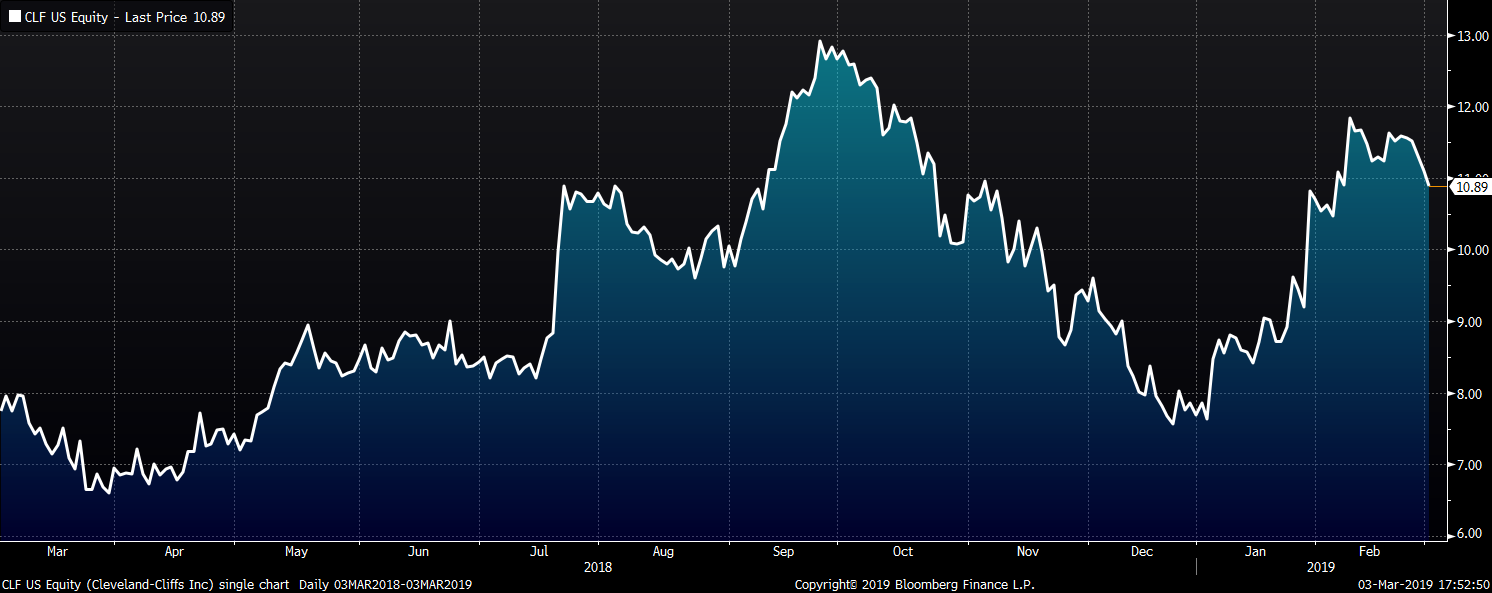
Mining’s stocks listed below were all down on the week with Cleveland Cliffs down 6%.
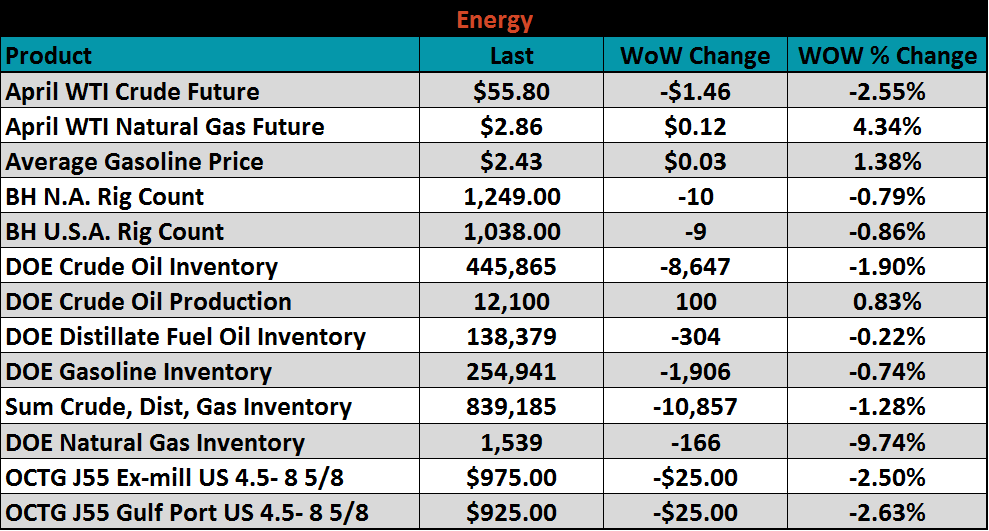
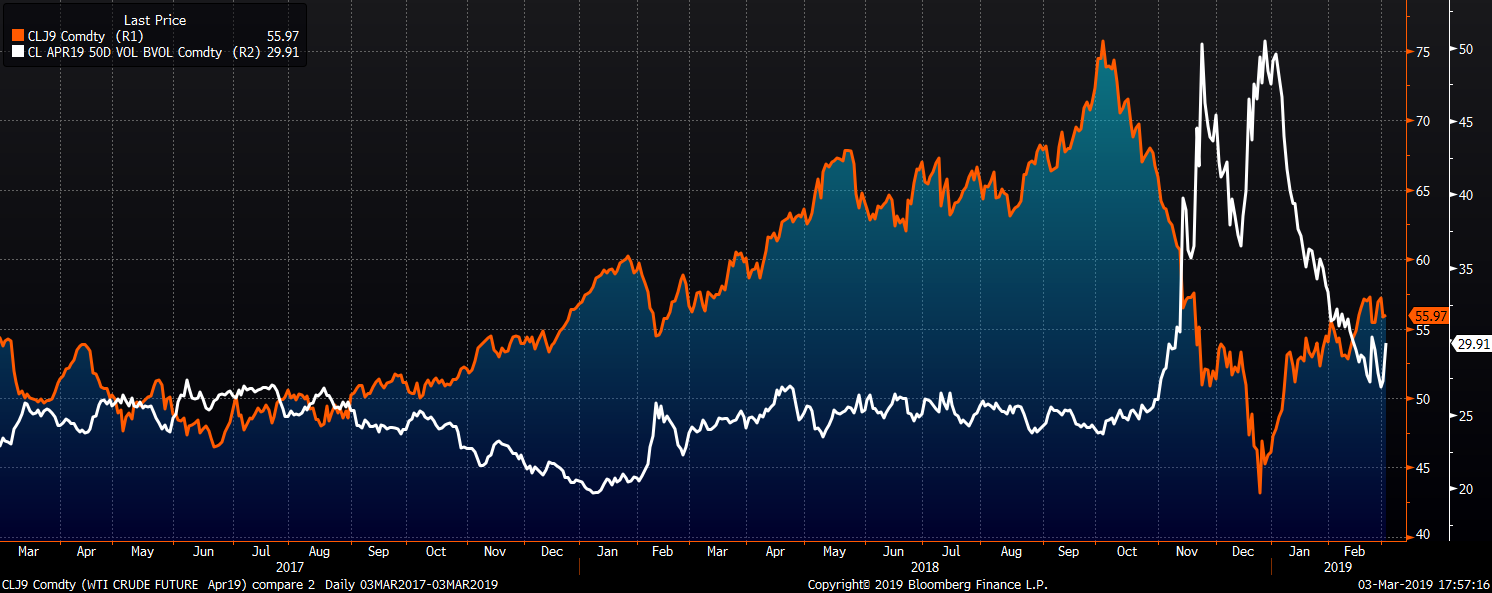
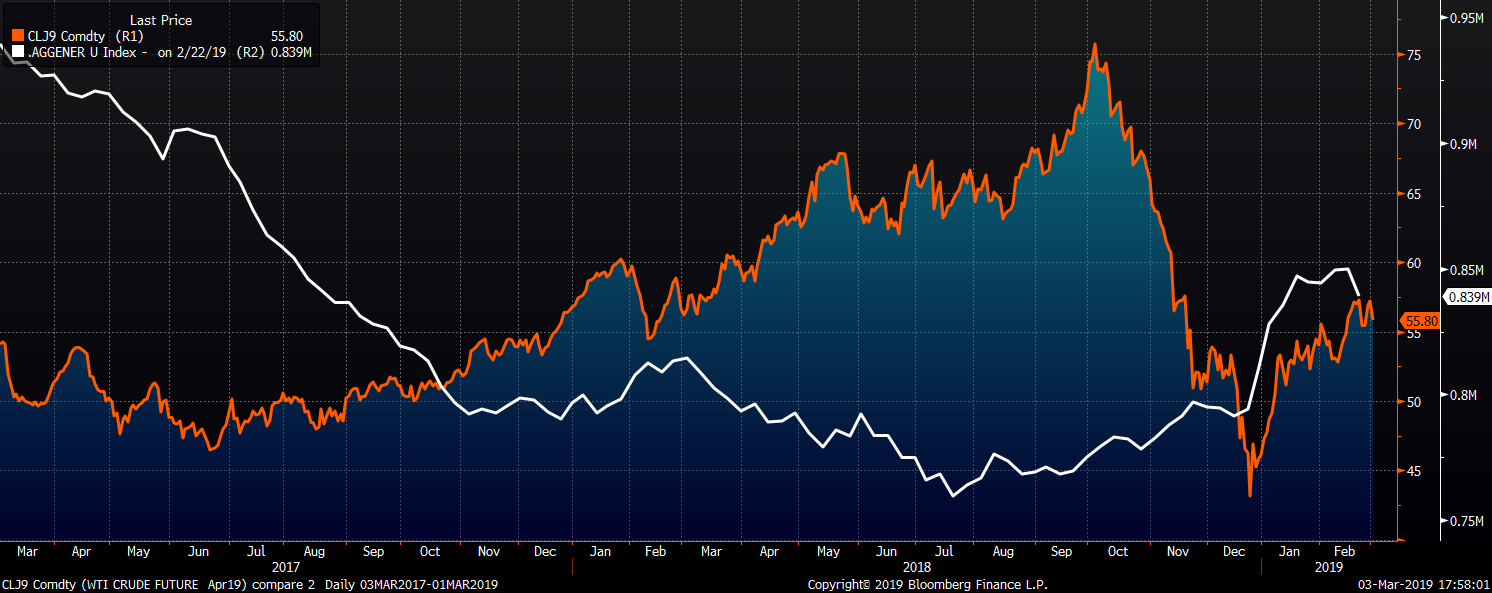
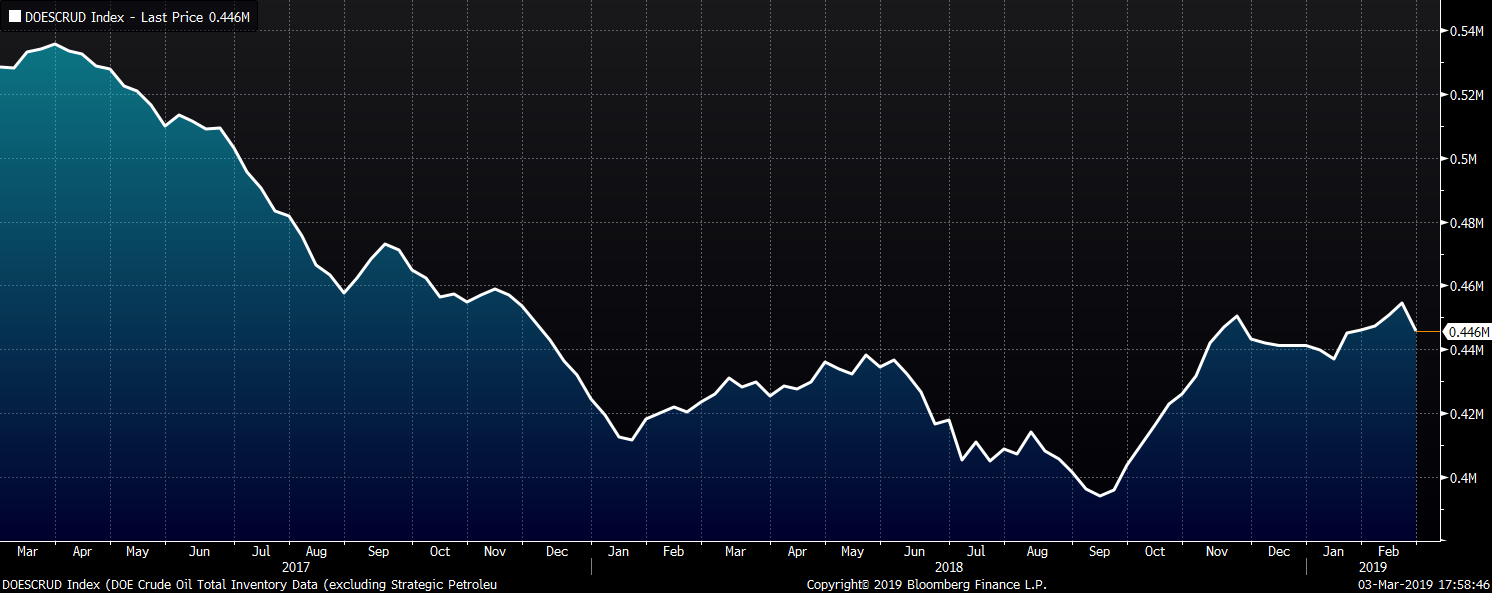
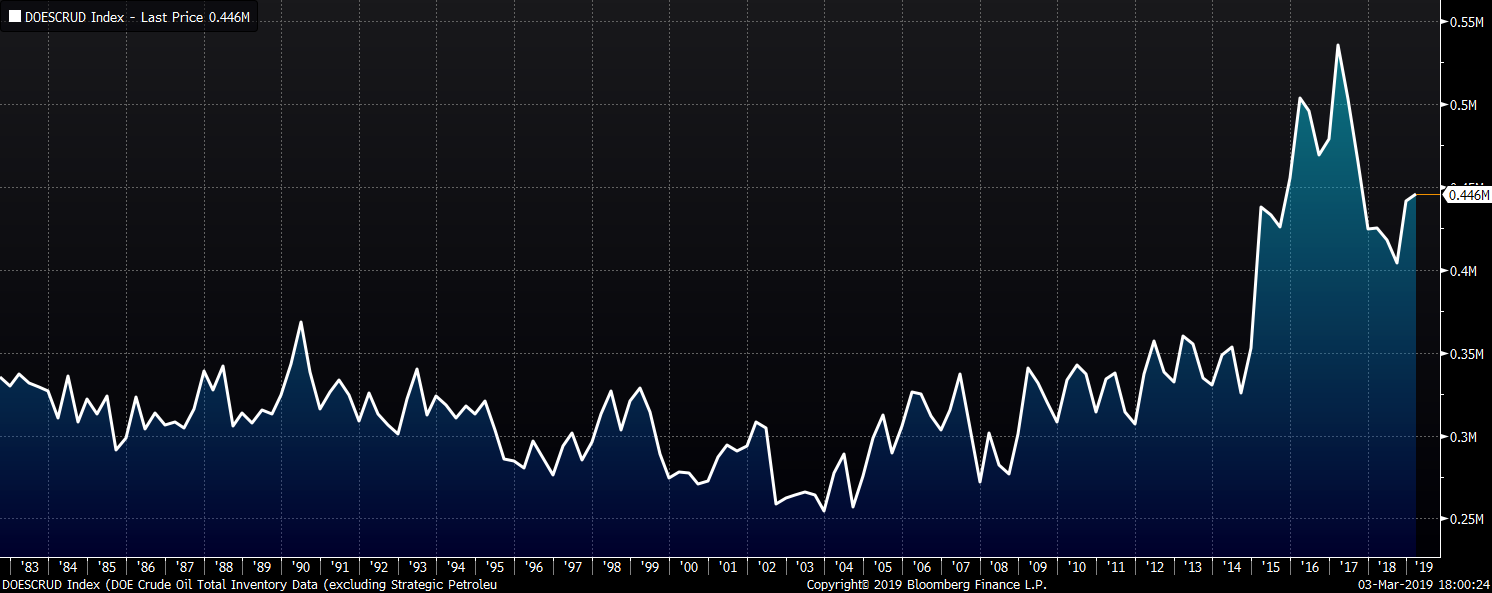
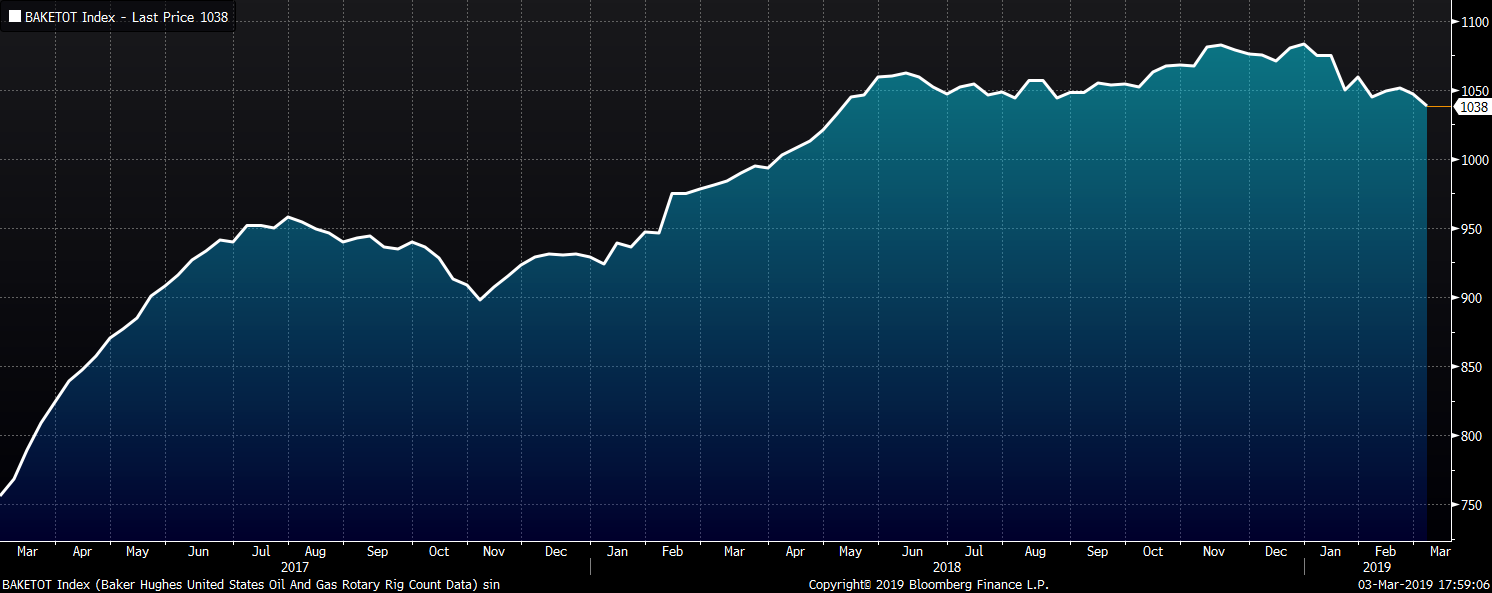
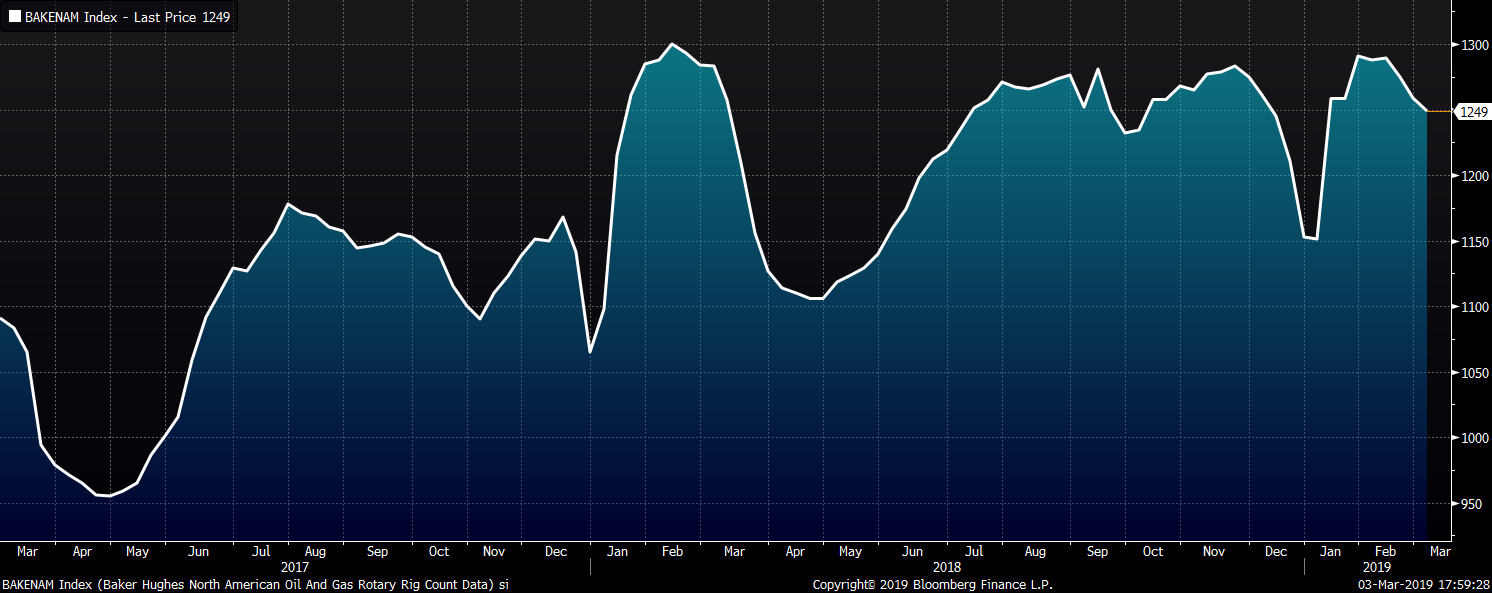
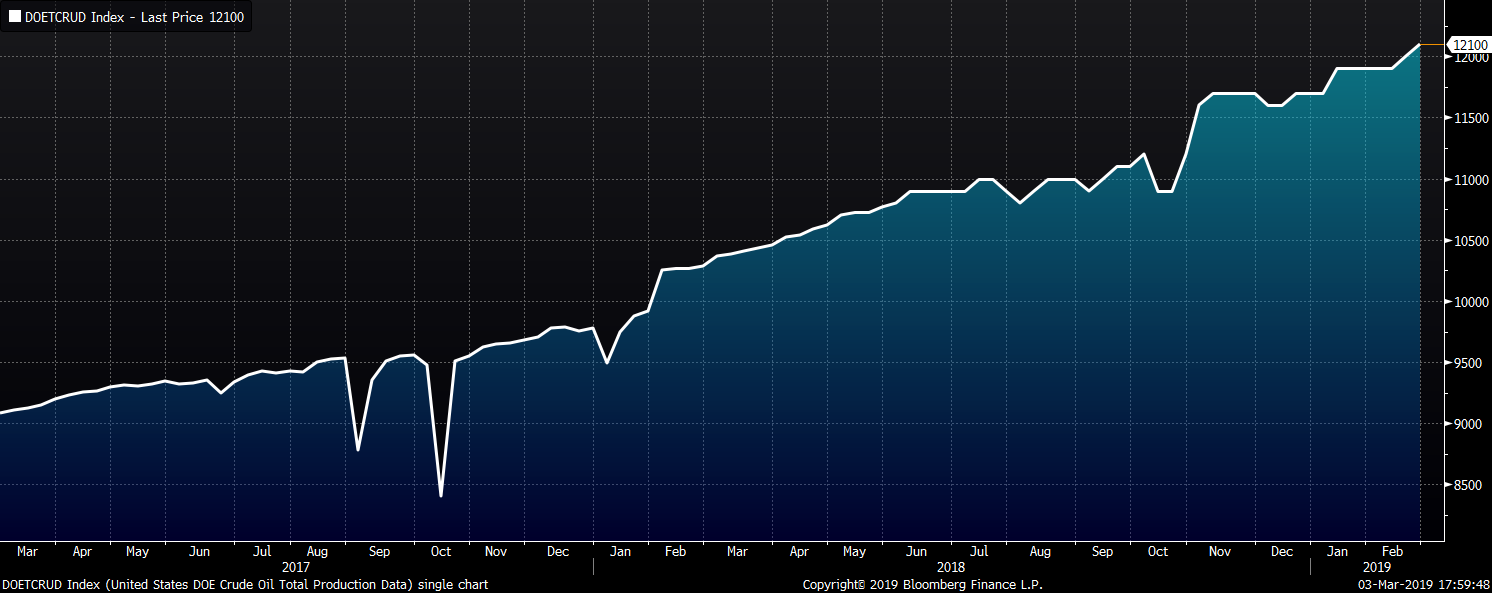
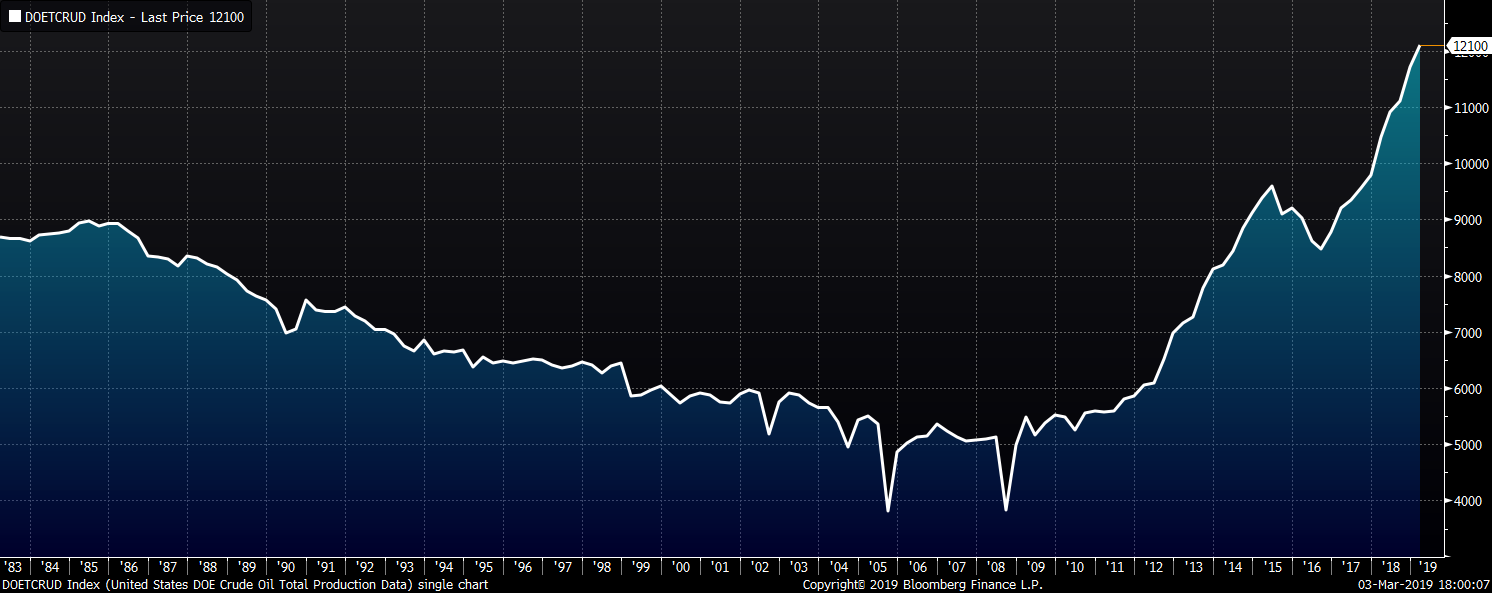
Last week, the April WTI crude oil future lost $1.46 or 2.6% to $55.80/bbl. Crude oil inventory fell 1.9% while gasoline and distillate inventories fell 0.7% and 0.2%, respectively. The aggregate inventory level fell 1.28%. Crude oil production increased to 12.1m bbl/day. The U.S. rig count lost nine rigs while the North American rig count lost ten rigs. The April natural gas future gained $0.12 or 4.3% to $2.86/mmBtu. Natural gas inventory fell 9.7%.
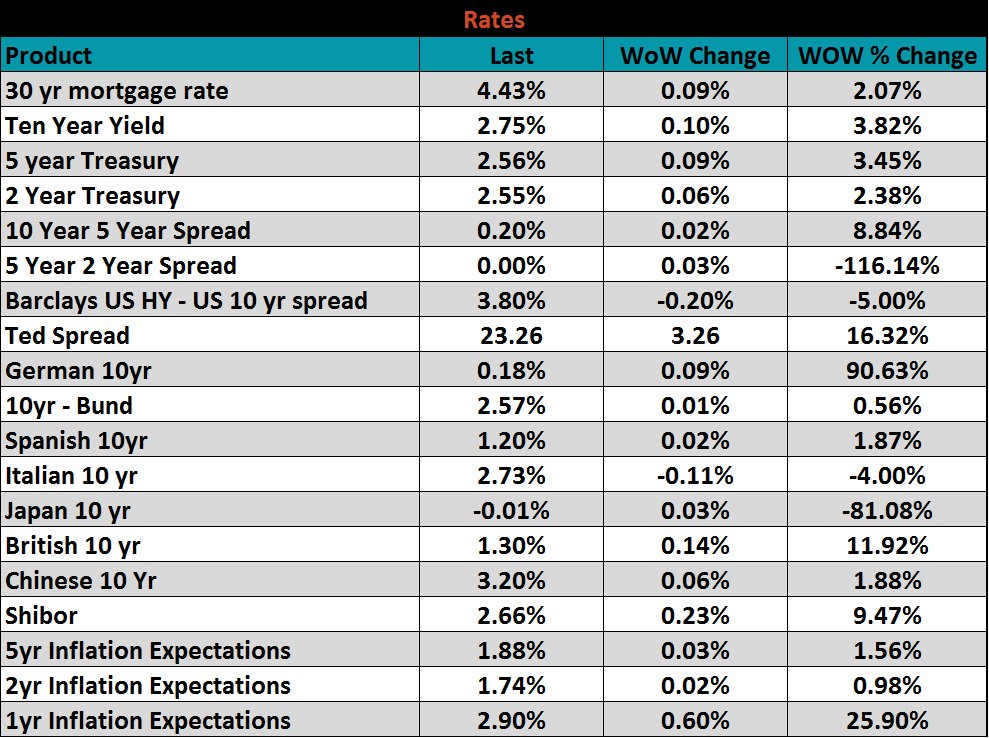
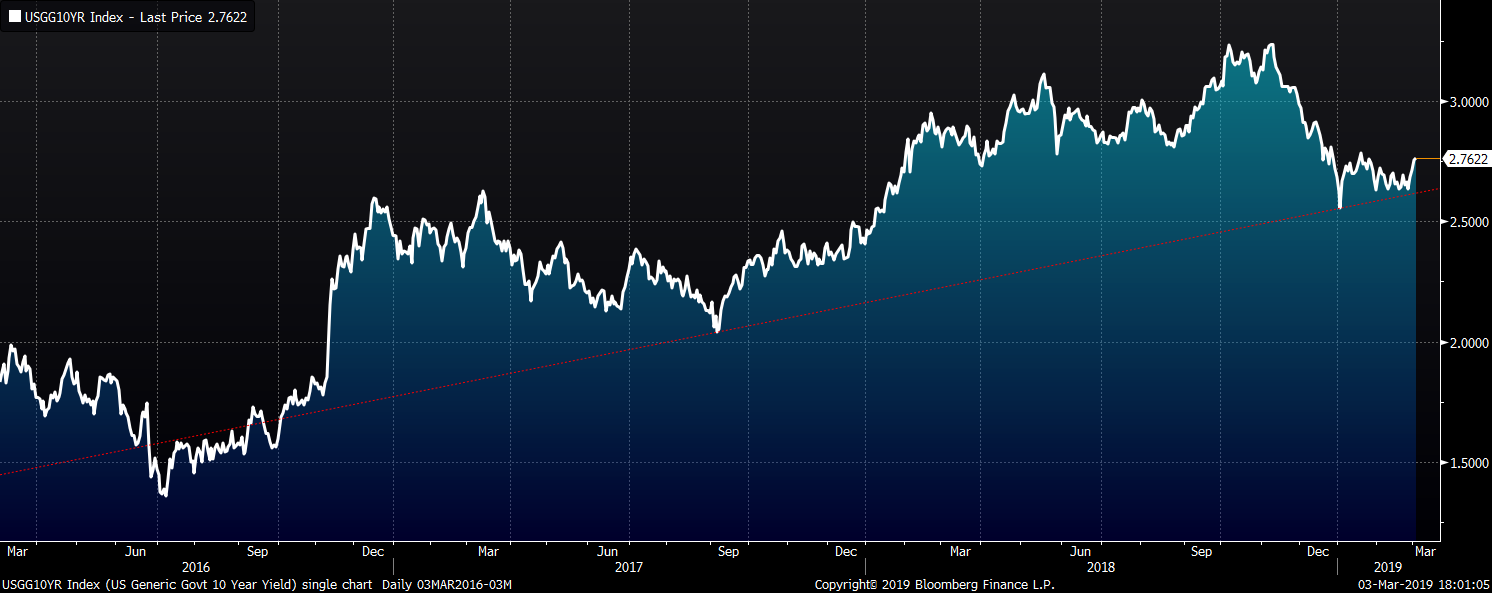
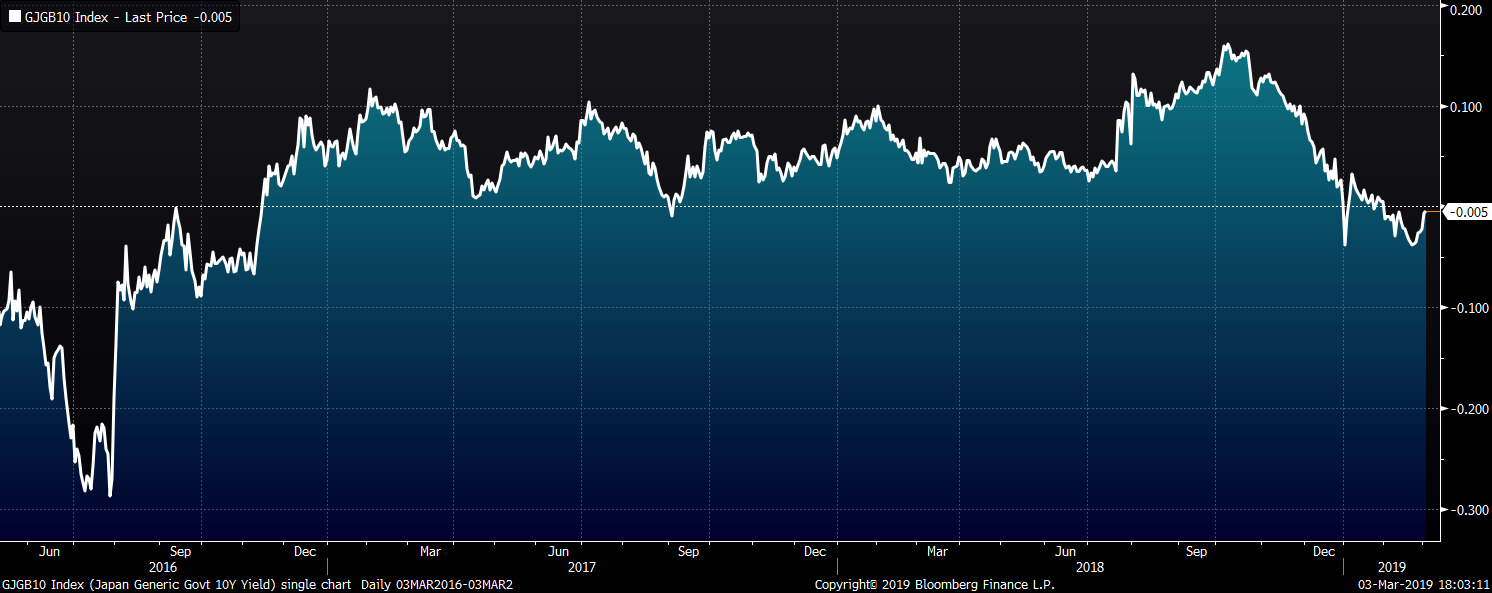
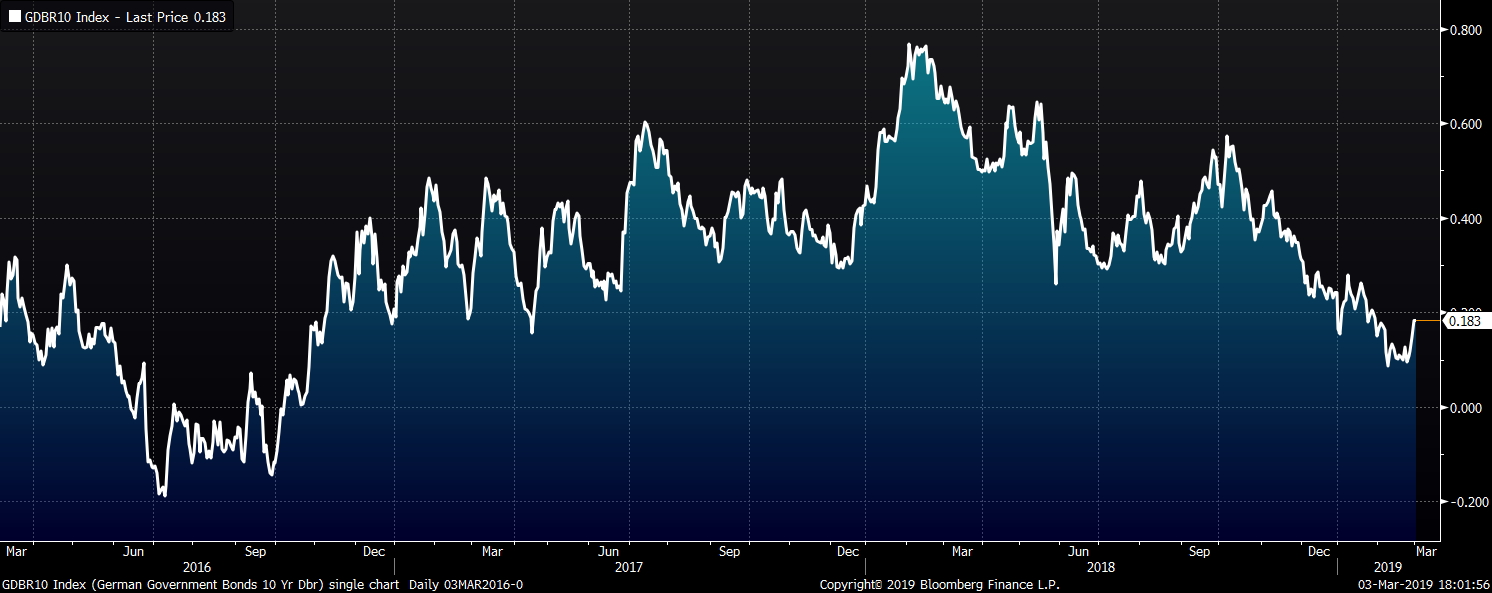
The U.S. 10-year treasury yield was up 10 basis points closing the week at 2.75%. The yield on the Japanese 10-year yield added 3 basis points but remains below the zero lower bound at -0.01% and the German 10-year yield rose 9 basis points to 0.18%.
The list below details some upside and downside risks relevant to the steel industry. The orange ones are occurring or look to be highly likely. The upside risks look to be in control.
Upside Risks:
Downside Risks: