Content
-
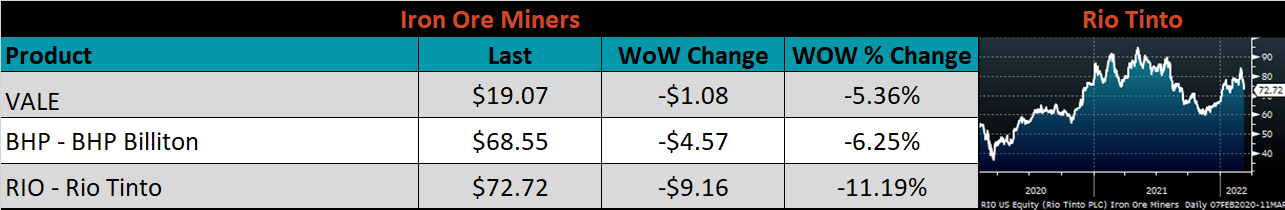
Weekly Highlights
- Market Commentary
- Upside & Downside Risks


Last week, as the physical market started to wake up to the far-reaching consequences of the Russian invasion into Ukraine, spot prices began to mirror what we saw in the financial markets the day after the conflict began. Namely, few offers at elevated prices that rarely lasts more than 24 hours. While the severity of the price bounce was driven by the Russian invasion, the fact remains that prior to the conflict, the market was firming, and the bottom was in sight. However, due to the conflict, the main driver of what will propel spot prices in the physical market forward is very different than what was experienced in 2020 and 2021.
In last year’s rally, where assessed prices peaked just below $2,000 for HRC, the imbalance between better than anticipated demand and restricted supply led to rapid but steady increases over a long period of time. In 2022, demand for steel is expected to continue to grow, but raw material pricing and availability are shrouded in uncertainty. The CIS region is the main global source for scrap, and more acutely, Russia and the Ukraine accounted for 60% of the pig iron imported to the U.S. last year. The severity of this cannot be overstated – while the mix in the scrap blend in EAF’s does allow for some variability, there is a limit to how much of each component can be used. For instance, pig iron accounts for approximately 20% of scrap blend. It simply cannot be replaced by busheling, bundles, or shredded. Over time, and with significant capital investments, it would be possible to start producing pig iron domestically, however, this is not a switch that can be flipped to alleviate the problem today or any time soon. On top of that, auto manufactures remain constrained by the chip shortage, reducing the supply of busheling both domestically and globally. The takeaway is clear – the upside risk to the spot market is historically high as strong demand persist, inventories decline and raw material cost skyrocket.
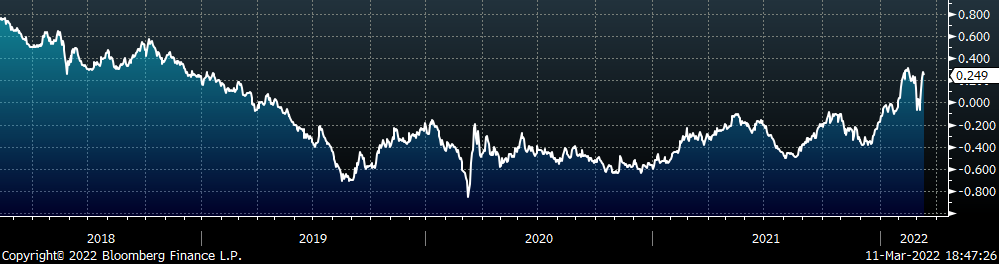
Another important layer in all of this comes from the chart below, where we see the monthly percentage of import vs mill purchases in the U.S. domestic market.
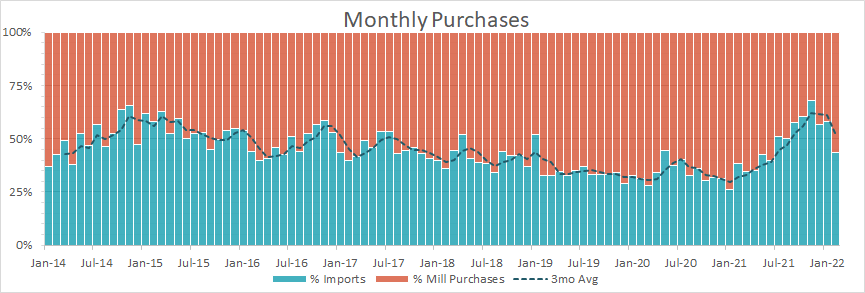
We look at this chart as a reference to show how much negotiating power domestic mills have in the physical market. Intuitively, as the percentage of imports increases, mill negotiating power decreases. Since the peak in November of last year, domestic buyers have pulled back significantly on imports as the domestic price fell. Looking to the next couple of months, we do anticipate a slight uptick in import arrivals from the unexpectedly low level realized in February, as supply chains continue to work themselves out and existing orders make their way through the ports. However, by the middle of 2Q22, arrivals should slow dramatically because of the dynamics we have been highlighting over the last 6-weeks in these reports (i.e., rising global prices and a negative domestic vs. global differentials). This means that when buyers must re-enter the market as inventories decline, the only viable option will be buying domestic, and there is no telling how high domestic prices will be by then.
Below are the most pertinent upside and downside price risks:
Upside Risks:
Downside Risks:
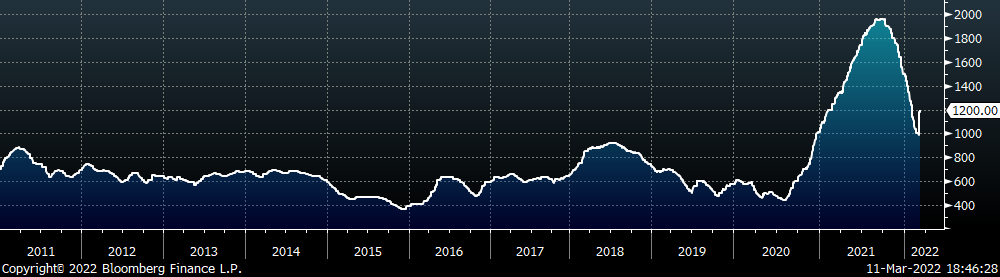
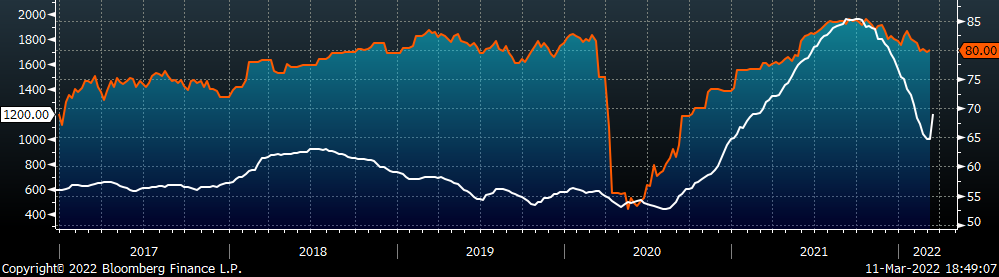
The Platts TSI Daily Midwest HRC Index rebounded significantly and was up $200 to $1,200. The is the first notable increase in 22 weeks.
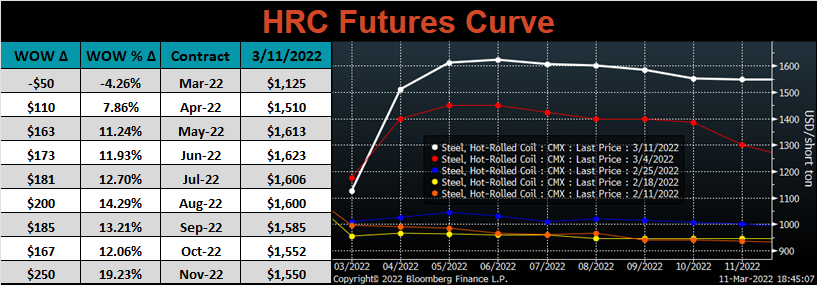
The CME Midwest HRC futures curve is below with last Friday’s settlements in white. The entire curve shifted higher again this week, more so in the later expirations.
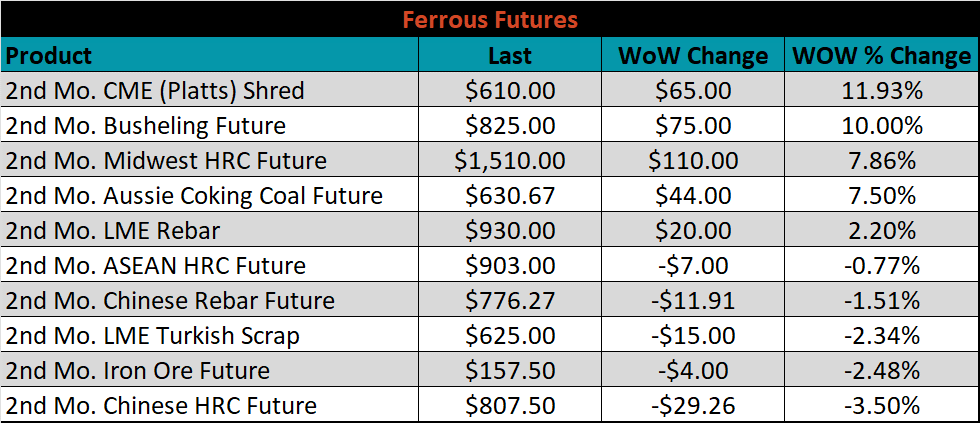
April ferrous futures were mixed, with CME shredded gaining 12%, while Chinese HRC lost 3.5%.
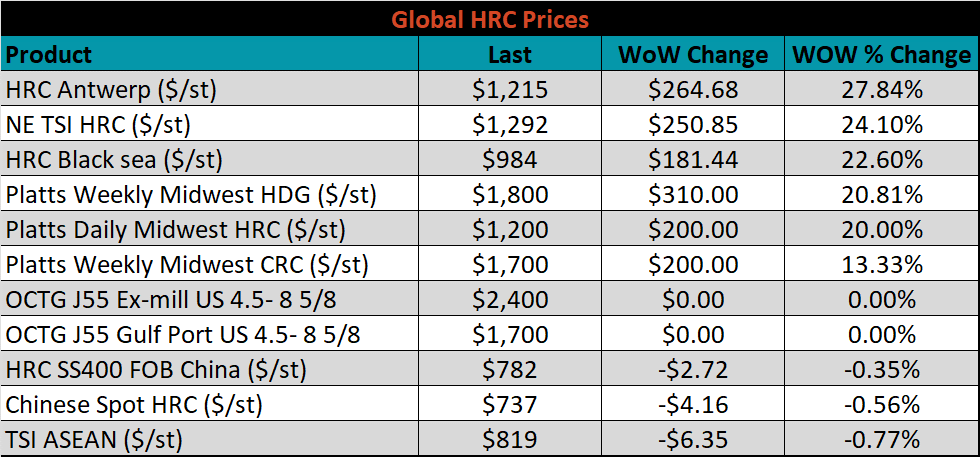
Global flat rolled indexes were mostly higher. Antwerp HRC rose the most, up 27.9%, while TSI ASEAN HRC was down slightly, 0.8%.
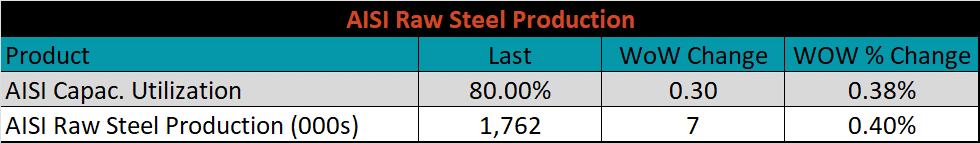
The AISI Capacity Utilization was up 0.3% to 80%.
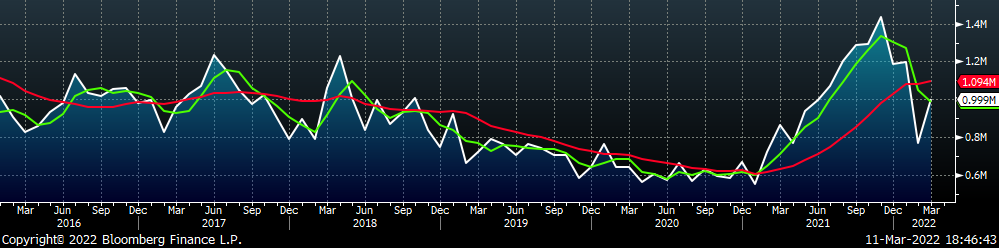
March flat rolled import license data is forecasting an increase of 233k to 999k MoM.
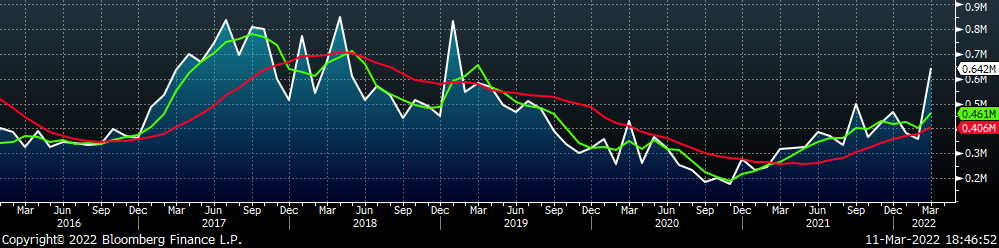
Tube imports license data is forecasting an increase of 285k to 642k in March.
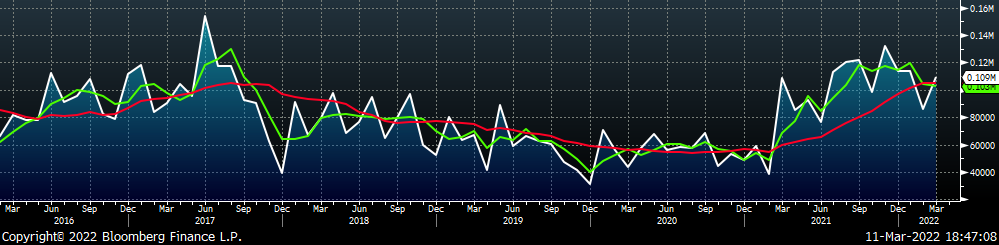
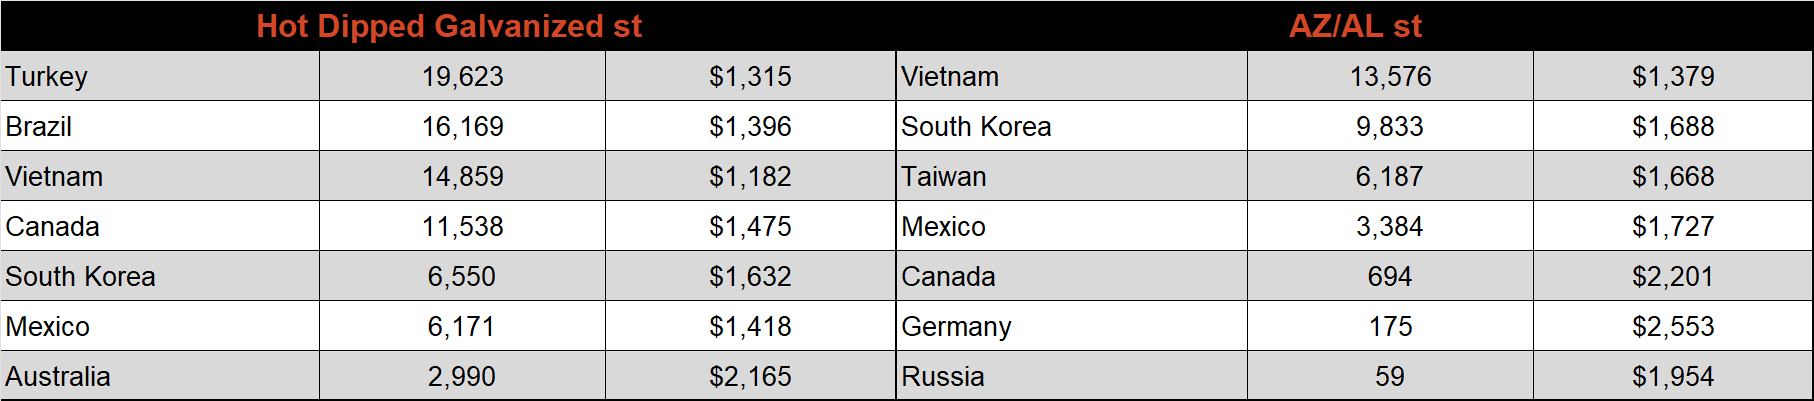
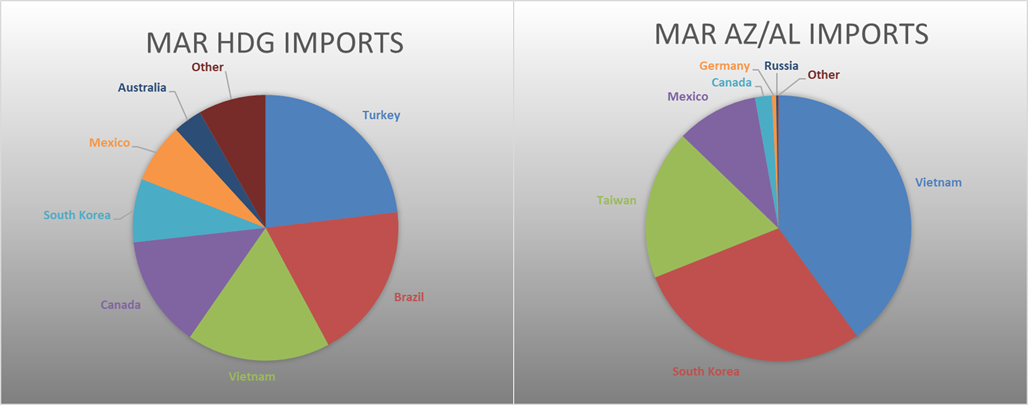
March AZ/AL import license data is forecasting an increase of 23k to 109k.
Below is February import license data through March 7th, 2022.
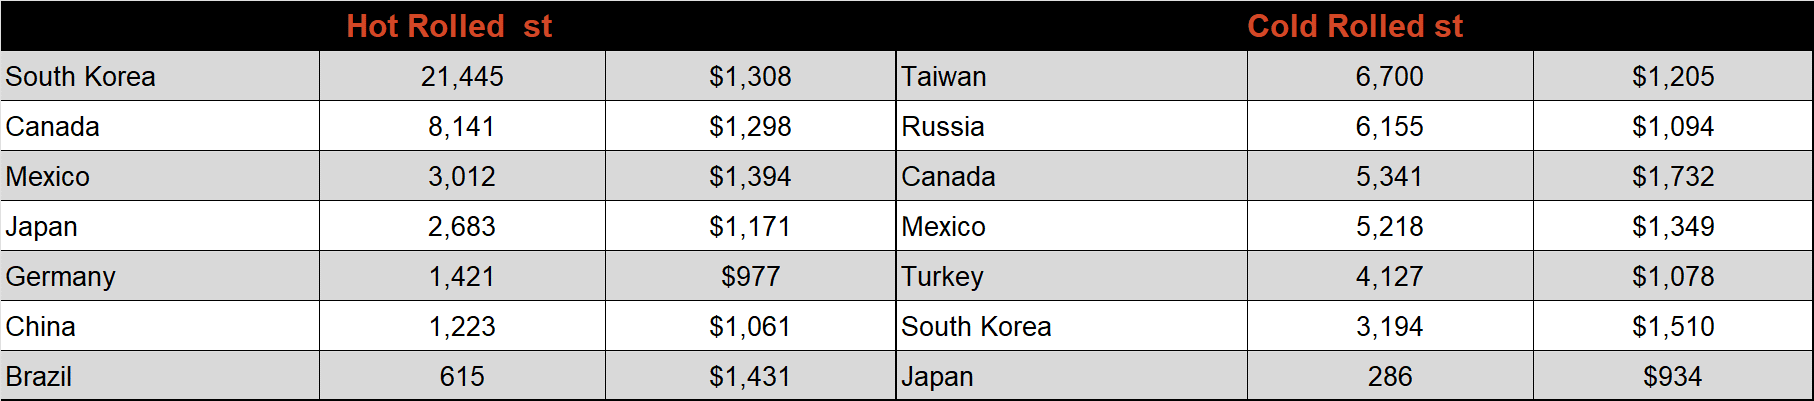
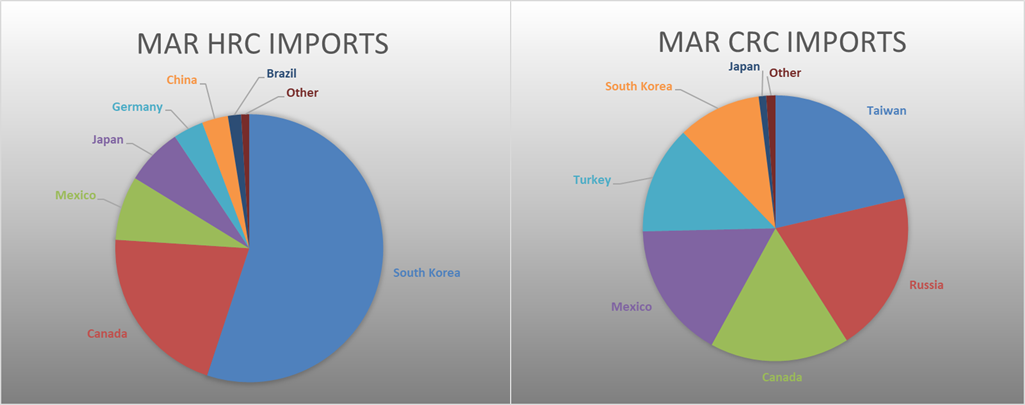
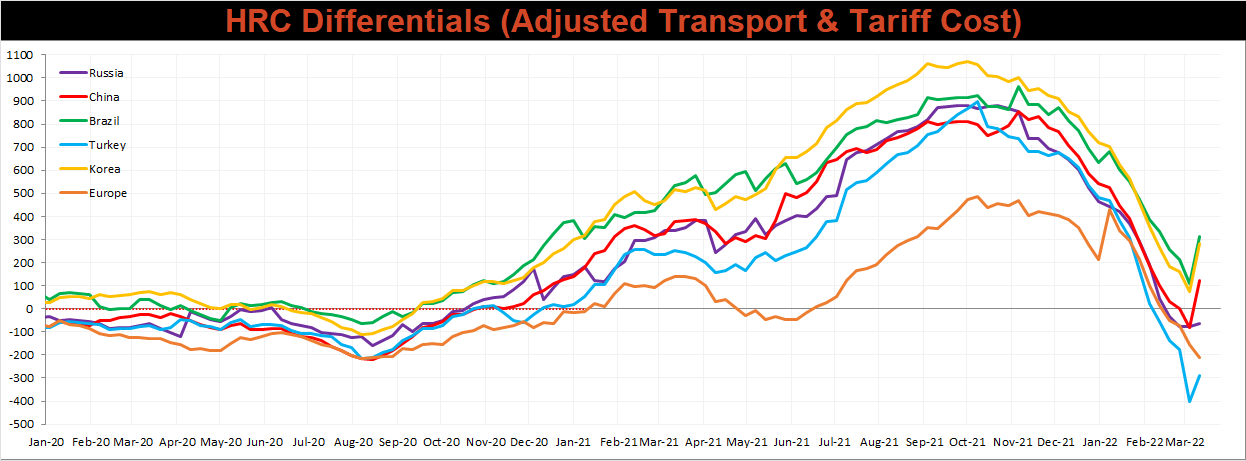
Below is the Midwest HRC price vs. each listed country’s export price using pricing from SBB Platts. We have adjusted each export price to include any tariff or transportation cost to get a comparable delivered price. The Midwest price finally reacted to recent global upward pressure, which led to a significant increase in differentials, except for in the E.U., where their prices increased more significantly.
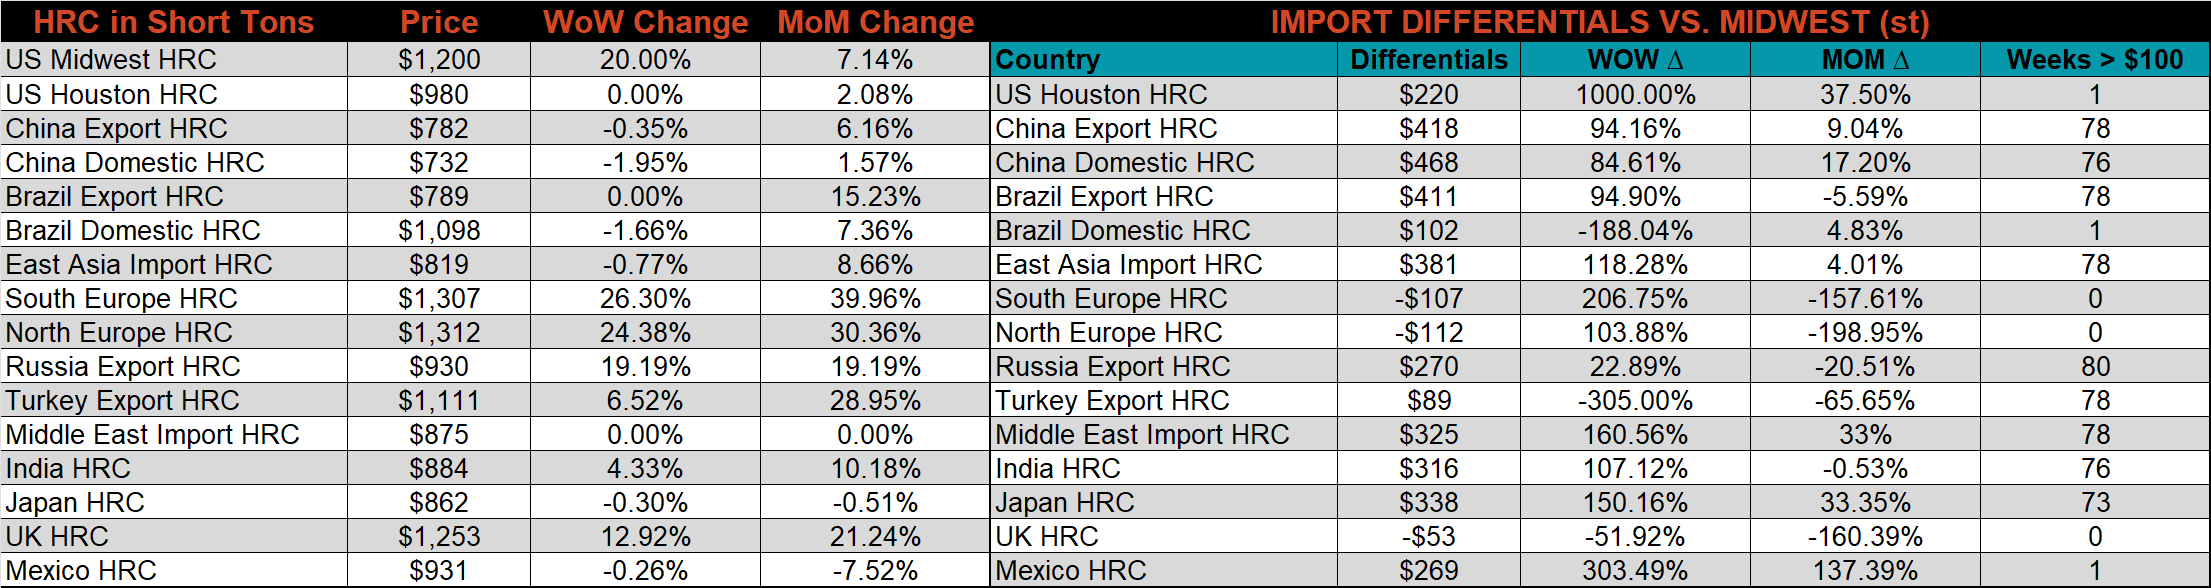
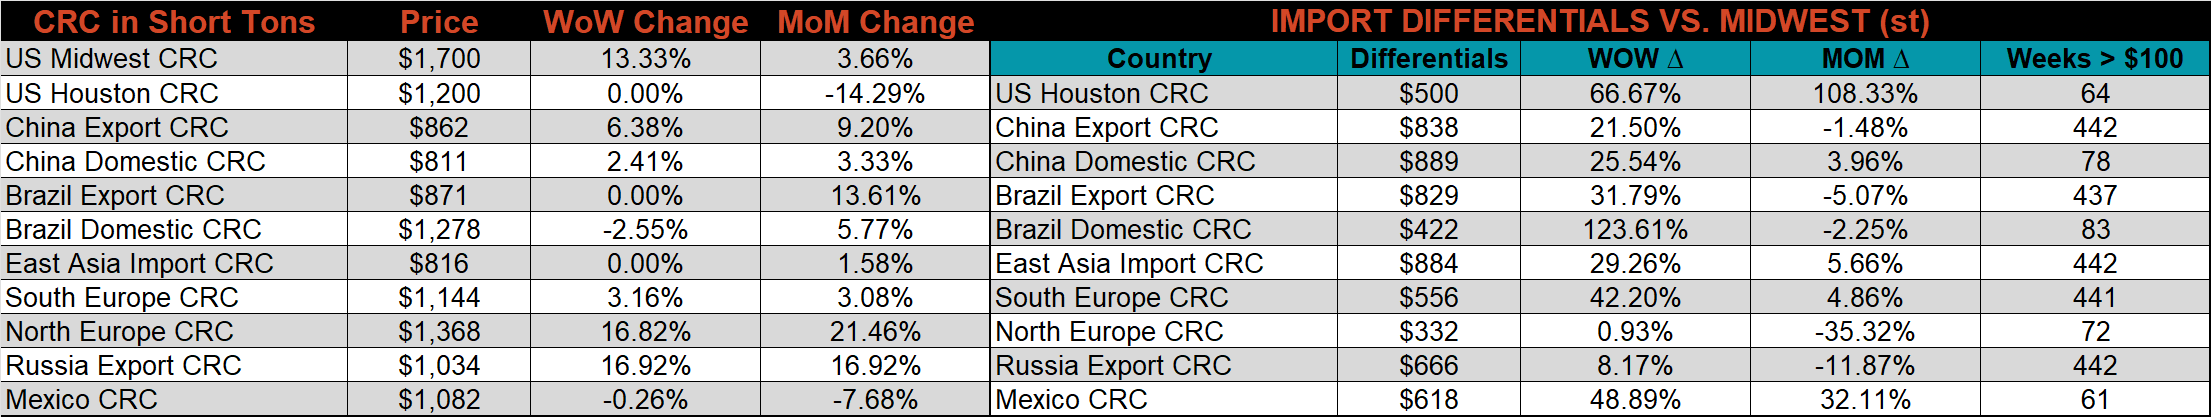
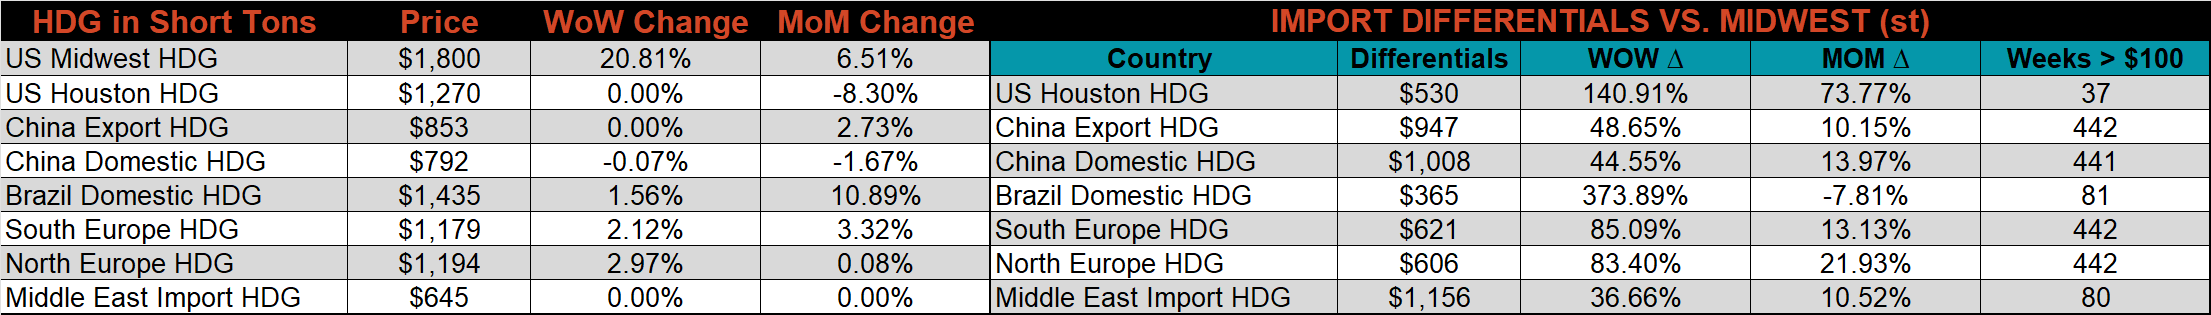
SBB Platt’s HRC, CRC and HDG pricing is below. The Midwest HDG, HRC, and CRC prices were all significantly higher last week, 20.8%, 20%, and 13.3%, respectively. Outside of the U.S., global prices were mostly higher again, led by the South European HRC, up, 26.3%.
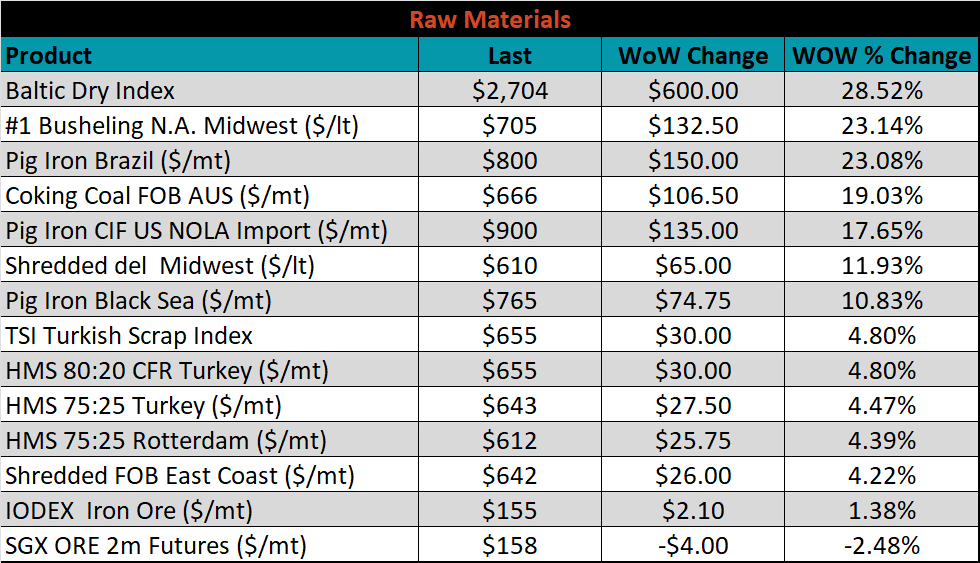
Raw material prices jumped higher again this week, led by Midwest busheling, up 23.1%. The only price from this section to move lower were iron ore futures, which lost 2.5%.
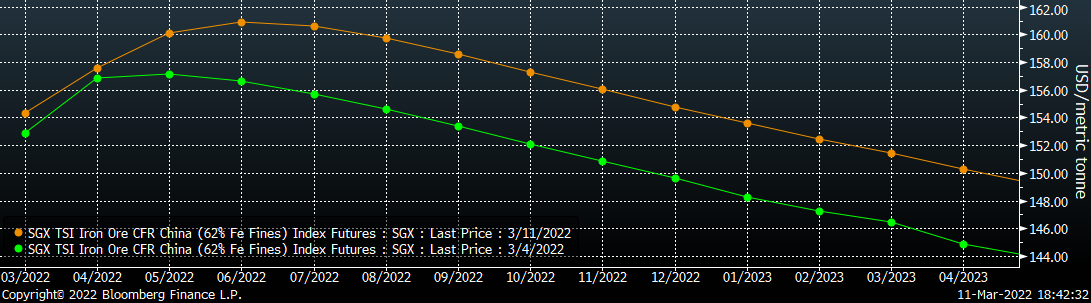
Below is the iron ore future curve with Friday’s settlements in orange, and the prior week’s settlements in green. Last week, the entire curve shifted higher, more significantly in the later expirations.
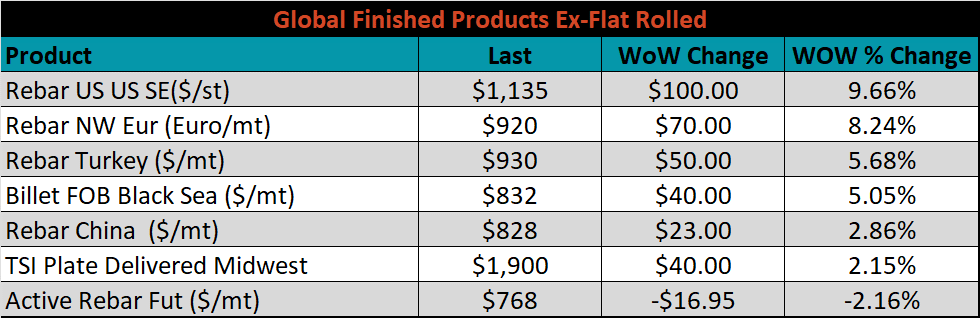
The ex-flat rolled prices are listed below.

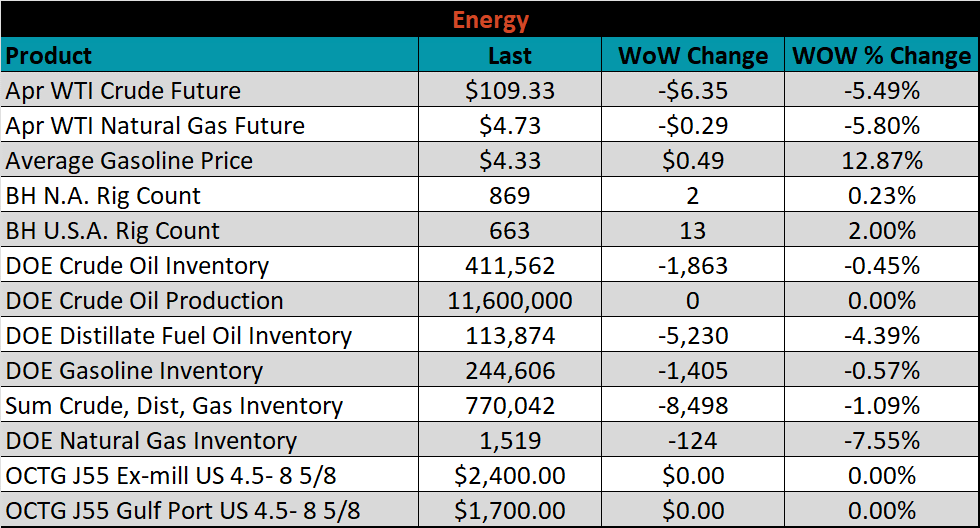
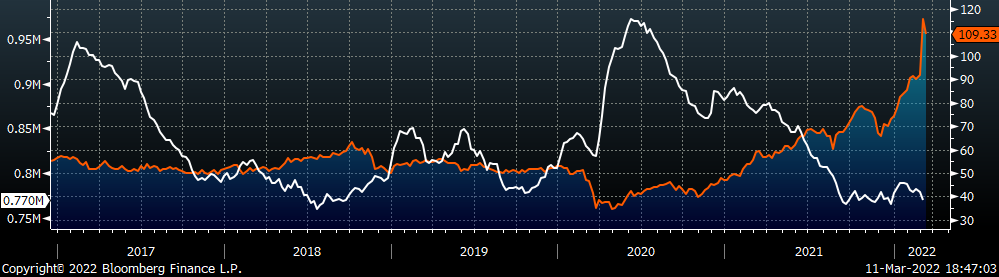
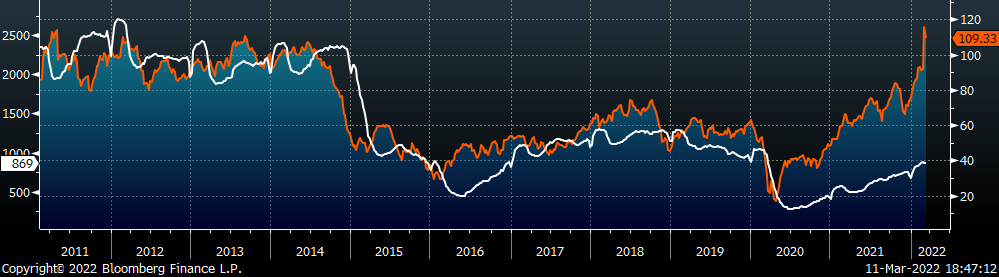
Last week, the April WTI crude oil future lost $6.35 or 5.5% to $109.33/bbl. The aggregate inventory level was down 1.1%, while crude oil production remains at 11.6m bbl/day. The Baker Hughes North American rig count was up 2 rigs, and the U.S. rig count was up 13 rigs.
The list below details some upside and downside risks relevant to the steel industry. The bolded ones are occurring or highly likely.
Upside Risks:
Downside Risks: