Content
-
Weekly Highlights
- Market Commentary
- Durable Goods
- Risks


During times of extreme volatility, panic and uncertainty, fundamentals are disregarded and assets trade based on sentiment, credit availability, and margin account stress. We have seen this as gold and bond prices moved lower at the same time as equities and commodities, which is an abnormality in standard financial market relationships. The domestic future curve was not spared, and dropped approximately $80/st over the last month.
However, the spot price has remained elevated because the fundamentals still matter in the spot market. While the actual transactions have been sparse, lead times are extended, order books are currently full, and there is limited spot availability. Mills continue to hold offers at or above $600 for HRC, despite the crumbling demand outlook and lack of new orders. Additionally, with energy prices collapsing and automotive production shutdowns, mills will likely face cancelations, but seem oblivious to the holes this will create in their order books as they refuse to negotiate lower spot prices. This could be due to timing and the uncertain scrap outlook, as mills do not want to drop prices until they have a better grasp on where scrap will trade next month. As we look at future expectations for scrap and HRC prices, we will look to the changing fundamental outlook to help with forward curve price discovery.
The ferrous future curves are not only a display of future expectations, but they also display timing of the changing fundamental outlook. However, with the uncertainty surrounding the coronavirus duration and size of the impact on the steel market, the curves could trade in a wide range. Some historic relationships should guide the limits of these ranges. For example, due the spread between scrap and HRC, called the metal spread, is a relationship that trades in a range due to the correlation of the two commodity prices. The below chart shows the historical relationship, removing the 2018 peak in HRC prices in order to display the fundamental relationship.
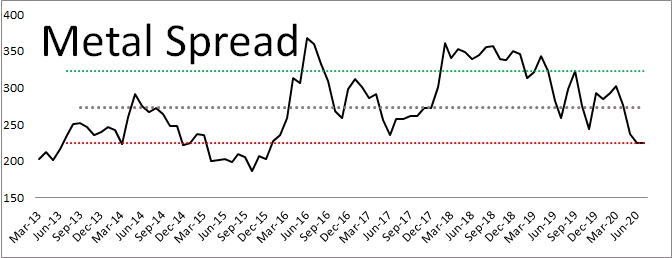
Both the busheling and HRC forward curves are used to project the metal spread through June, where it reaches the red line at one standard deviation below average. While the spread trades in a wide range, it is mean reverting because of the supply and demand dynamics in the ferrous market. A low metal spread signals mill are less profitable and supply is reduced through production cuts. Based on the current scrap outlook, there is not much more room for the HRC future curve to fall.
Additionally, as the expectations for demand and future pricing decline, upside price risks are growing. It is possible that the coronavirus spread forces mills to shut down mills, just as it has for automotive plants. From a public policy perspective, the chances of an infrastructure bill have increased as the costs to borrow have declined. There will be political pressure to stimulate employment and growth if the economy moves into a recession. The risk/reward ratio, based on the current future curve, is skewed to the upside, and those with future physical steel needs should take advantage of these cheap prices.
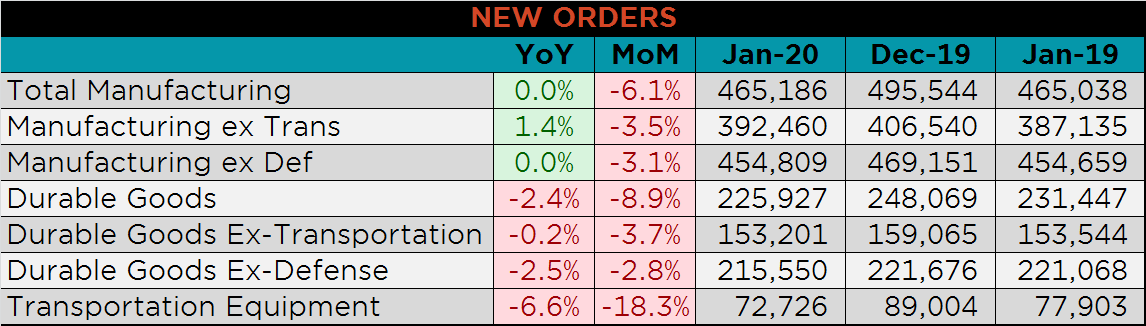
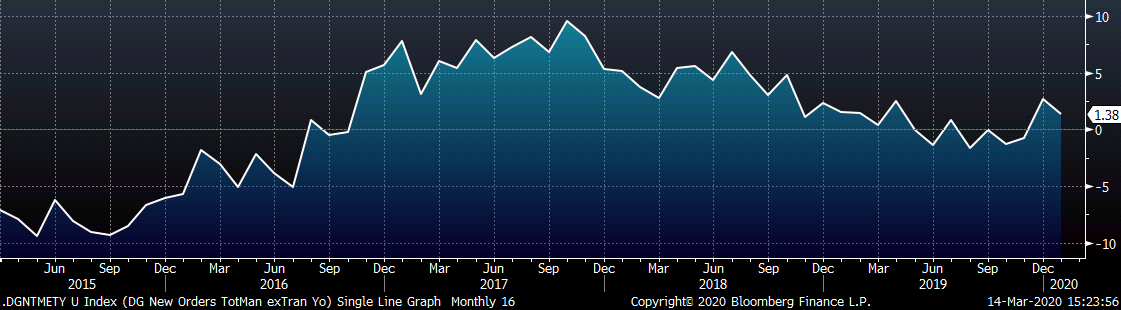
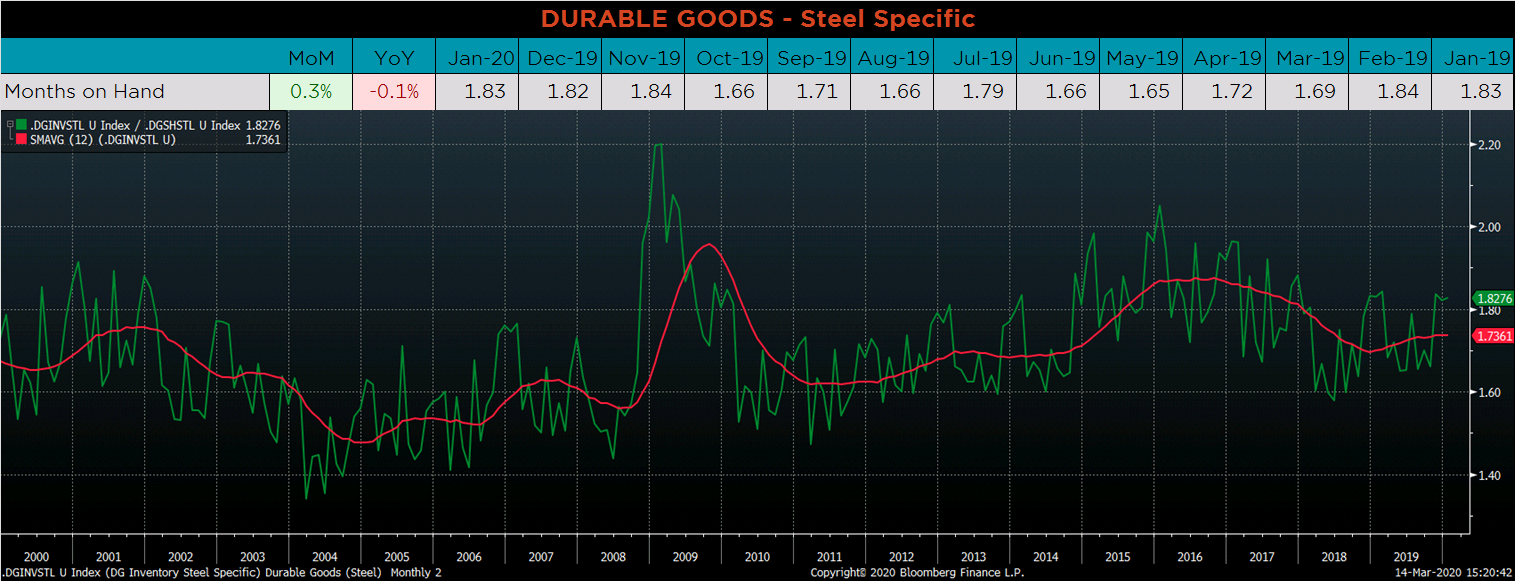
Below are final January new orders from the Durable Goods report. Overall, new orders for Durable Goods were lower MoM, and flat YoY. Manufacturing new orders ex-transportation increased compared to January 2019. The final chart looks at the months on hand (inventory divided by shipments) for durable goods categories that are steel intensive. MOH increased slightly as monthly inventories increased more than shipments.
Below are the most pertinent upside and downside price risks:
Upside Risks:
Downside Risks:
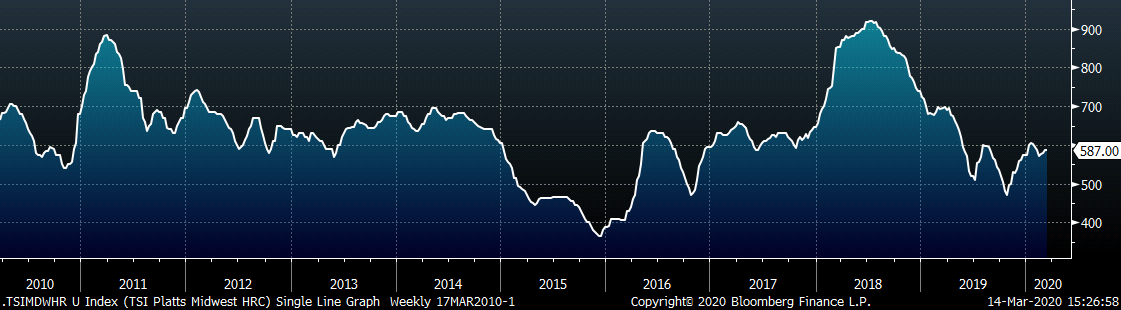
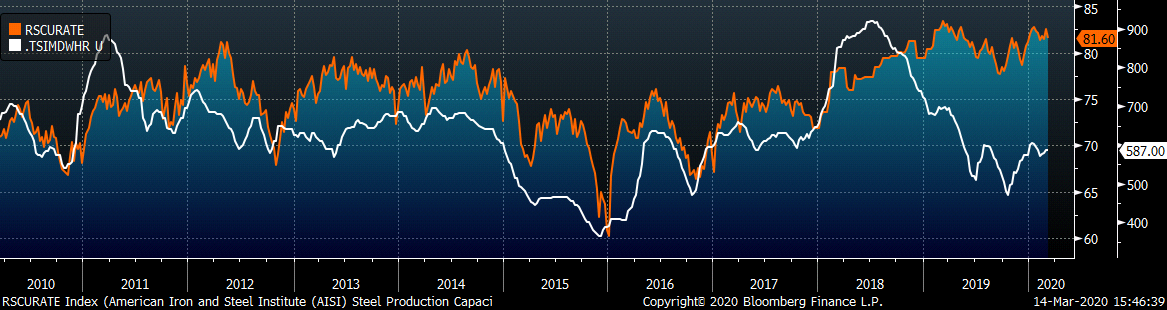
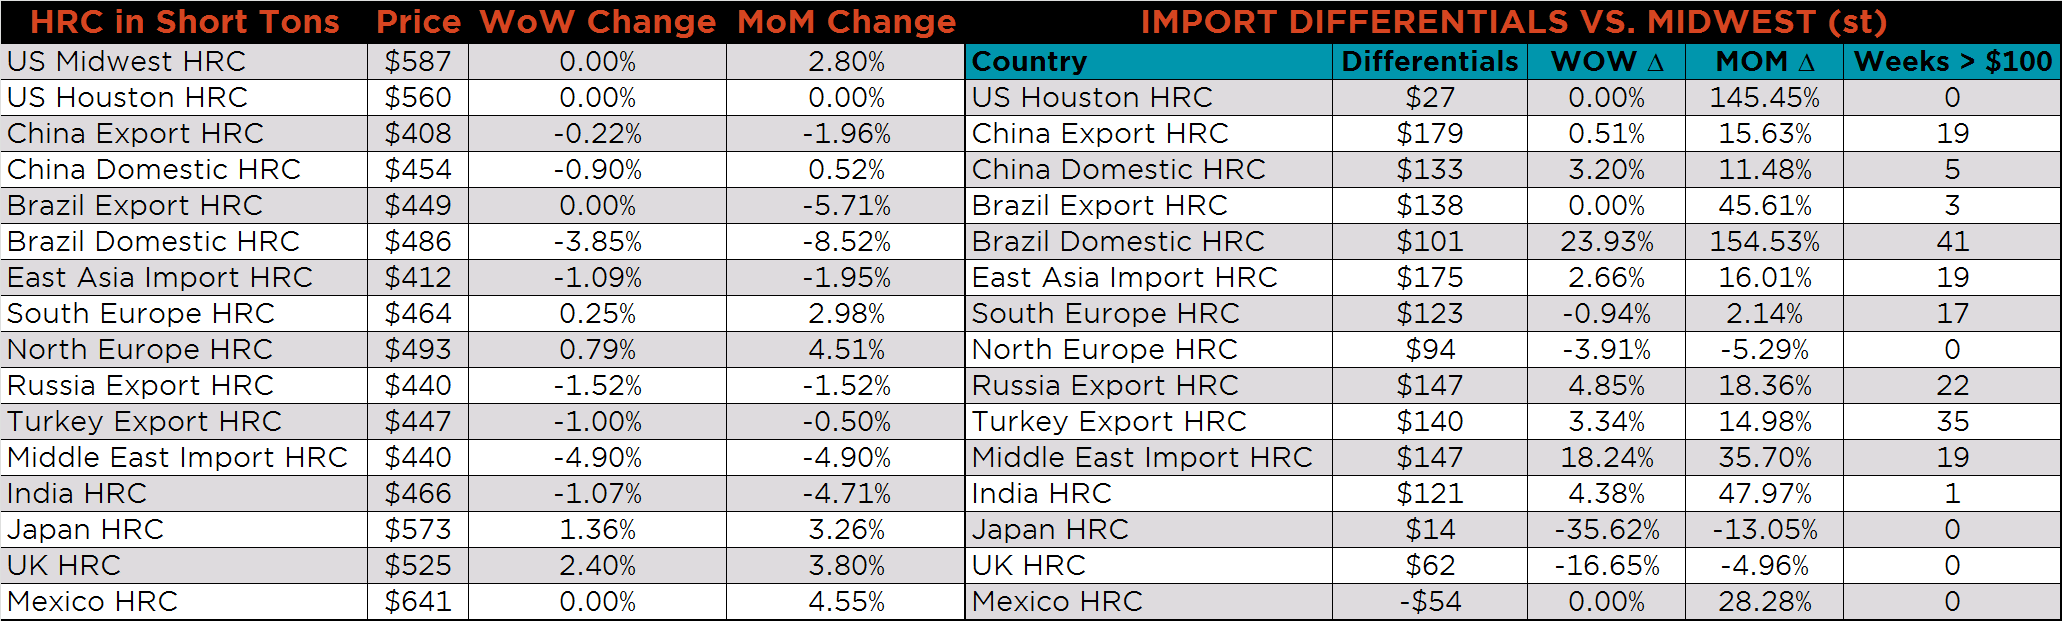
The Platts TSI Daily Midwest HRC Index was flat at $587.
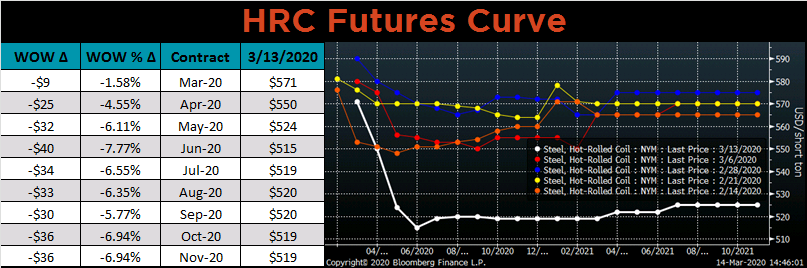
The CME Midwest HRC futures curve is below with last Friday’s settlements in white. The entire curve moved down dramatically as uncertainty around the impact of coronavirus in the U.S. reset the 2020 outlook.
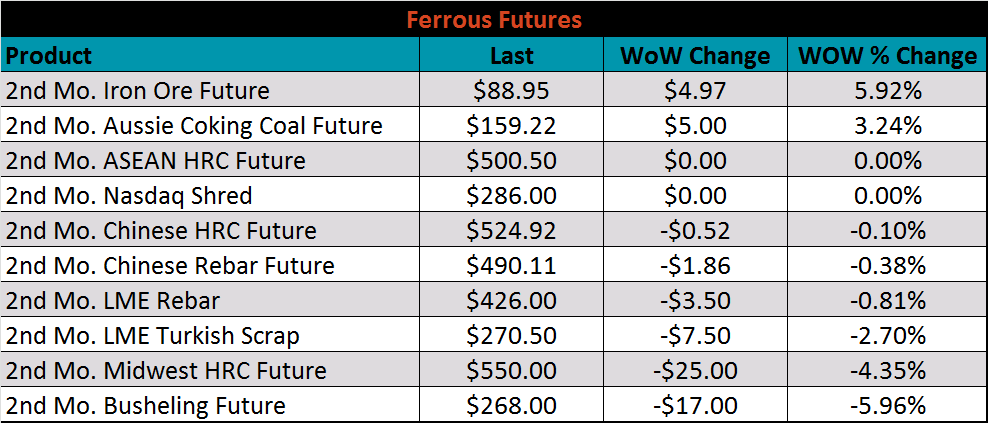
March ferrous futures were mixed. The busheling future lost 6%, while the iron ore future gained 5.9%.
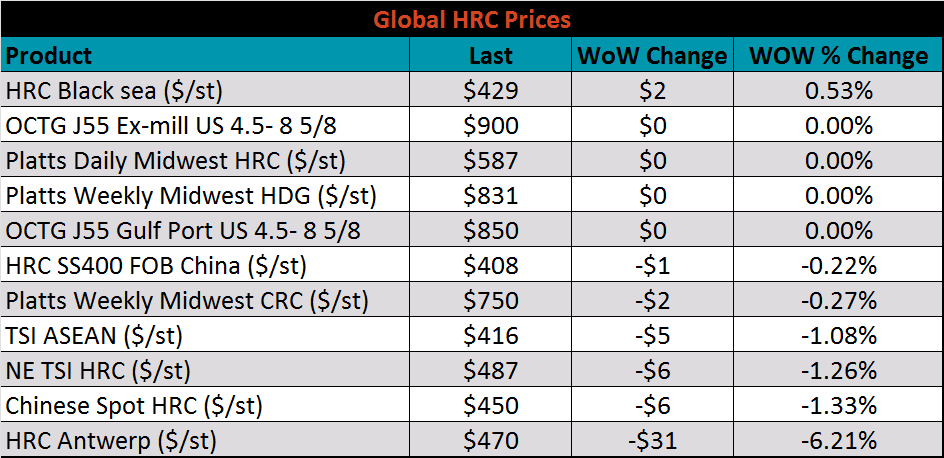
The global flat rolled indexes were mostly lower. Black Sea HRC was up 0.5%, while Antwerp HRC was down 6.2%.
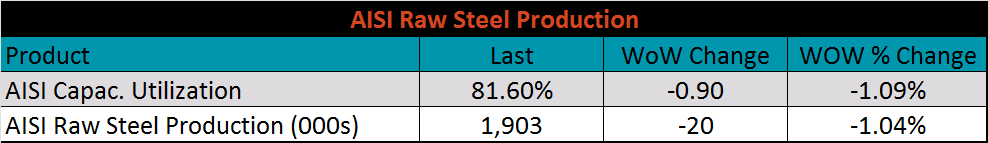
The AISI Capacity Utilization Rate was down 0.9% to 81.6%.
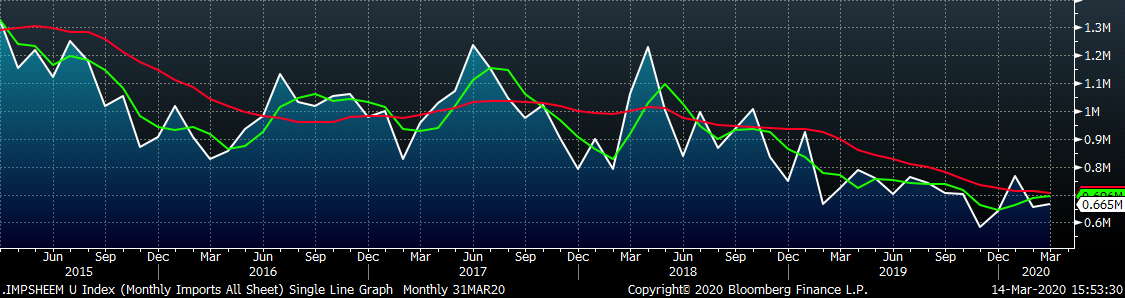
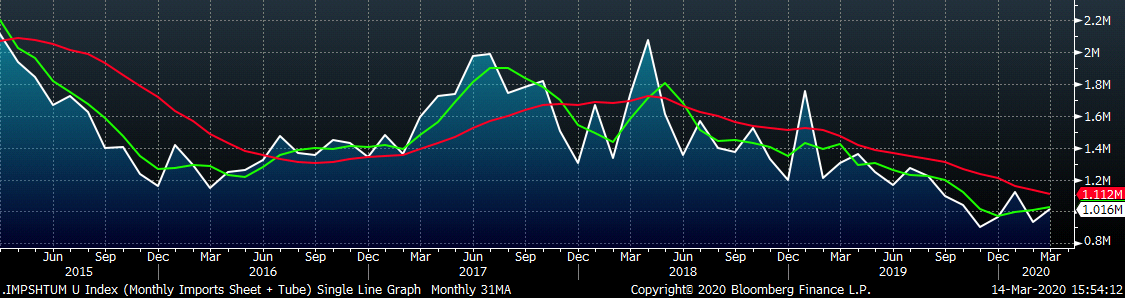
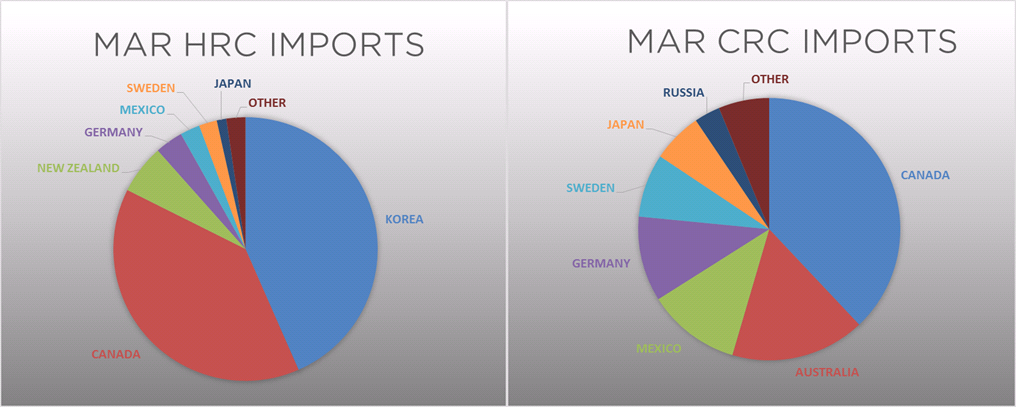
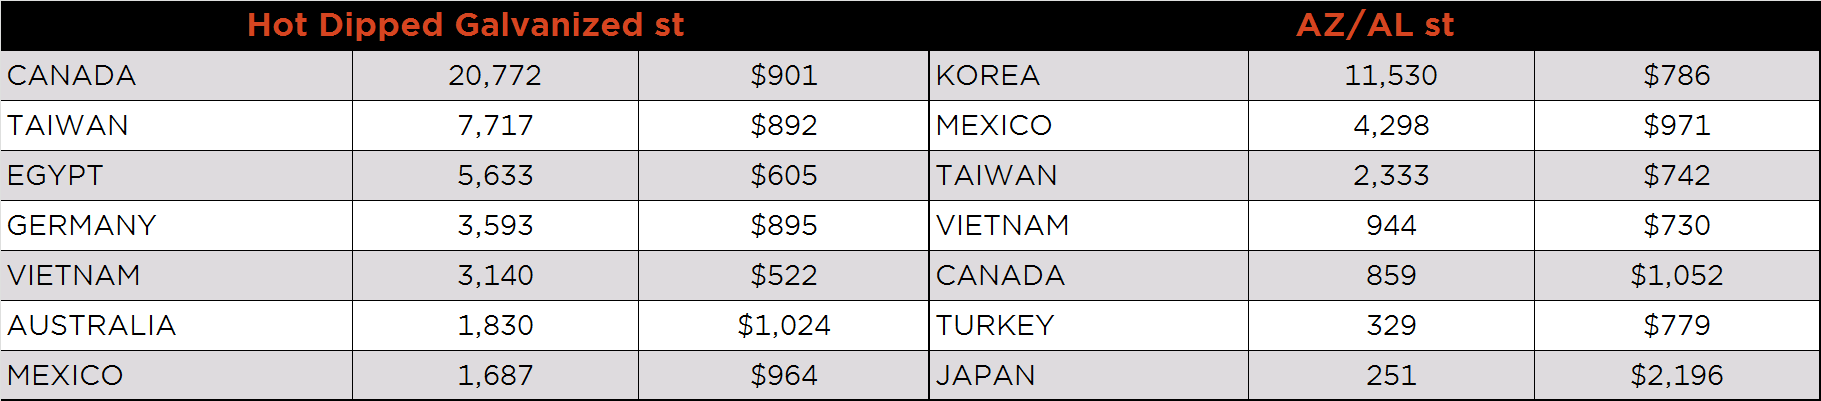
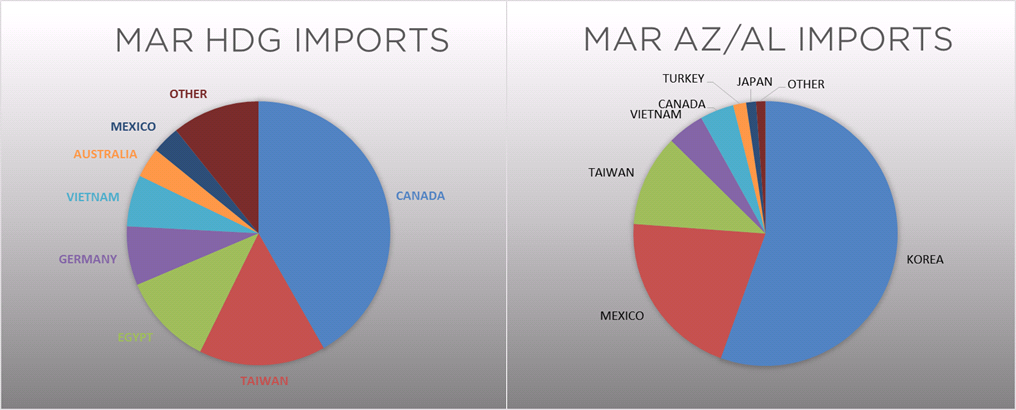
March flat rolled import license data is forecasting an increase of 8k to 665k MoM.
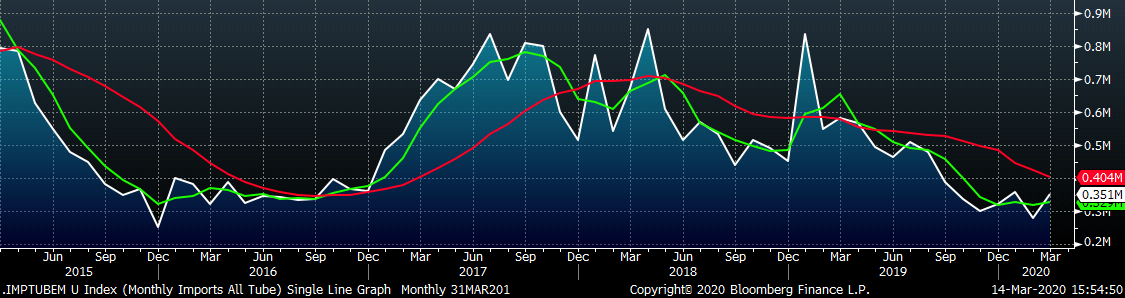
Tube imports license data is forecasting a MoM increase of 72k to 351k tons in March.
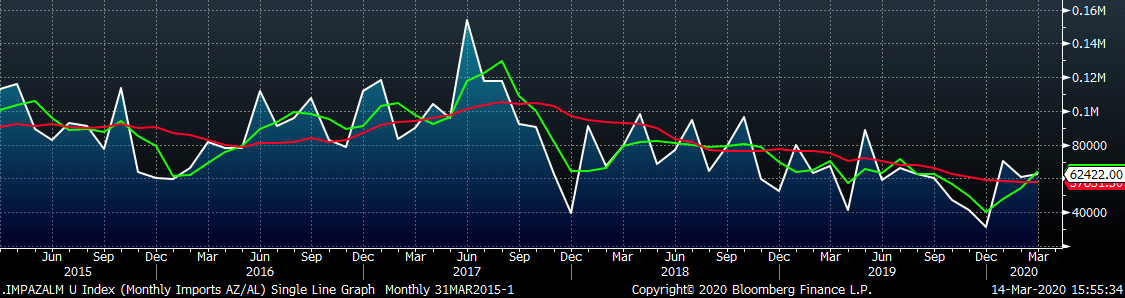
AZ/AL import license data is forecasting an increase of 2k in March to 62k.
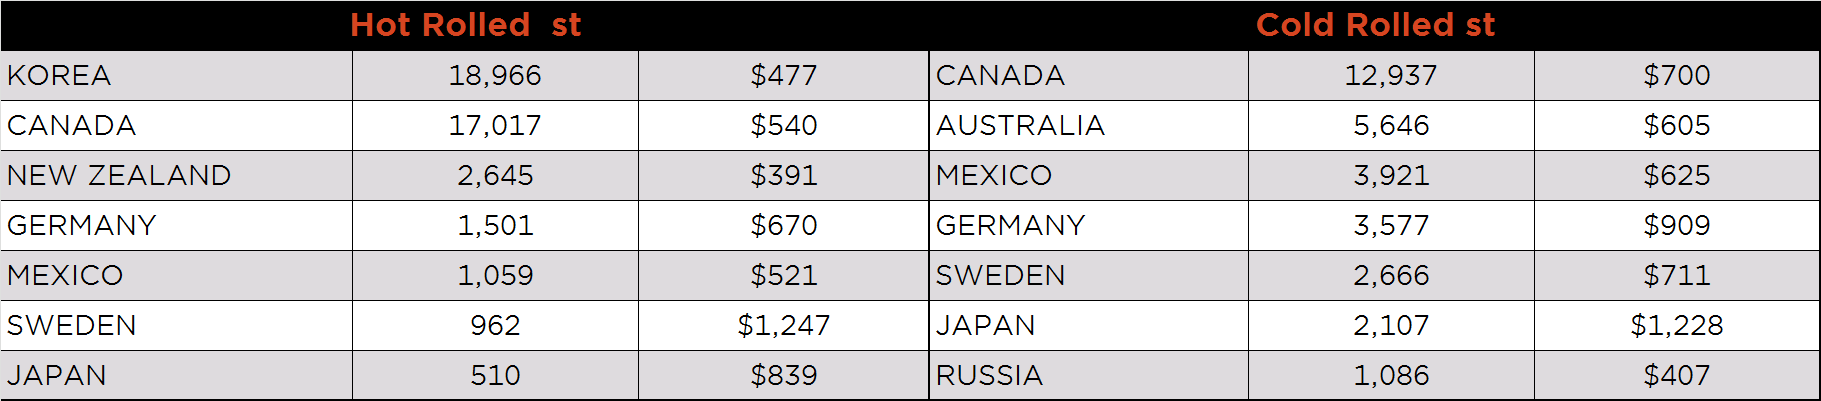
Below is February import license data through March 10, 2020.
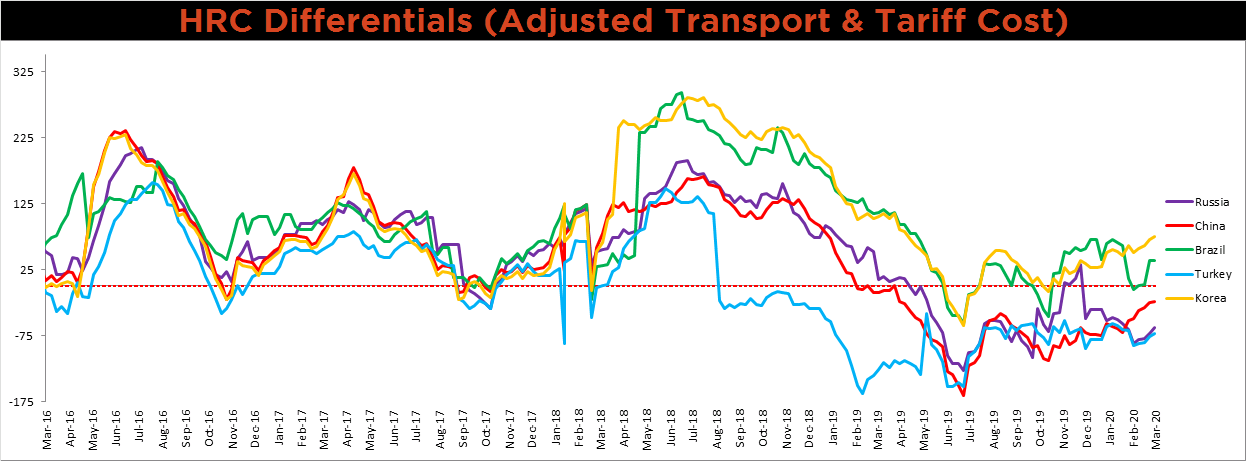
Below is the Midwest HRC price vs. each listed country’s export price using pricing from SBB Platts. We have adjusted each export price to include any tariff or transportation cost to get a comparable delivered price. All of the differentials rose with the exception of the Brazilian, which was flat after a significant increase last week.
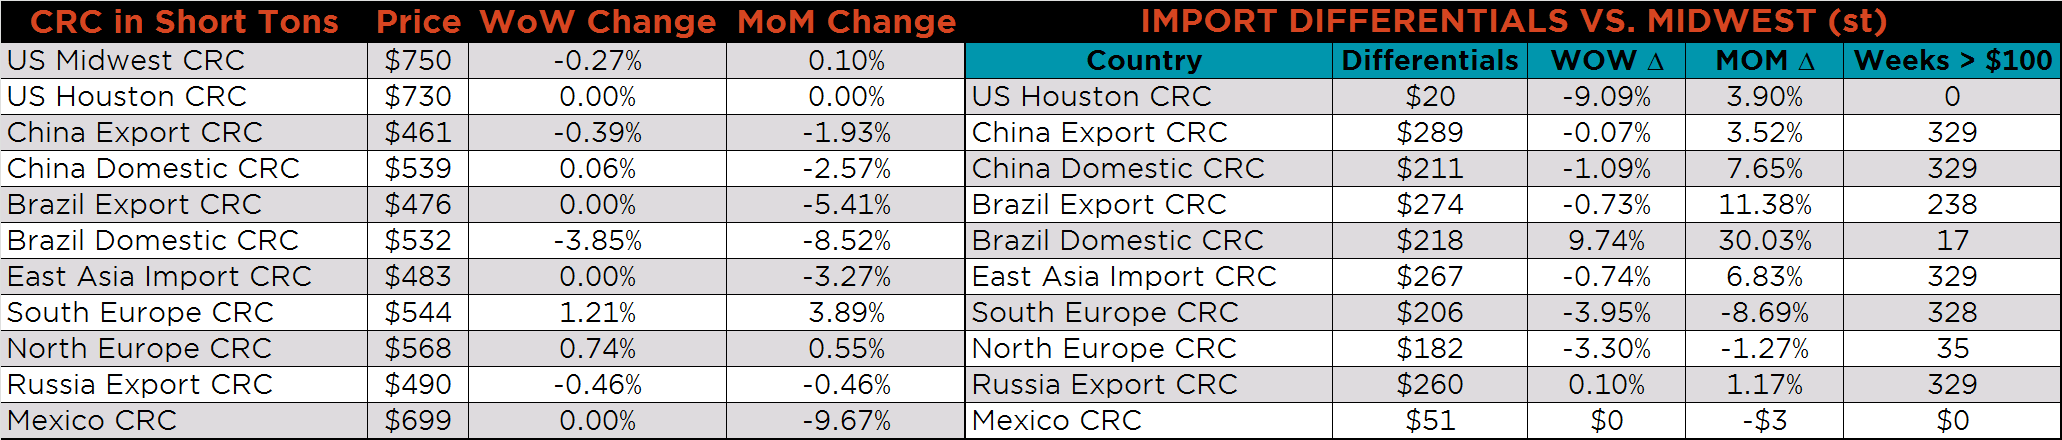
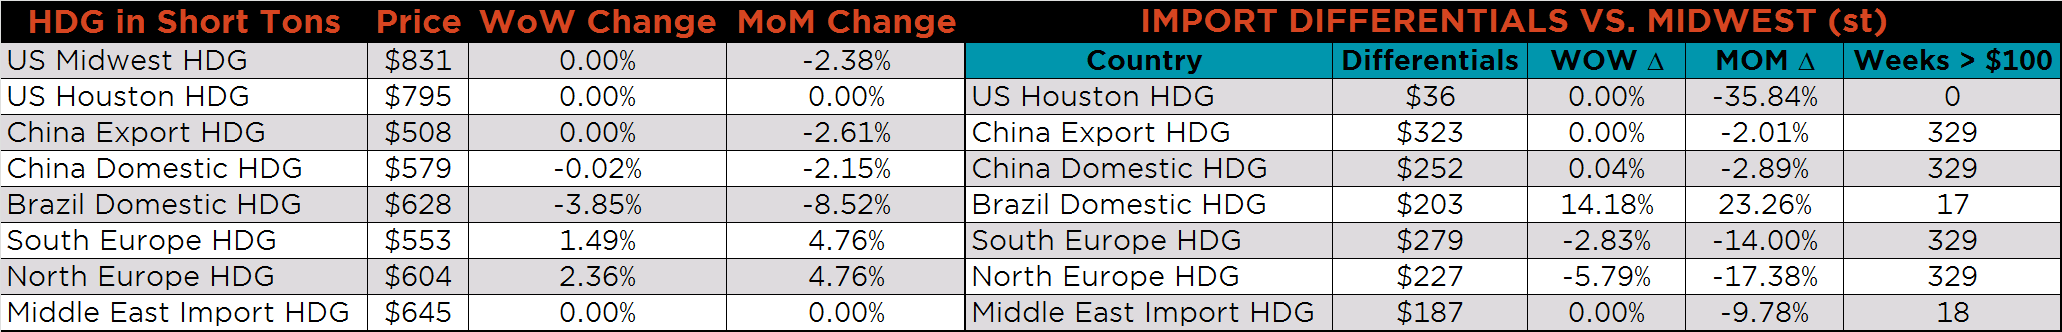
SBB Platt’s HRC, CRC and HDG pricing is below. The Midwest HRC and HDG prices were flat, while the CRC price was 0.3% lower. The Russian HRC price was down 1.5%.
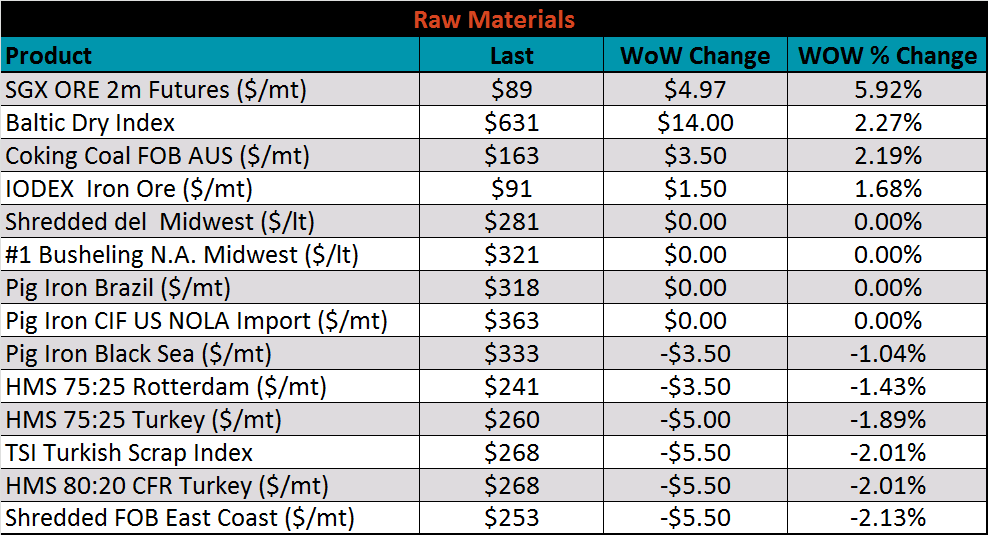
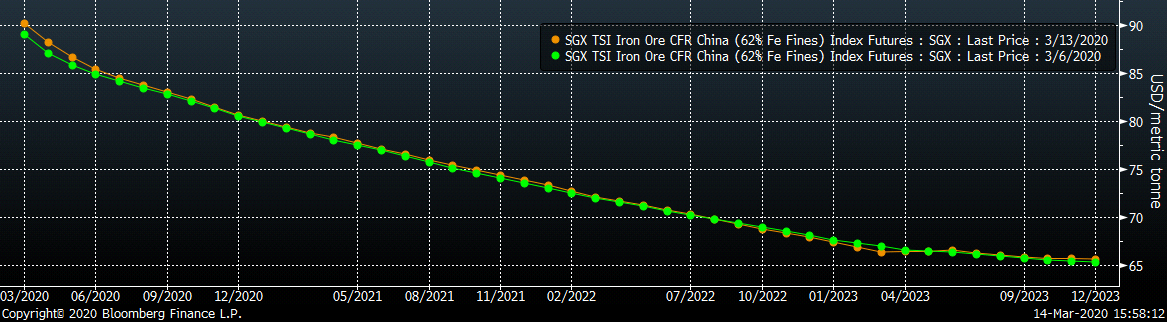
Raw material prices were mixed, the iron ore future gained 5.9%, while East Coast shredded was down another 2.1%.
Below is the iron ore future curve with Friday’s settlments in orange, and the prior week’s settlements in green. The front of the curve shifted slightly higher.
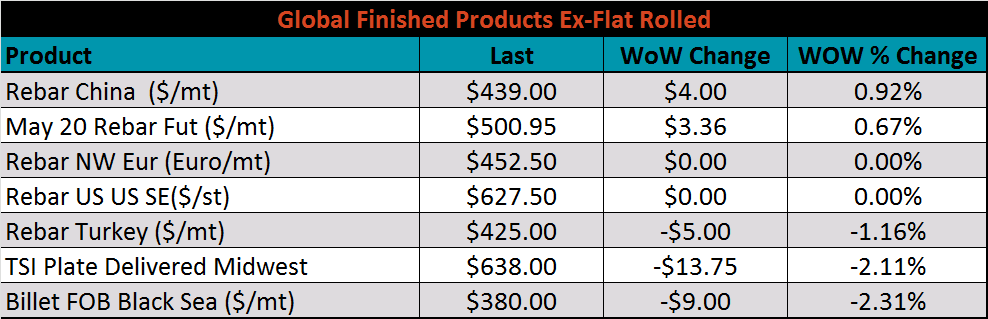
The ex-flat rolled prices are listed below.

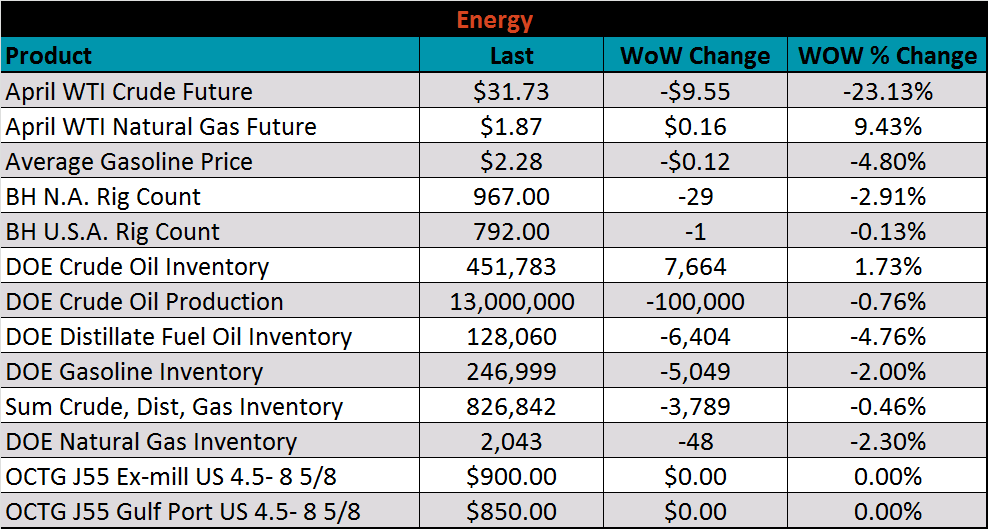
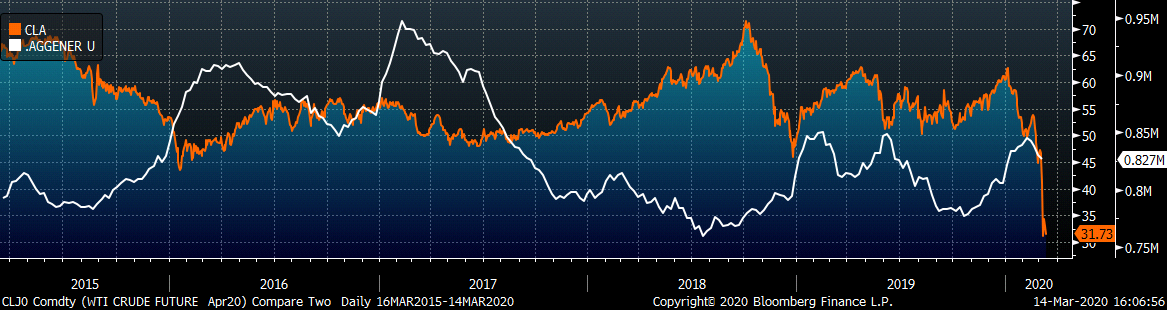
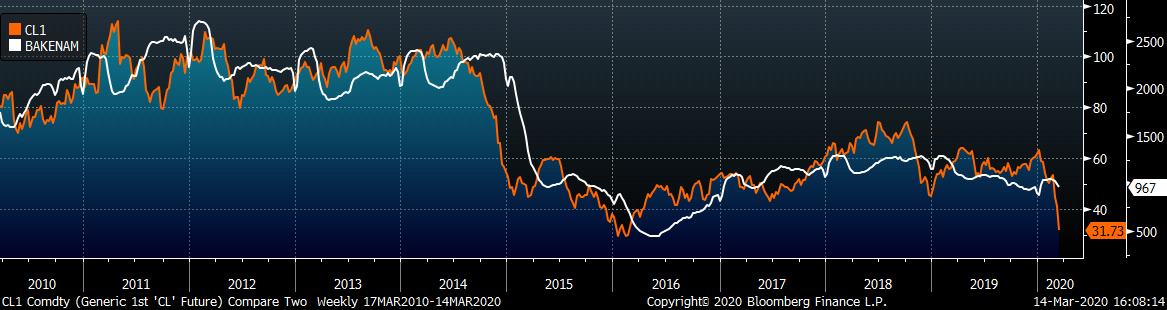
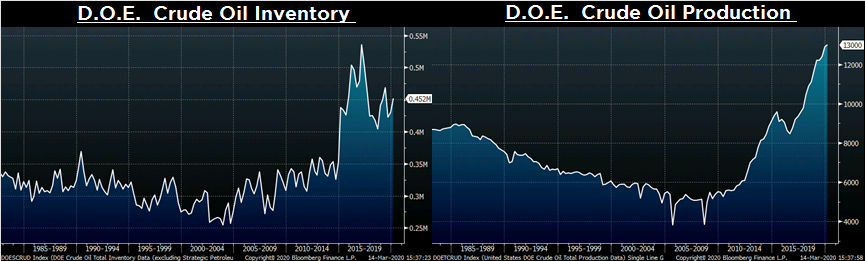
Last week, the April WTI crude oil future lost another $9.55 or 23.1% to $31.73/bbl. The aggregate inventory level was down 0.5% and crude oil production dipped to 13m bbl/day. The Baker Hughes North American rig count was down 29 rigs, while the U.S. rig count was down one rig. Without a recovery in oil prices, rig counts and production will decline in the months ahead, as the market is oversupplied at this price level.
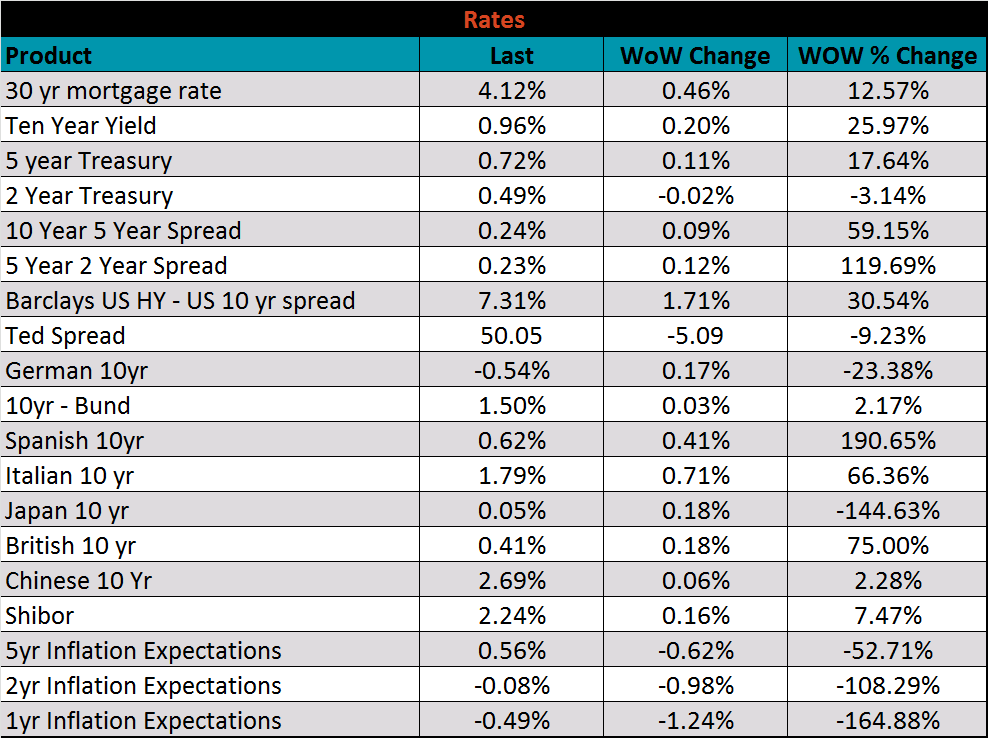
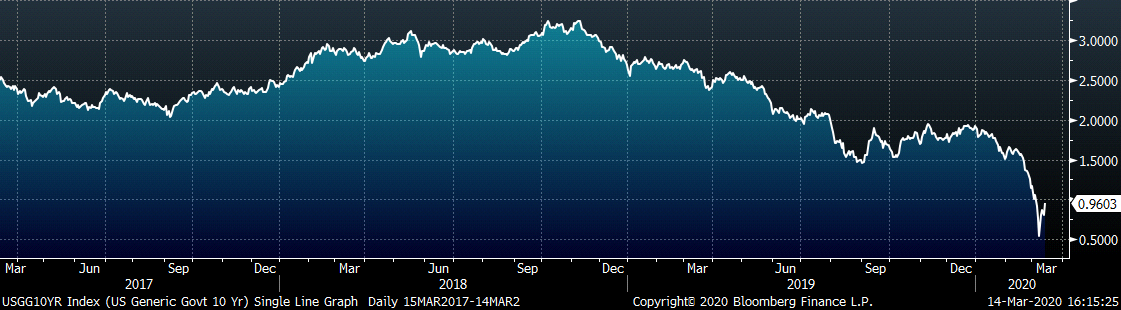
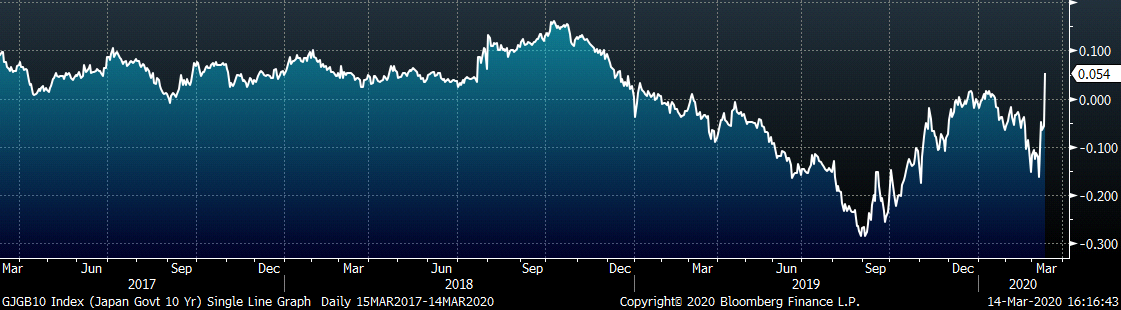
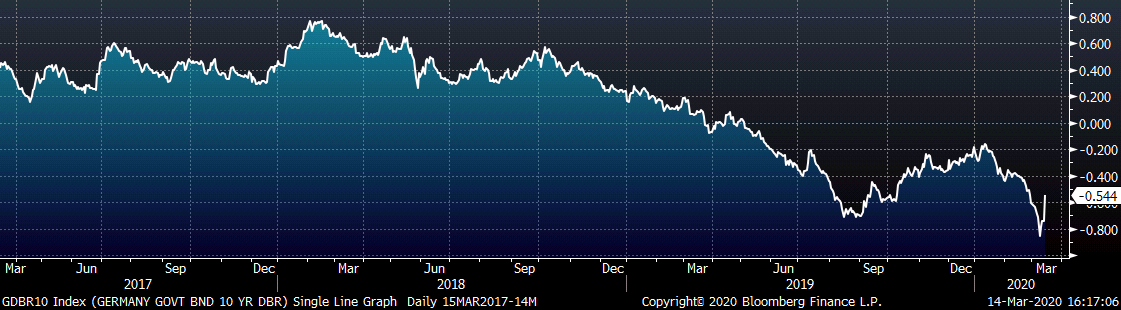
The U.S. 10-year yield was up 20 bps, closing the week at 0.96%. The German 10-year yield was up 17 bps to minus 0.54% while the Japanese 10-year yield was up 18 bps to 0.05%. Inflation expectations continue to move lower, signaling the headwinds for economic growth.
The list below details some upside and downside risks relevant to the steel industry. The orange ones are occurring or look to be highly likely. The upside risks look to be in control.
Upside Risks:
Downside Risks: