Content
-
Weekly Highlights
- Market Commentary
- Construction Spending
- Risks


Flat rolled price direction remains unclear. For instance, the sizable and sequential drop in service center inventory looks to be in response to the sharp drop in flat rolled prices in Q4. A number of problems, primarily breaching or getting close to breaching lending covenants, have resulted in service centers taking a risk-off approach and withdrawing funds from the steel market. Flat rolled inventory is down to the lowest level since Q3 2017, which has historically been a decent indication that prices will rally in coming months, especially with import levels so low. This bullish indicator is predicated on service centers restocking and this could happen as soon as Q2 once these firms have cleaned up their balance sheets and taken control of QoQ financial metrics and covenant risk. However, the shift to lower inventory levels could also be in response to a general economic slowdown in the major steel consuming construction, automotive and energy industries.
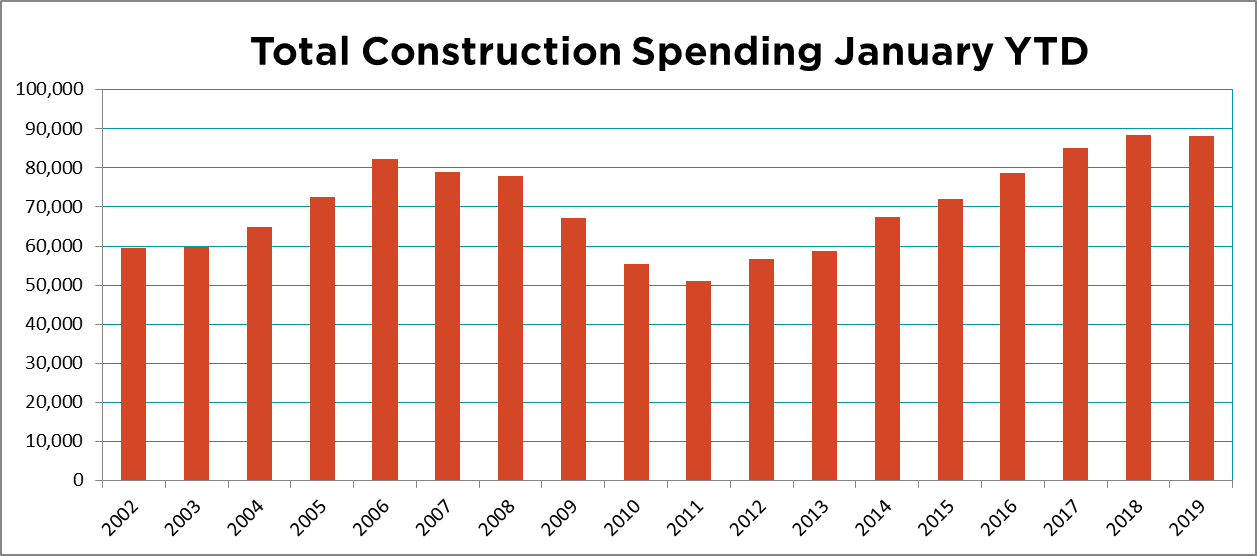
Last week’s economic data showed further evidence of a slowing manufacturing economy. U.S. construction spending had shown relentless YoY growth since 2011. That trend has definitely ended and this supports the notion that the steel industry is not only feeling, but also reacting to this slowdown in demand. Further, that this slowdown is colliding with increased steel production and production capacity.
Continue to proceed with caution.
Seasonally adjusted January U.S. construction spending was up a better than expected 1.3% MoM and 0.3% YoY.
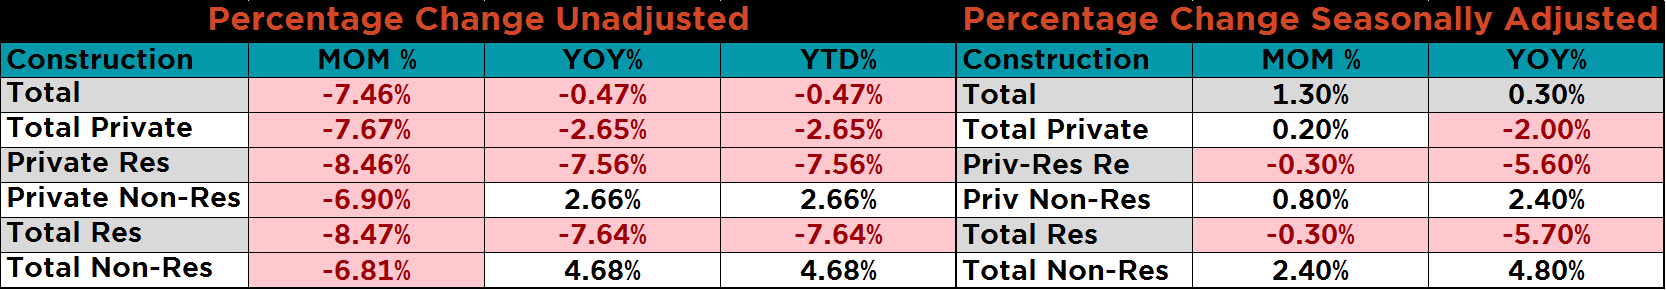
However, unadjusted January total construction spending was down 0.5% YoY indicating a weakening picture.
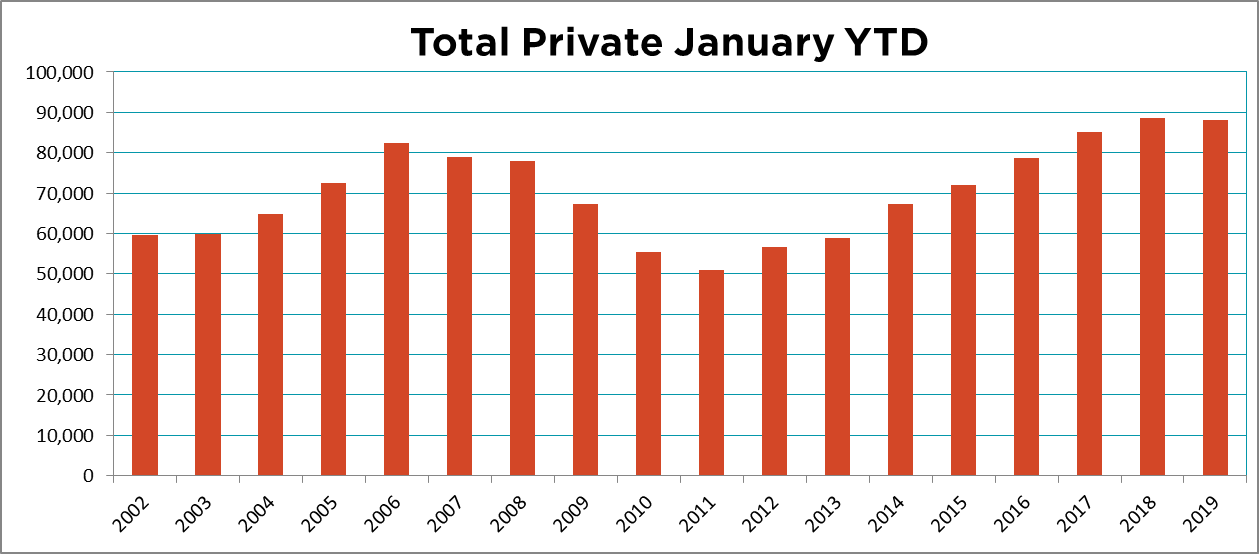
Unadjusted January total private construction spending was down 2.7% YoY.
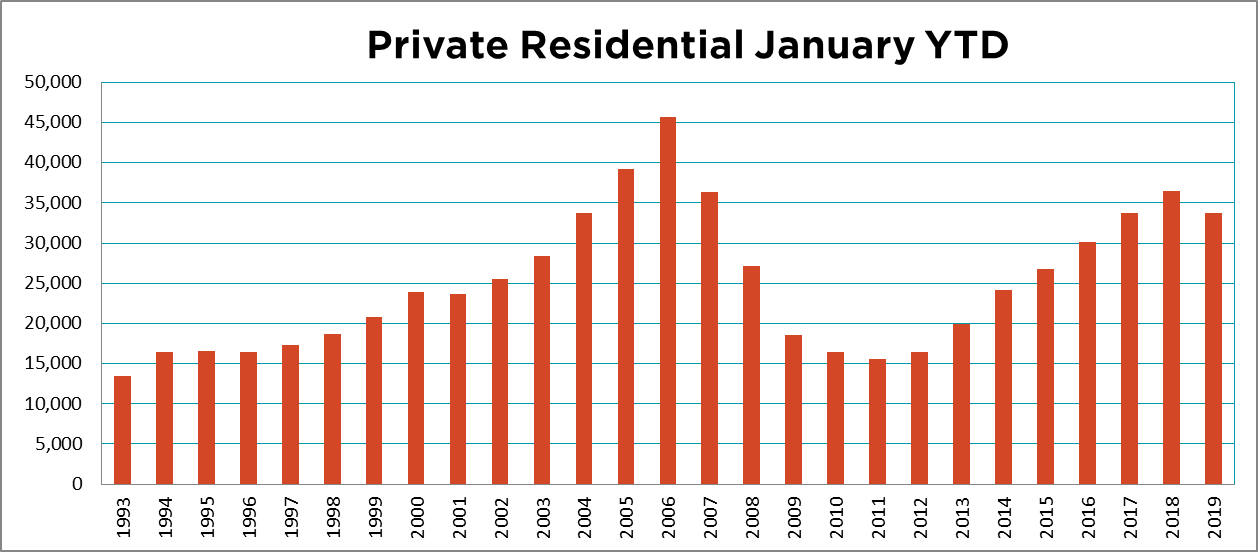
Unadjusted January private residential construction spending was down 7.6% YoY.
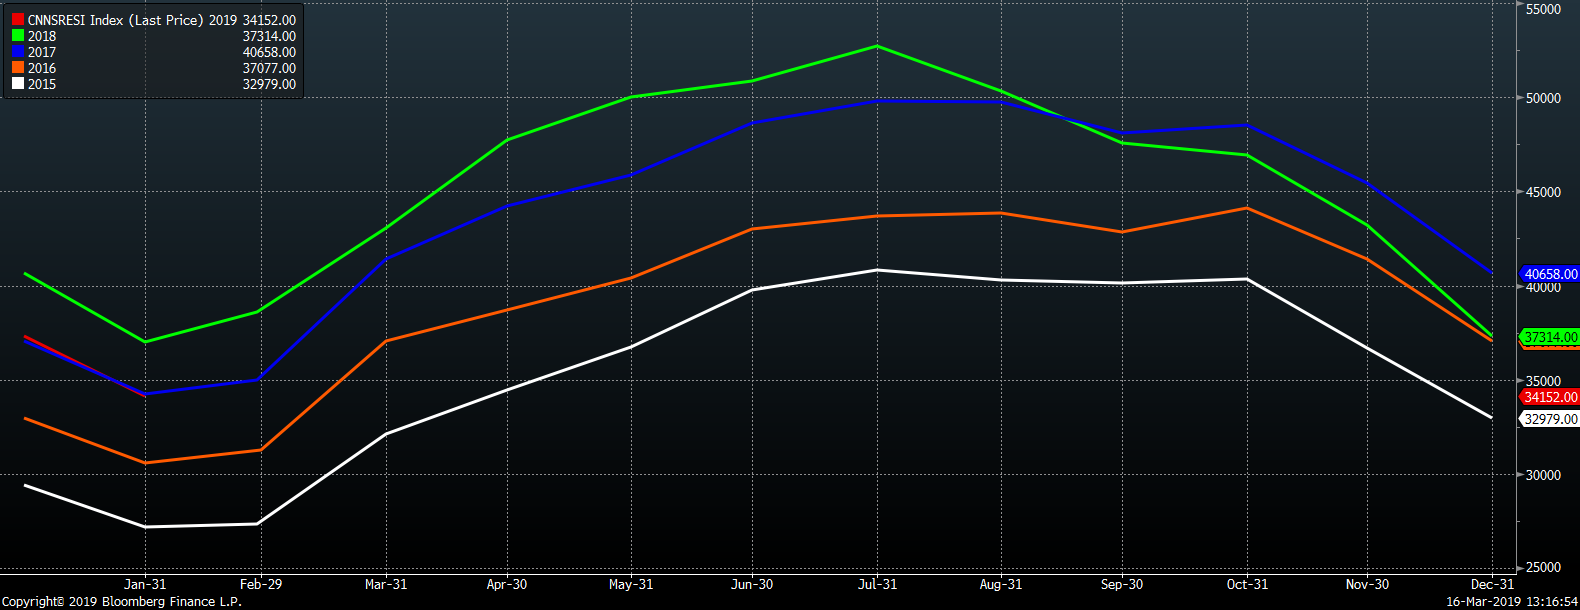
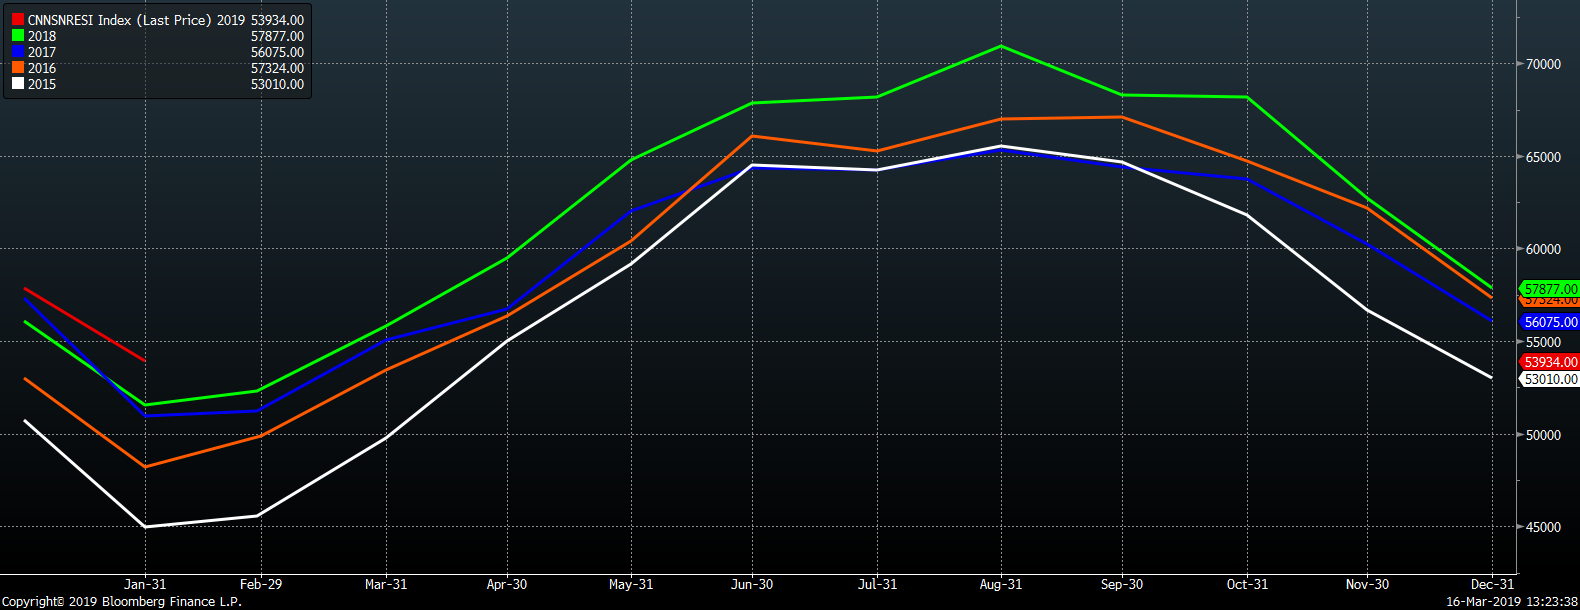
This seasonality chart shows monthly U.S. residential construction spending. Not only was YoY residential construction spending negative for the fifth straight month, but also the magnitude of the decrease is increasing.
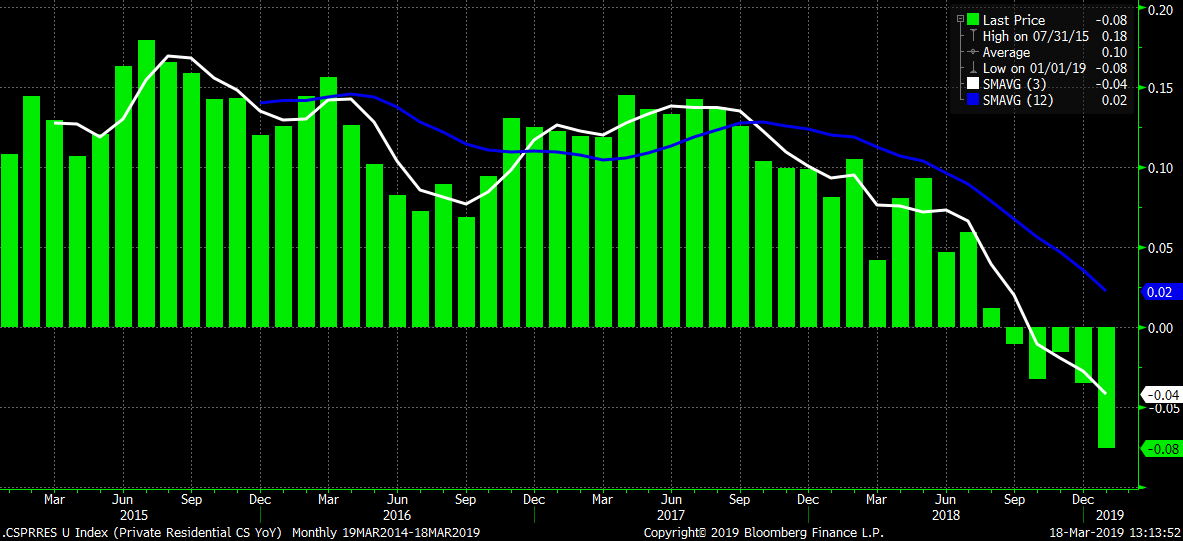
This chart shows the unadjusted private residential construction spending YoY percentage change accelerating lower with a 7.6% YoY decrease in January.
Unadjusted January private nonresidential construction spending was 2.7% higher YoY.
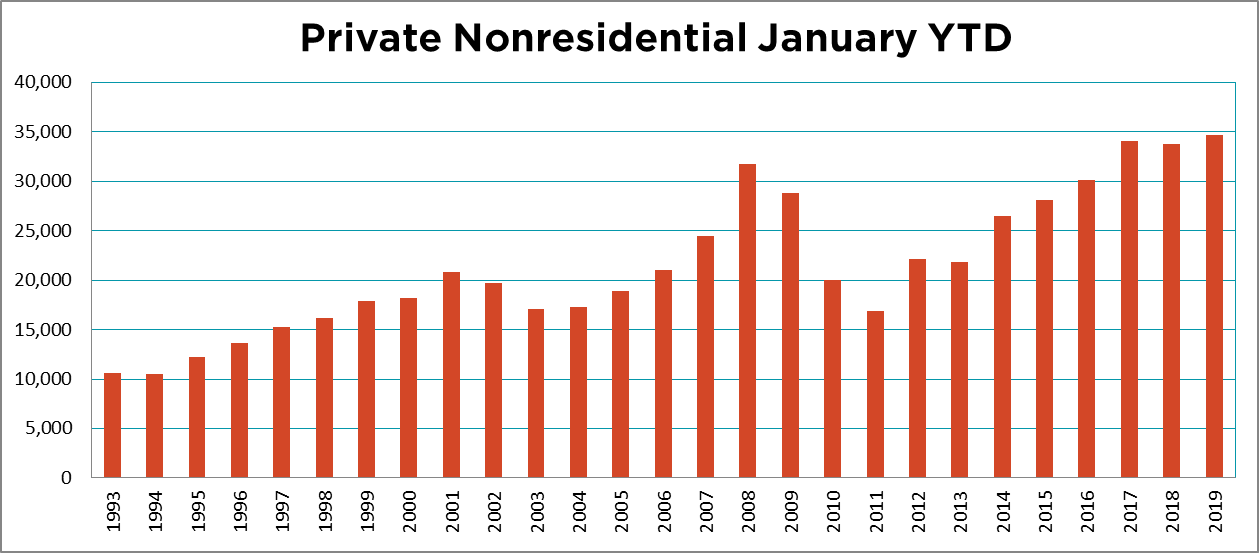
Unadjusted January U.S. nonresidential construction spending was up 4.7% YoY.
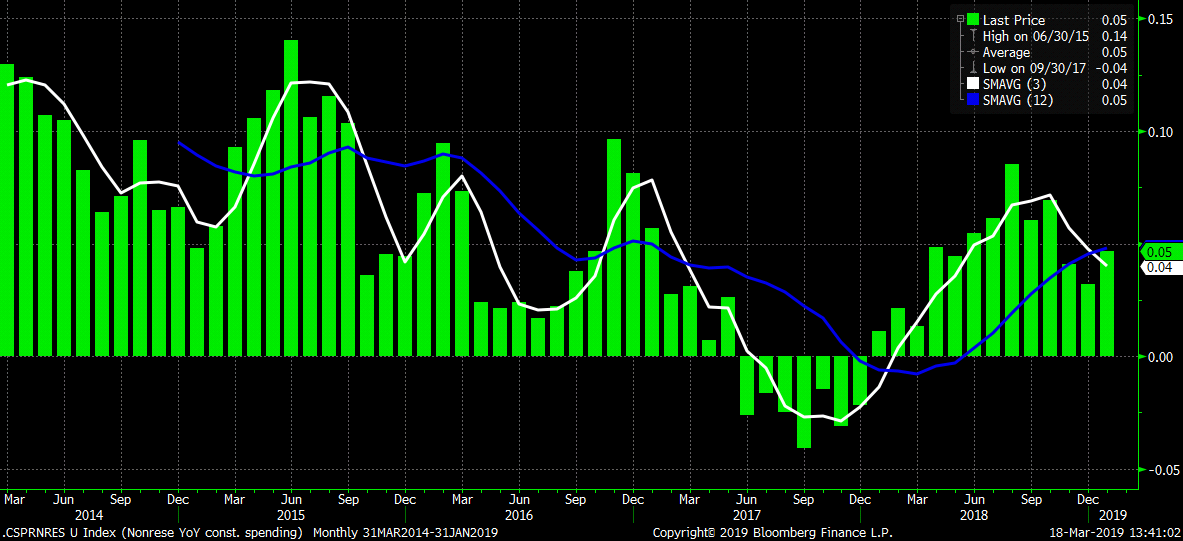
This chart shows the U.S. nonresidential construction spending NSA YoY percentage change with the 3-month average crossing below the 12-month average.
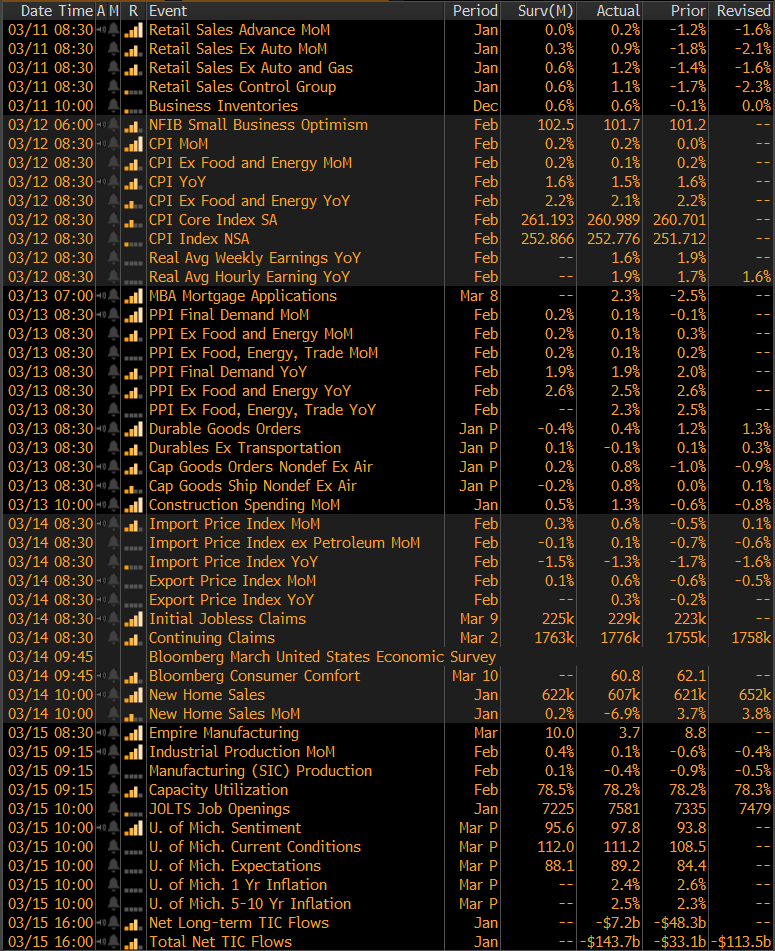
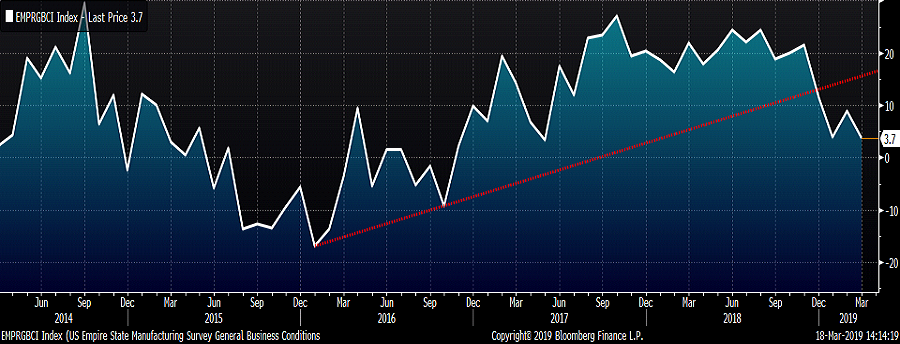
The March Empire Manufacturing Index fell to 3.7, the lowest level since May 2017 and missed expectations that the index would increase from 8.8 to 10.0.
January new home sales fell 6.9% to a 607k S.A.A.R. vs. expectations of a 622k rate, but part of the sharp drop was due to an upwardly revised December rate to 652k from 621k.
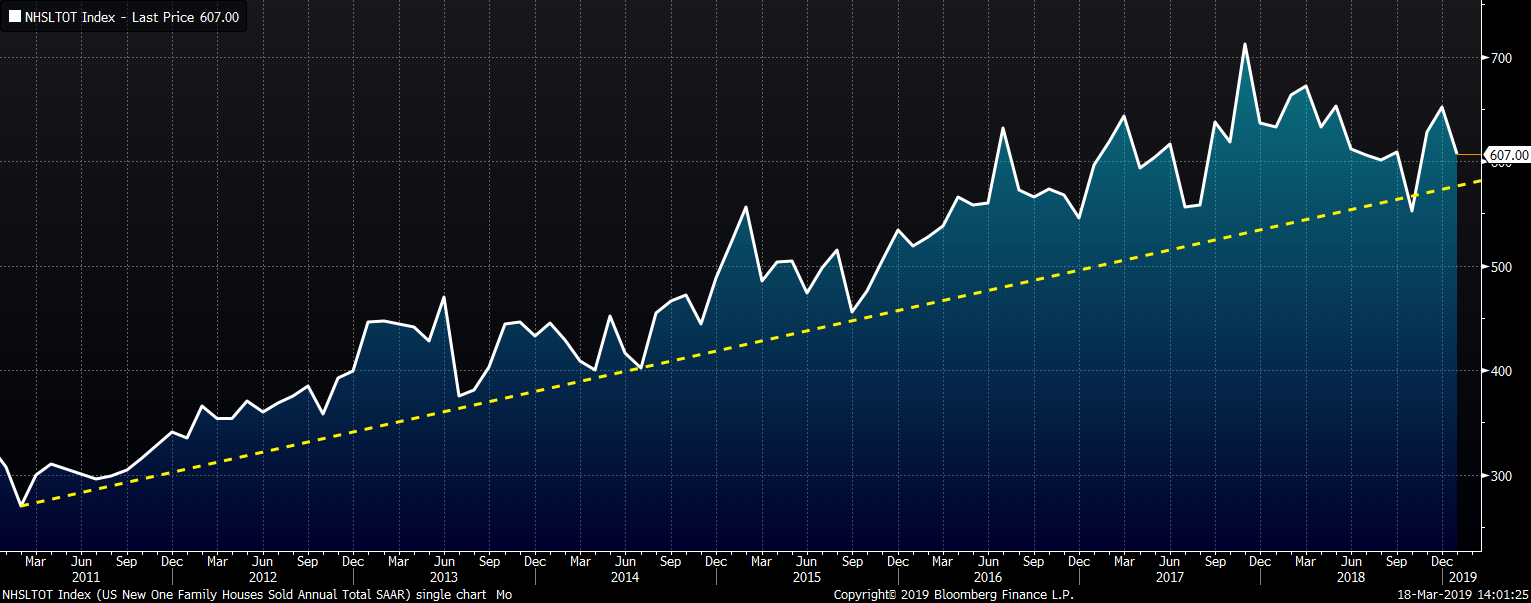
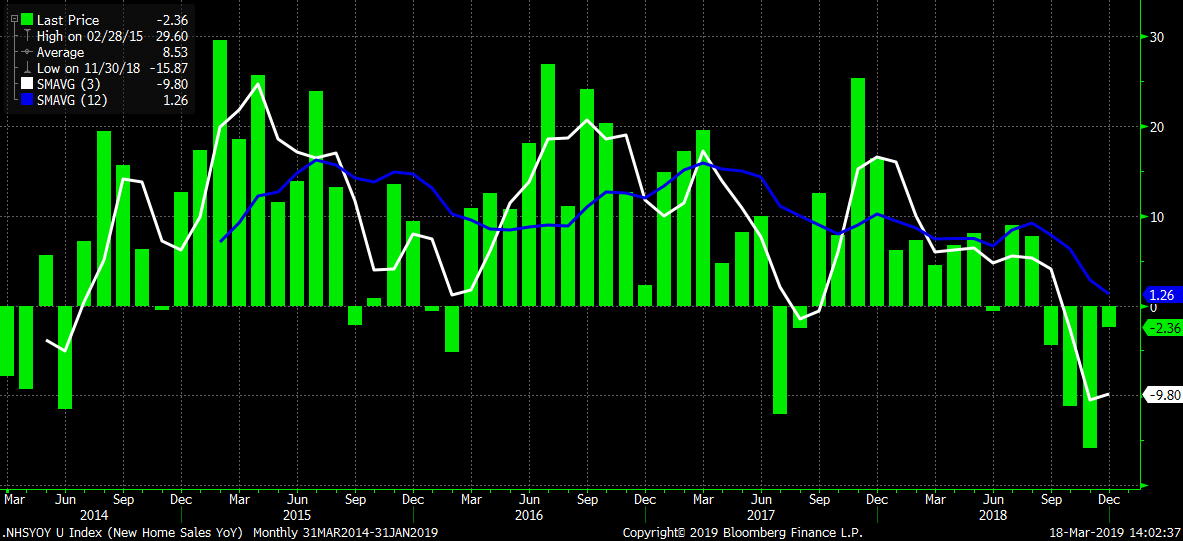
January was the fourth straight month of YoY contraction in new home sales.
Seasonally adjusted January U.S. construction spending was up a better than expected 1.3% MoM and 0.3% YoY.
Upside Risks:
Downside Risks:
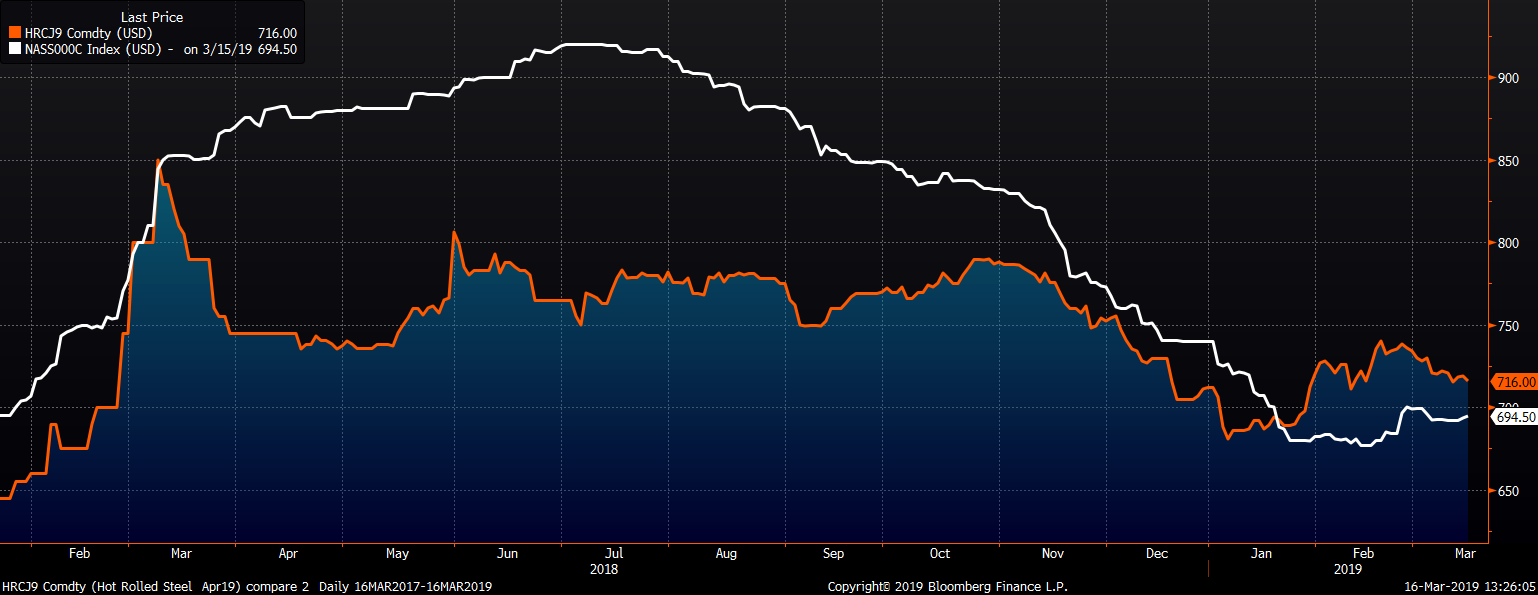
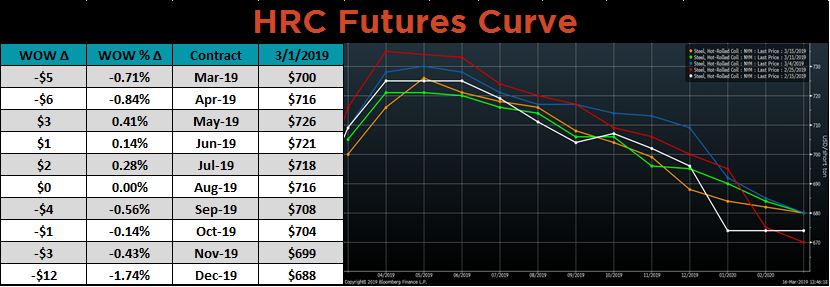
The April CME Midwest HRC future lost $6 to $716, while the Platts TSI Daily Midwest HRC Index was up $1.75 to $694.50.
The CME Midwest HRC futures curve shown below with last Friday’s settlements in orange.
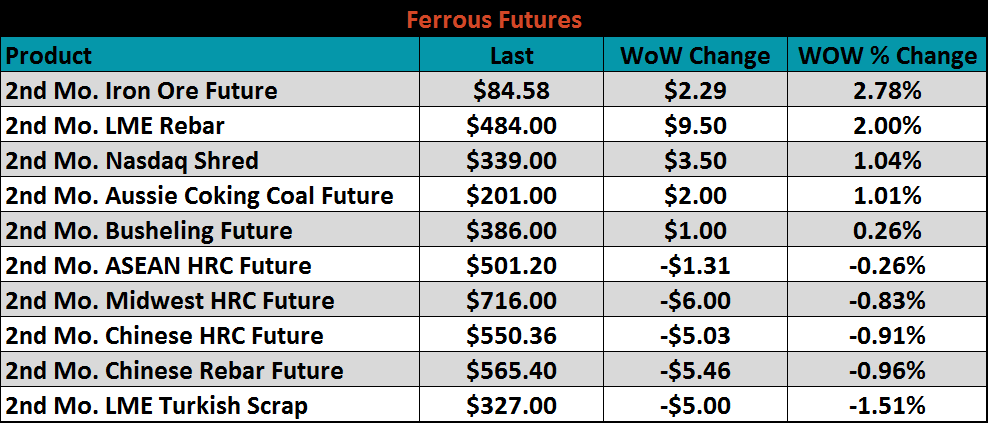
April ferrous futures were mixed. April iron ore gained 2.8%, while April LME Turkish scrap lost 1.5%.
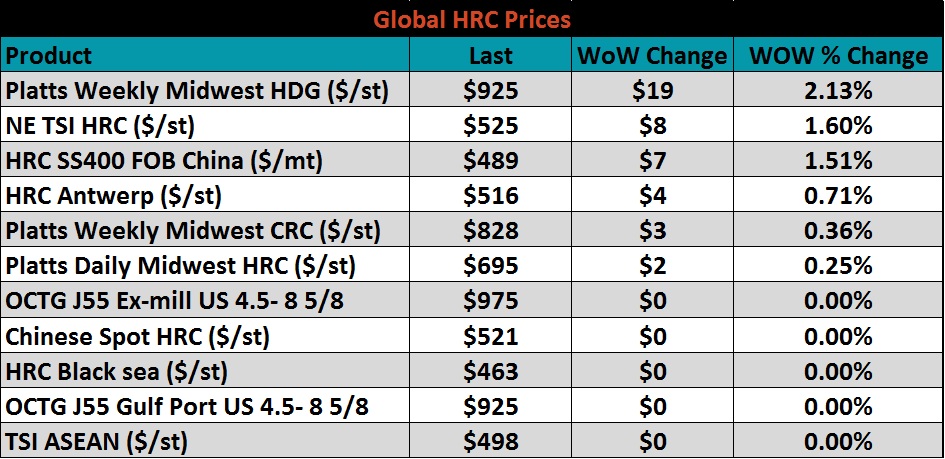
Flat rolled indexes were mostly higher.
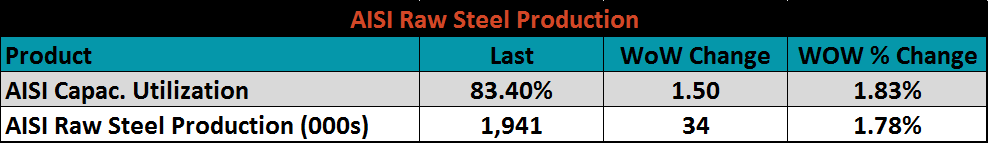
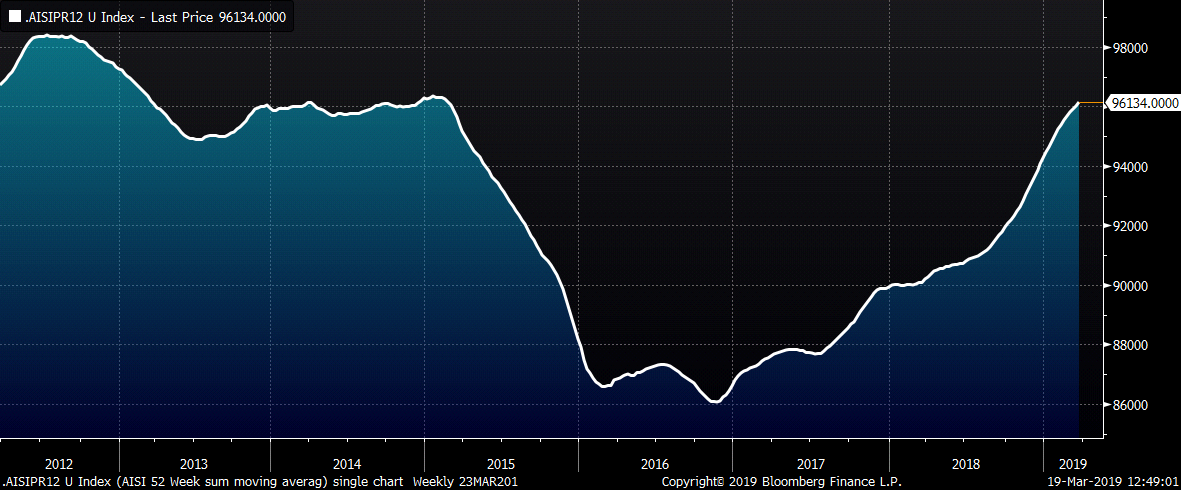
The AISI Capacity Utilization Rate increased to 83.4%. This is the highest rate since 2008!
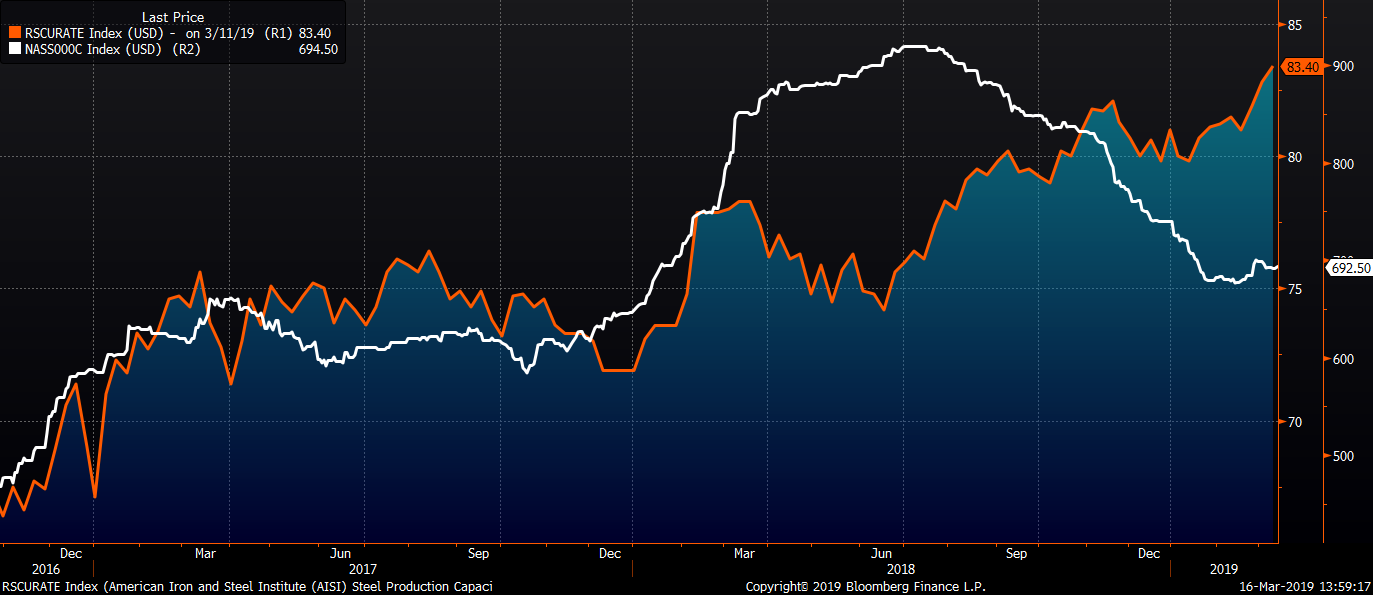
This chart is a moving sum of the last fifty two weeks of AISI crude steel production data and show AISI mills are producing crude steel at a tonnage rate not seen since 2014. This is likely a major factor preventing higher flat rolled prices, despite ultra-low flat rolled imports and service center inventory.
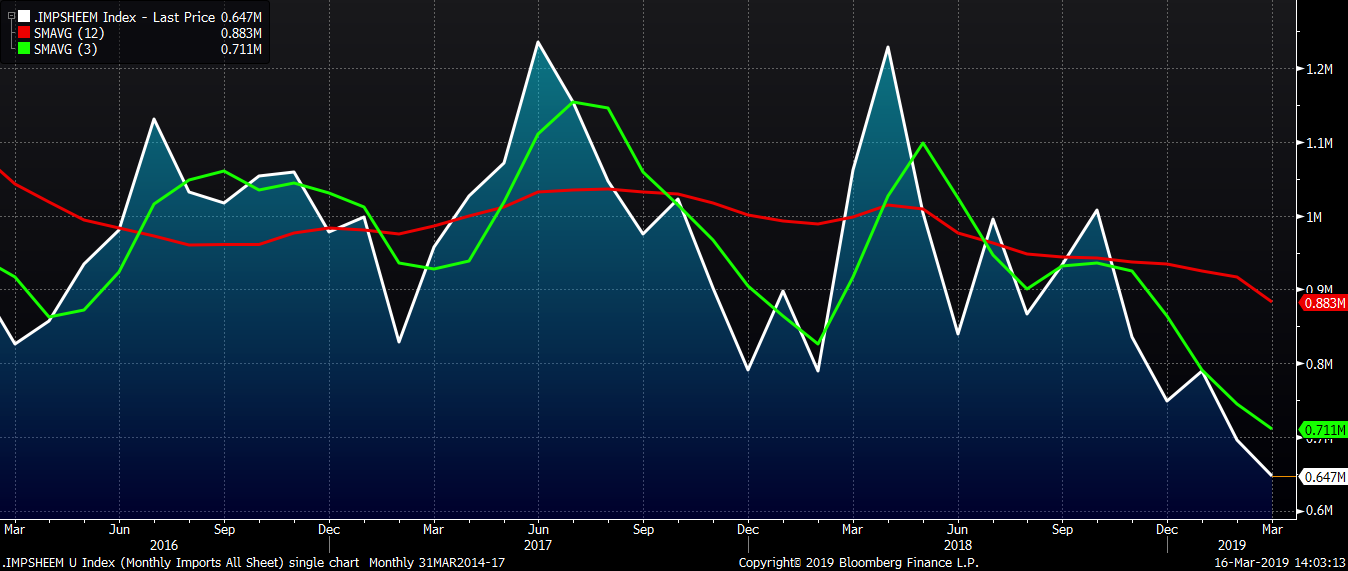
March flat rolled import licenses are forecast to fall 49k tons MoM to 647k while February flat rolled import licenses are forecast to fall 93k tons MoM to 696k.
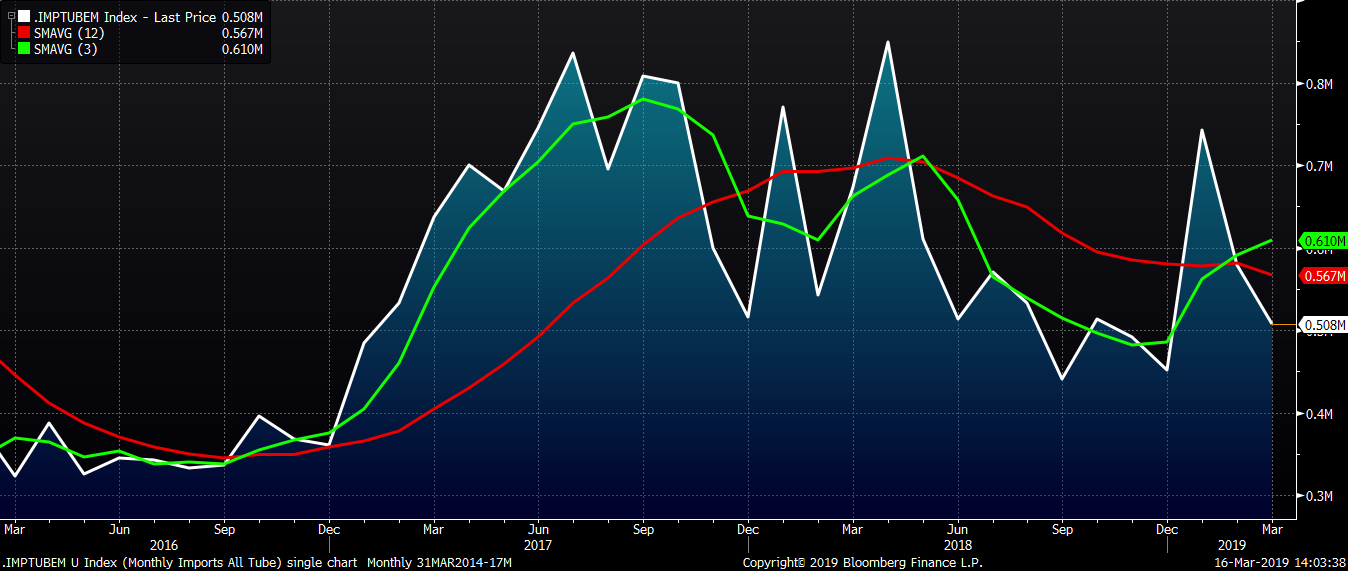
March tube import license data is forecasted to fall 70k to 508k tons MoM after a steep drop in February.
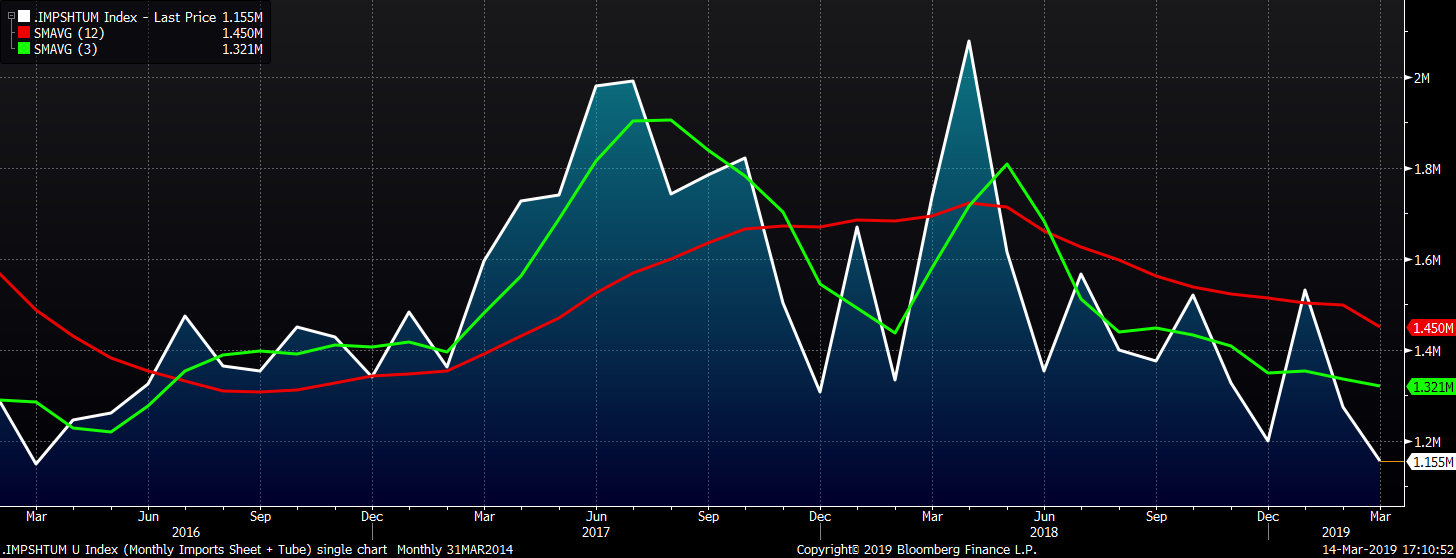
The combined flat and tube import license forecast looks to fall 120k tons in March after a 257k decrease in February.
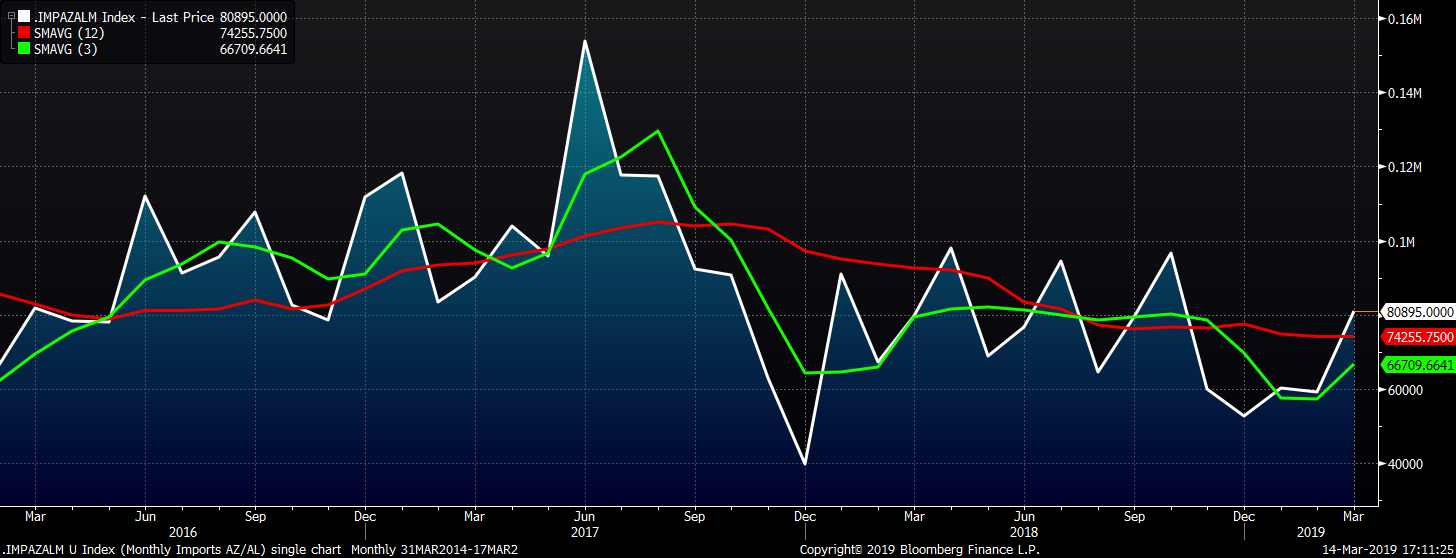
AZ/AL import licenses look to move sharply out of the 50-60k range with March licenses forecast to increase 22k to 81k.
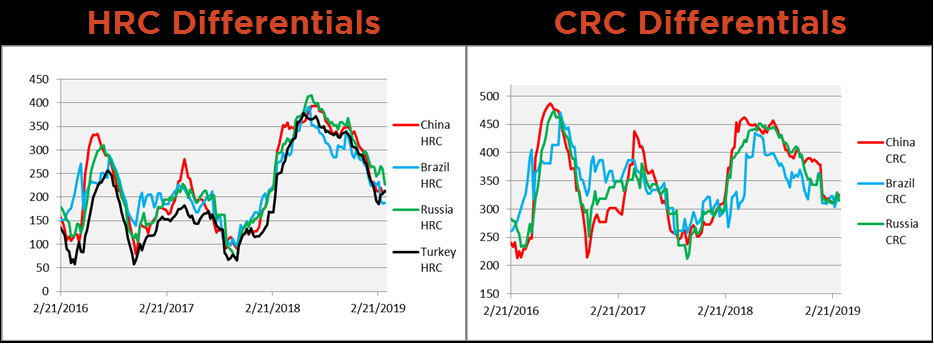
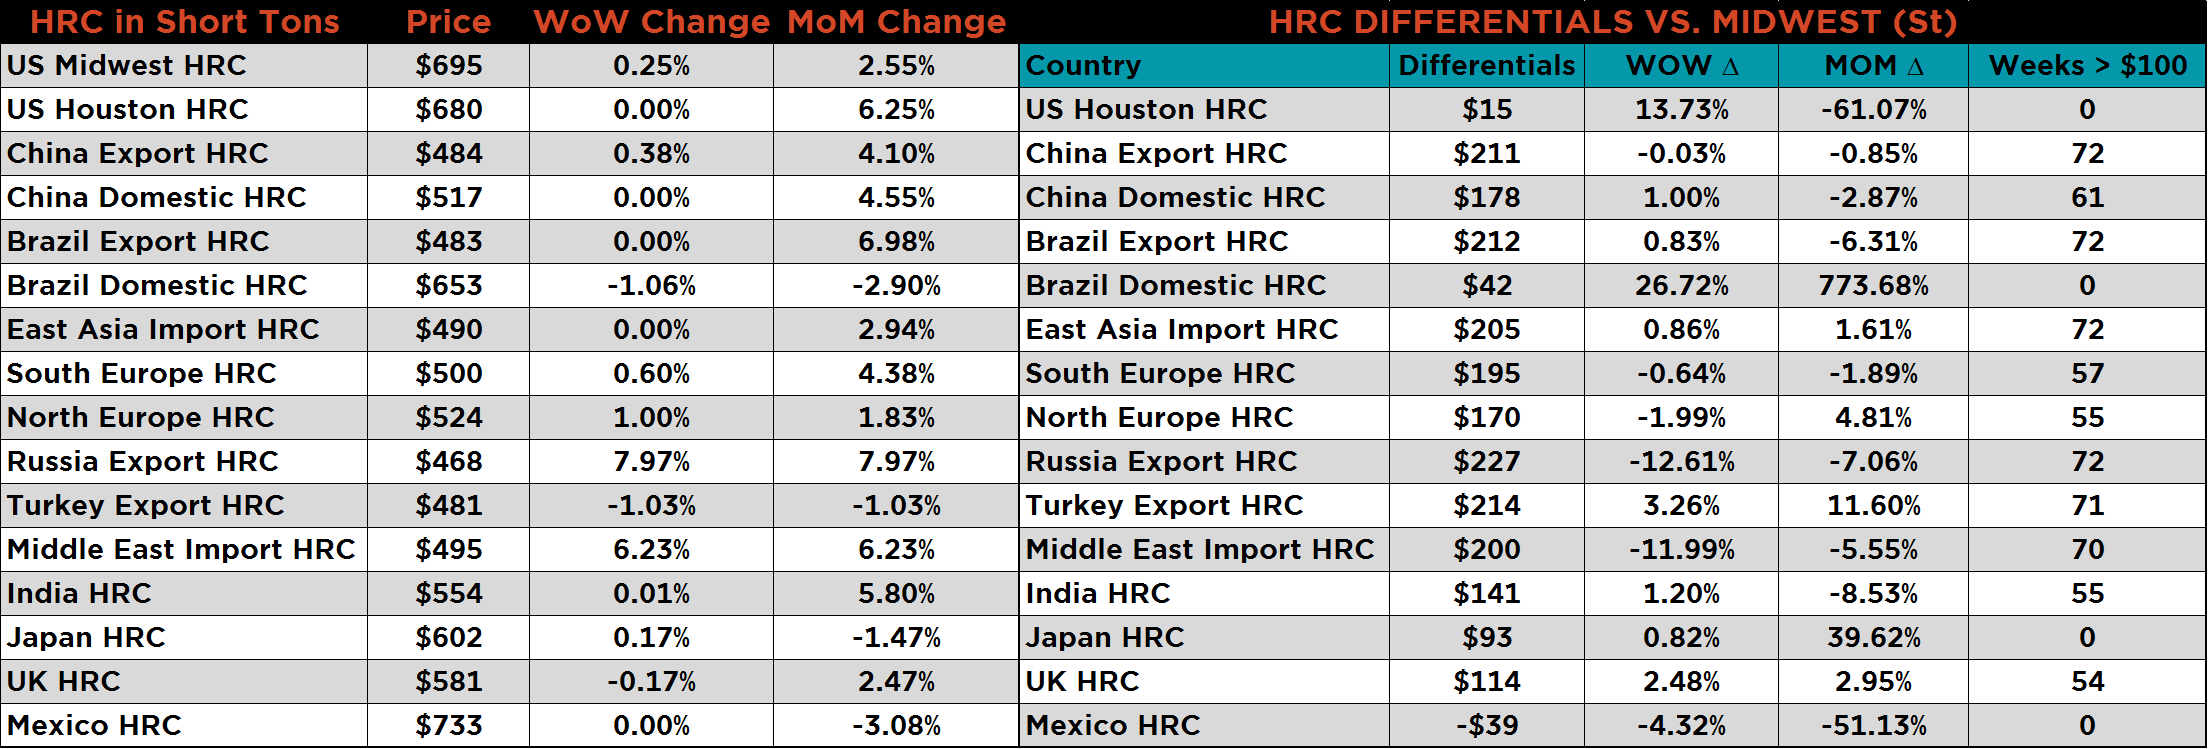
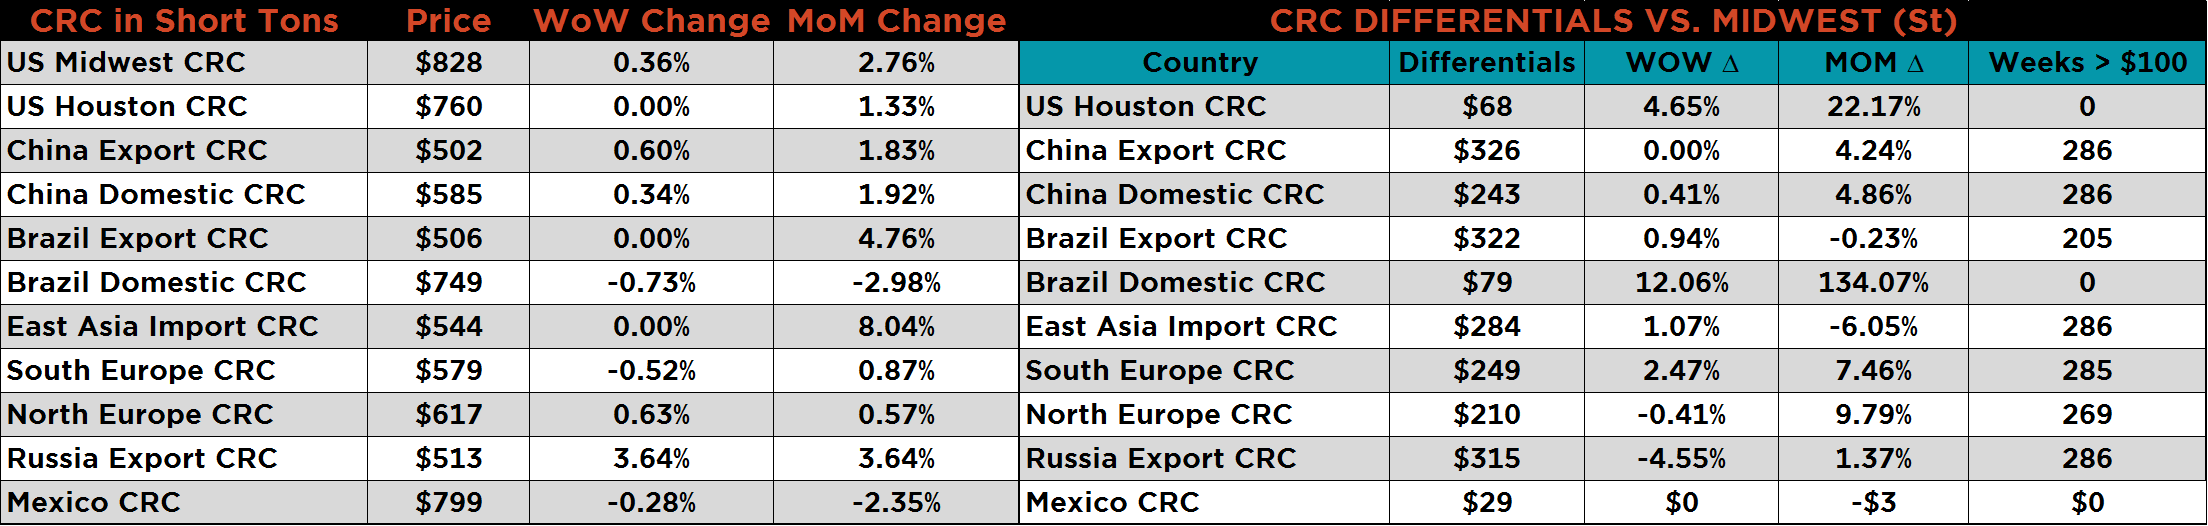
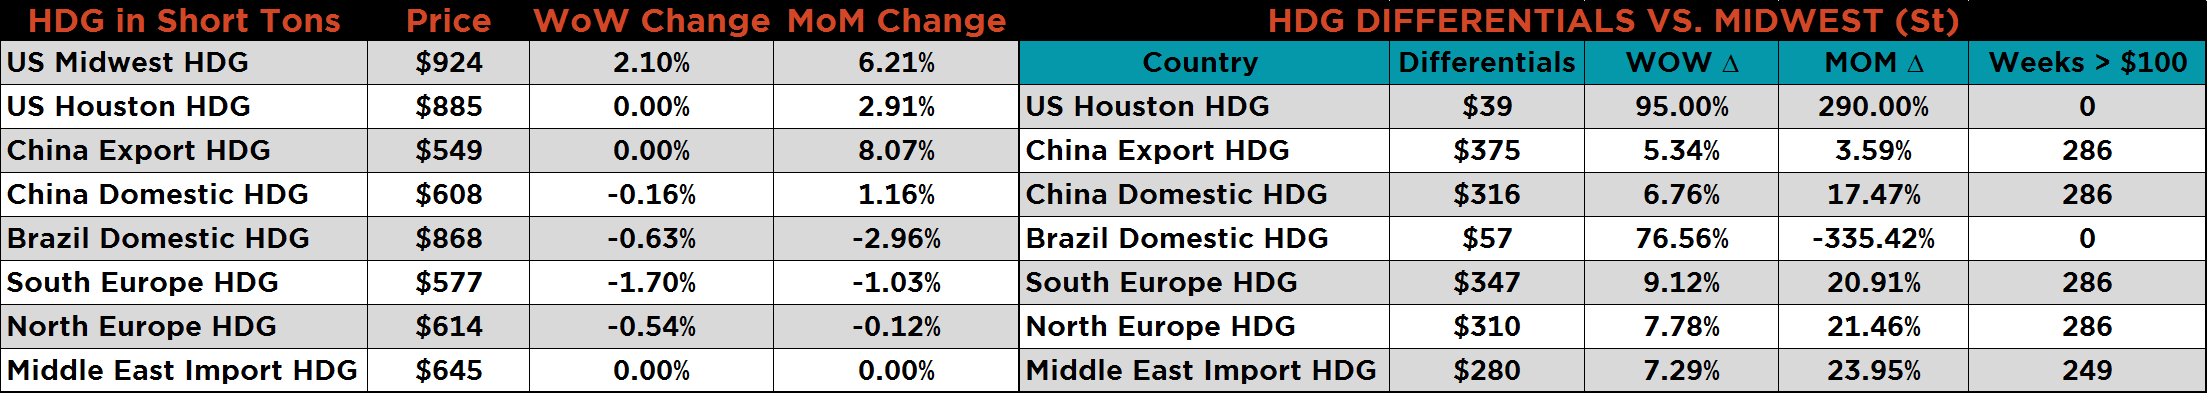
Below are HRC and CRC Midwest vs. each country’s export price differentials using pricing from SBB Platts. The Chinese, Brazilian and Russian HR differentials all continue to fall, while the Turkish HR differential rose. The Chinese, Brazilian and Russian CR differentials have hovered around $320, as prices appear to move in concert with U.S. CR prices since January.
SBB Platt’s HRC, CRC and HDG WoW pricing is below. The Midwest HDG price rose 2.1%, while HRC and CRC showed little change. Russian export HR and CR prices rose 8% and 3.6%, respectively. Middle Eastern HR Import prices gained 6.2%.
Scrap prices were mostly higher. The SGX April iron ore future gained 2.8% and the IODEX was up 1.6%, while coking coal was down 1.4%.
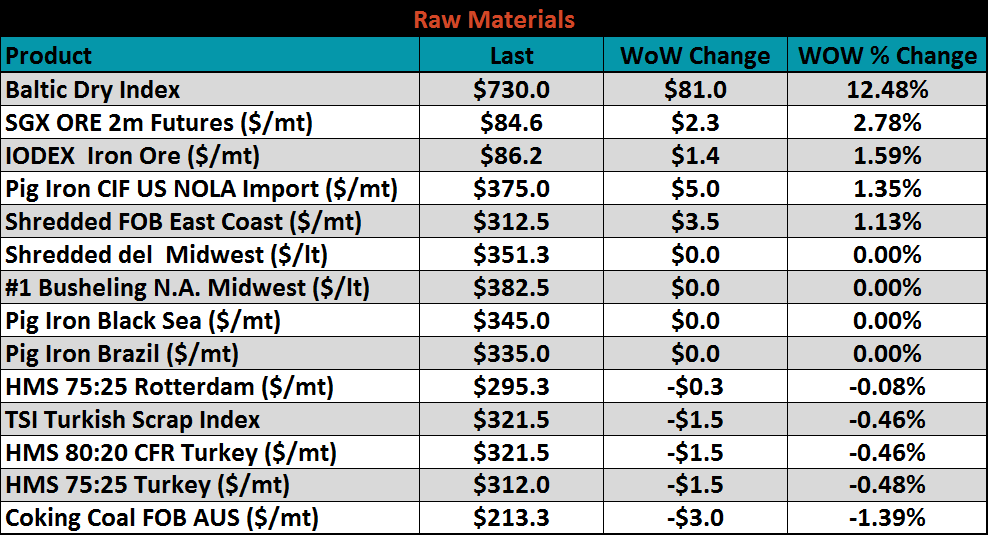
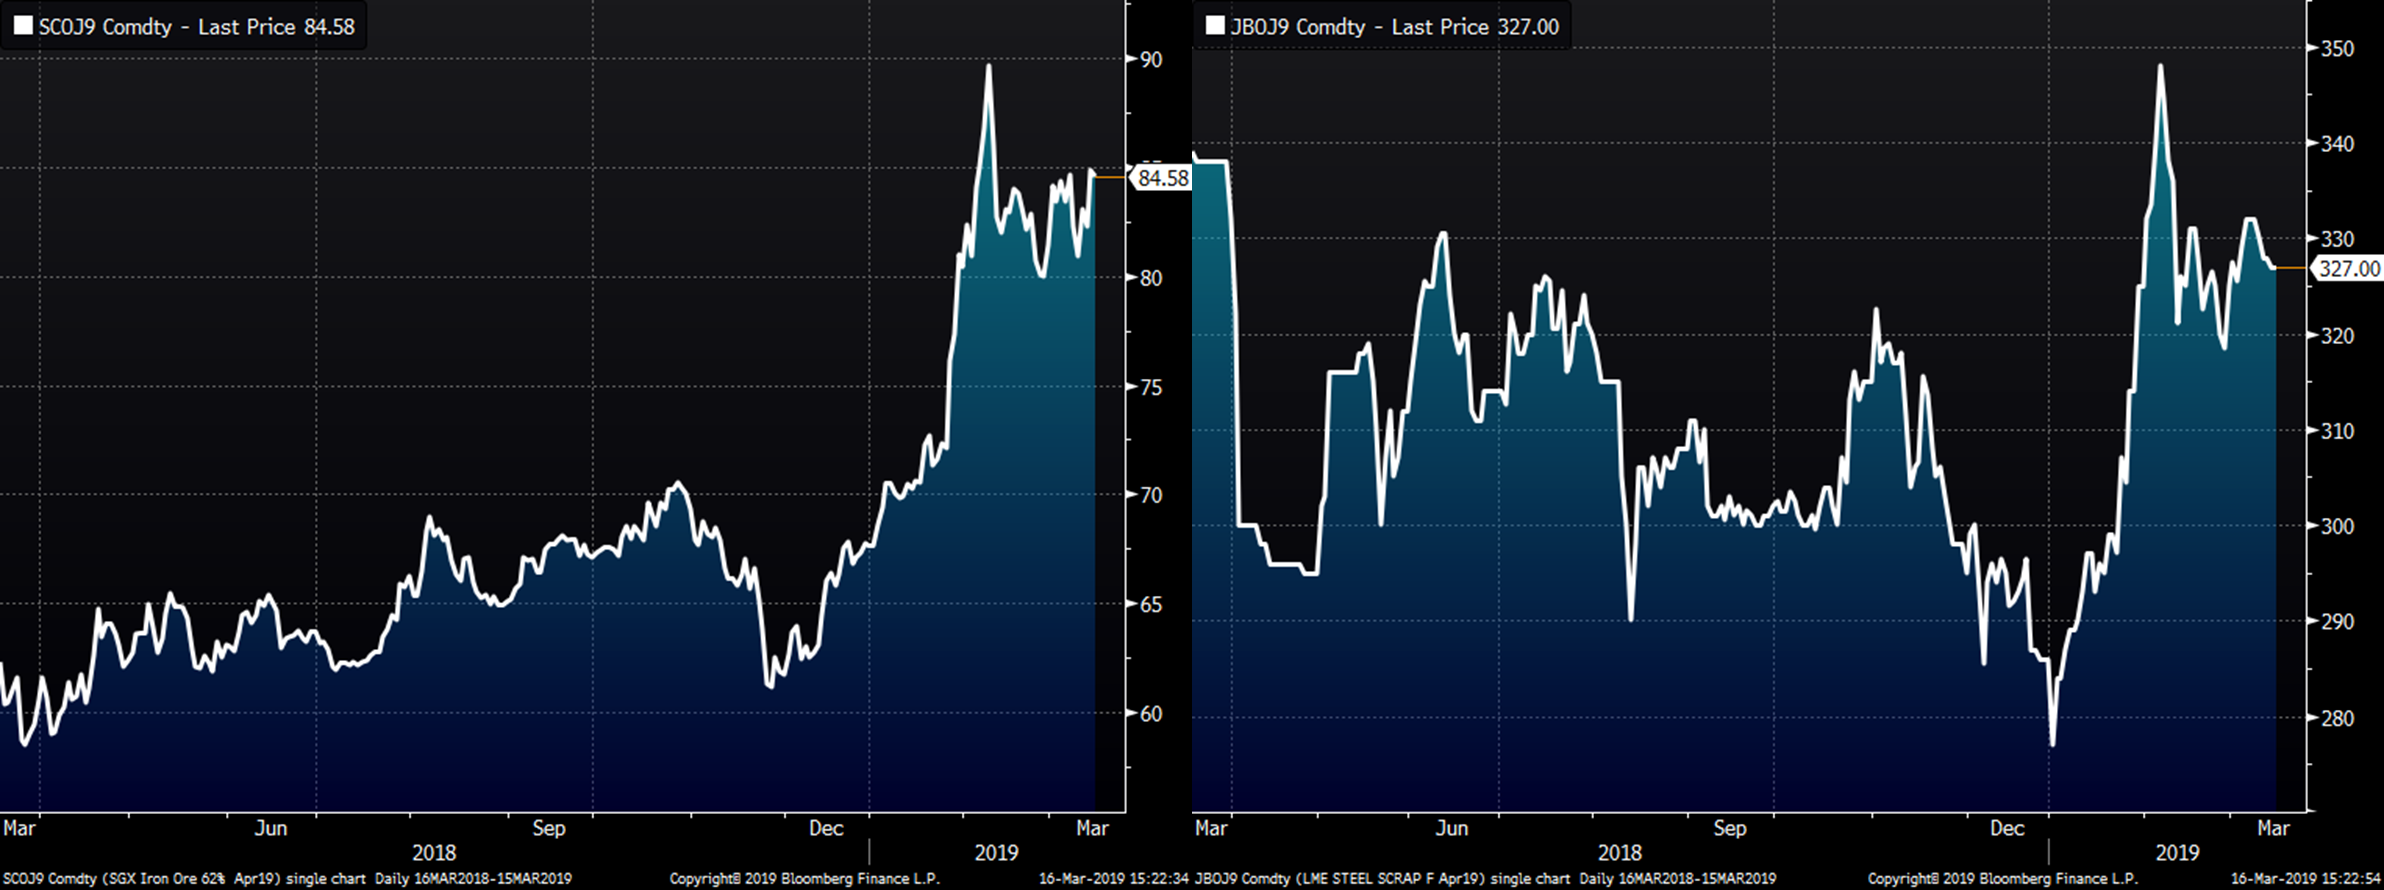
The April SGX iron ore future gained $2.30 to $84.58 and the April Turkish scrap future added $5 to $327.
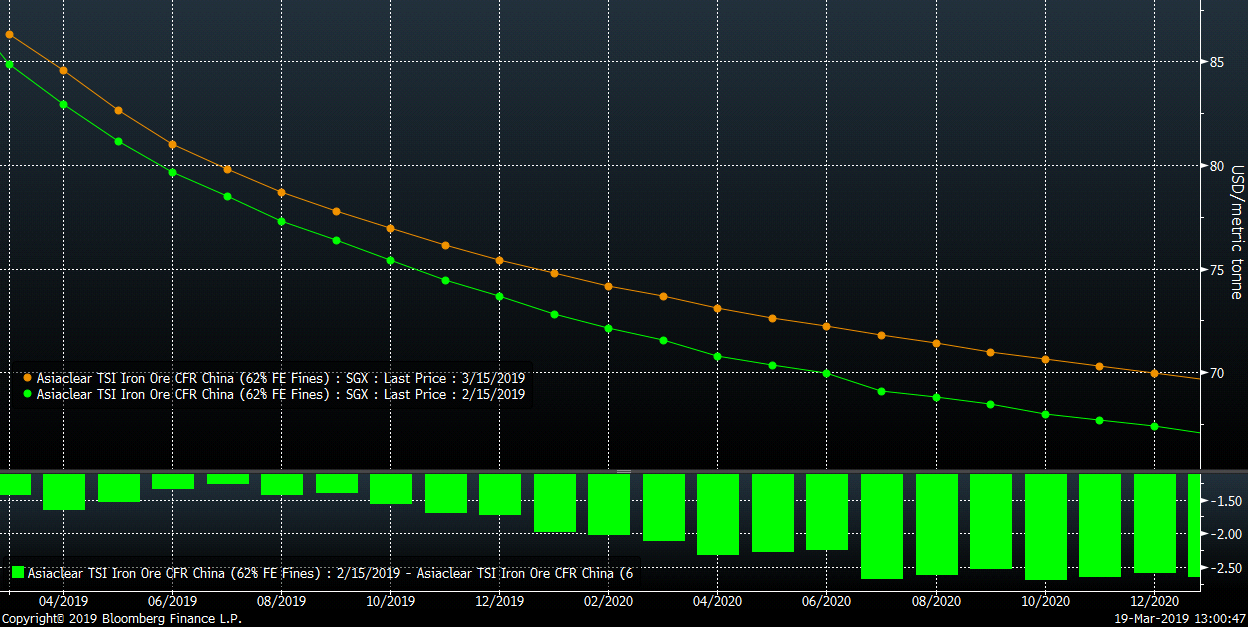
The SGX iron ore futures curve has held most of the gains made following the Vale dam disaster.
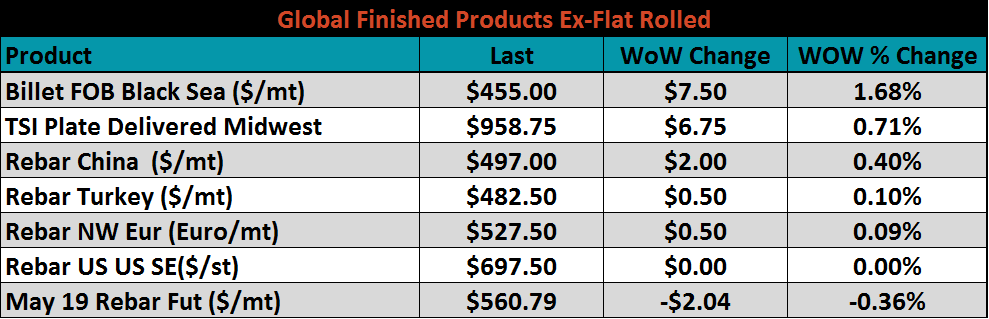
Ex-flat rolled prices saw little movement. Black Sea billet gained 1.7%.
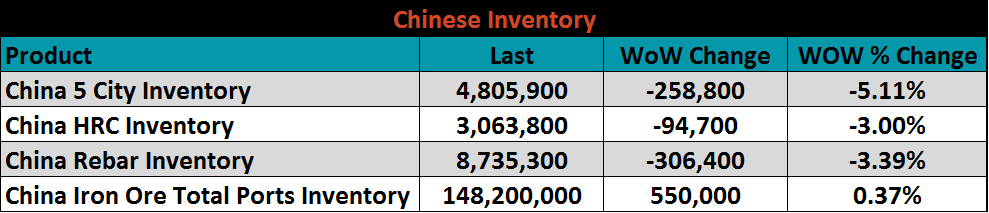
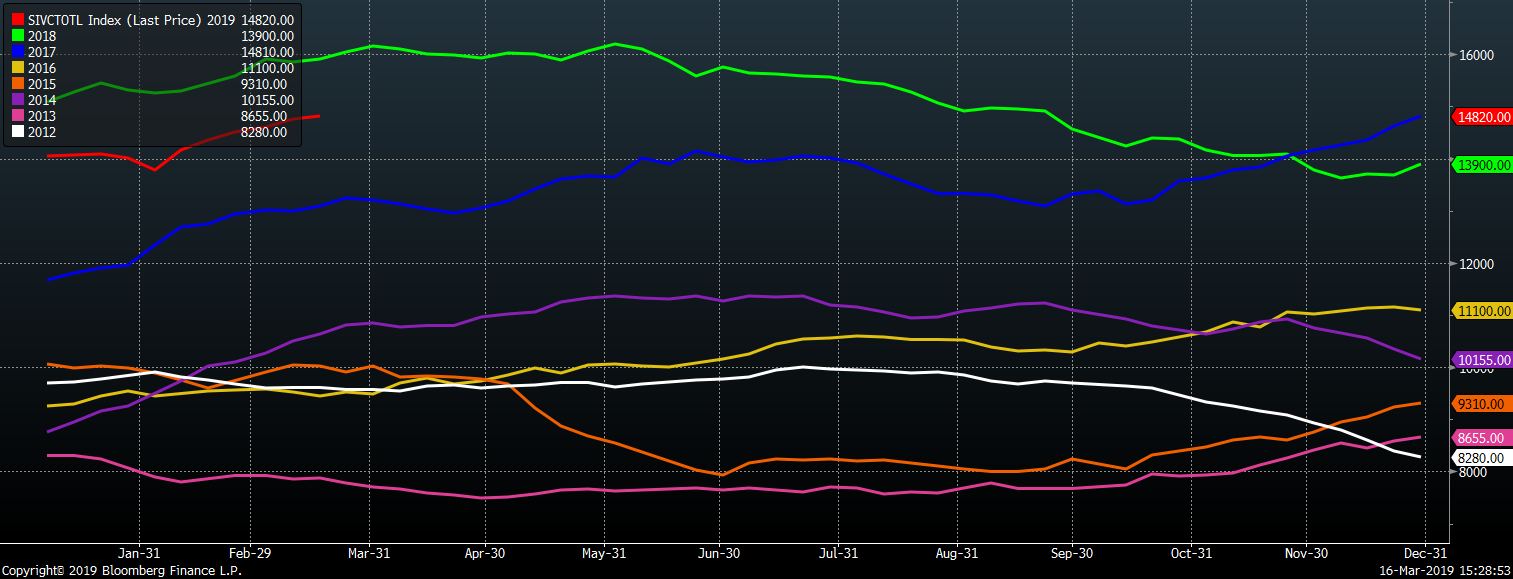
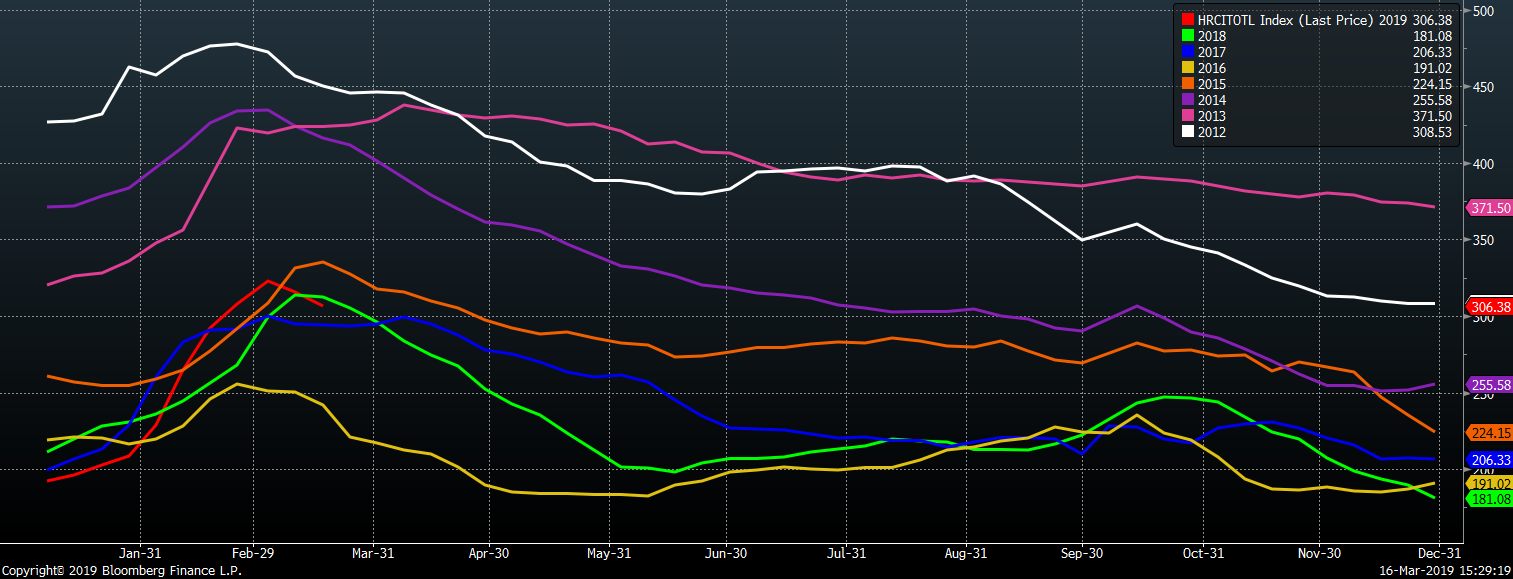
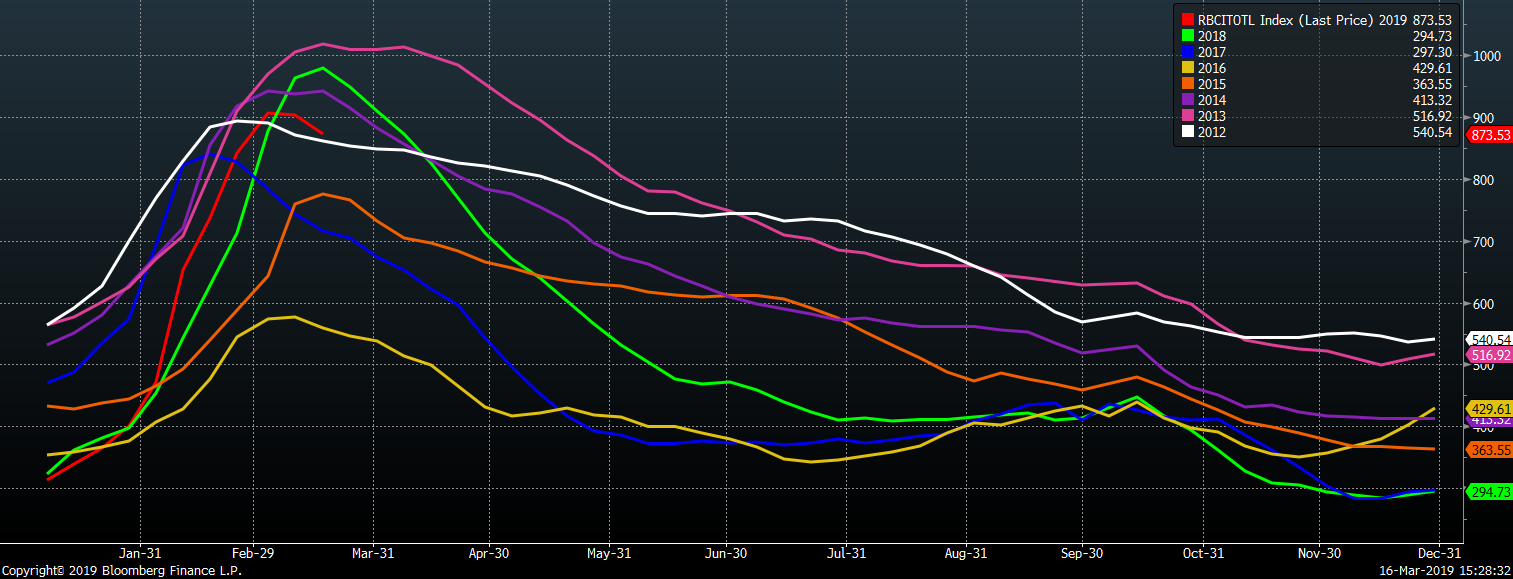
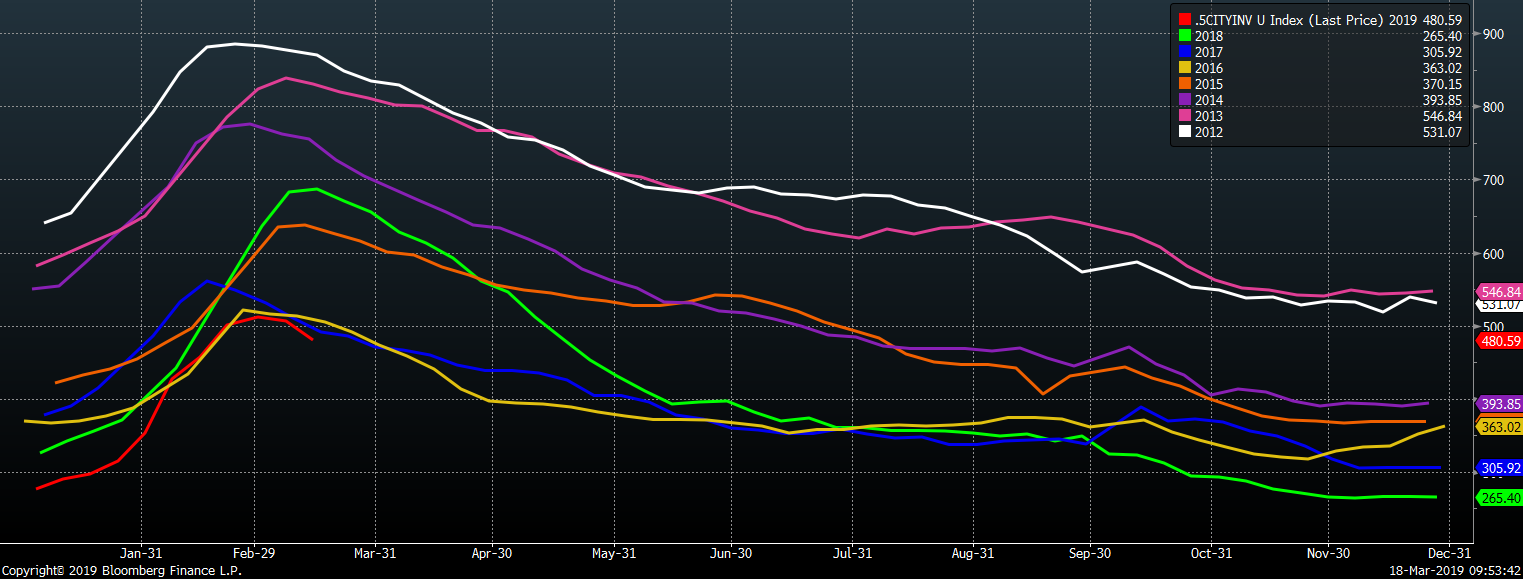
Below are inventory levels for Chinese finished steel products and iron ore. Chinese finished steel inventory levels look to have reached their seasonal peak and started to trend lower. HRC inventory is close to the same level as it was at this time last year, while rebar and the 5-city level are well below where they were at this point in 2018.

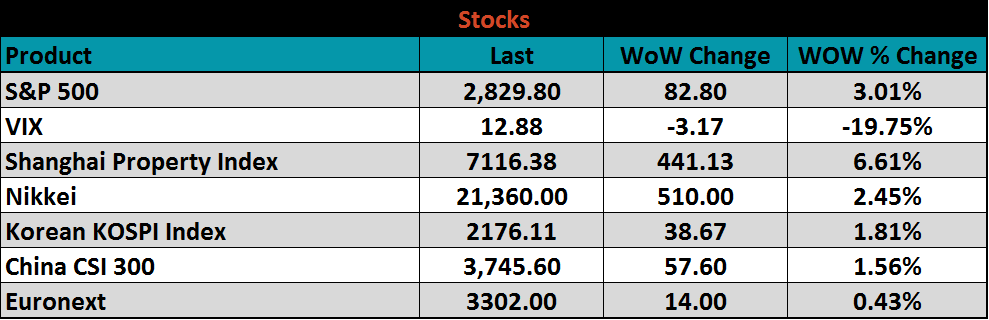
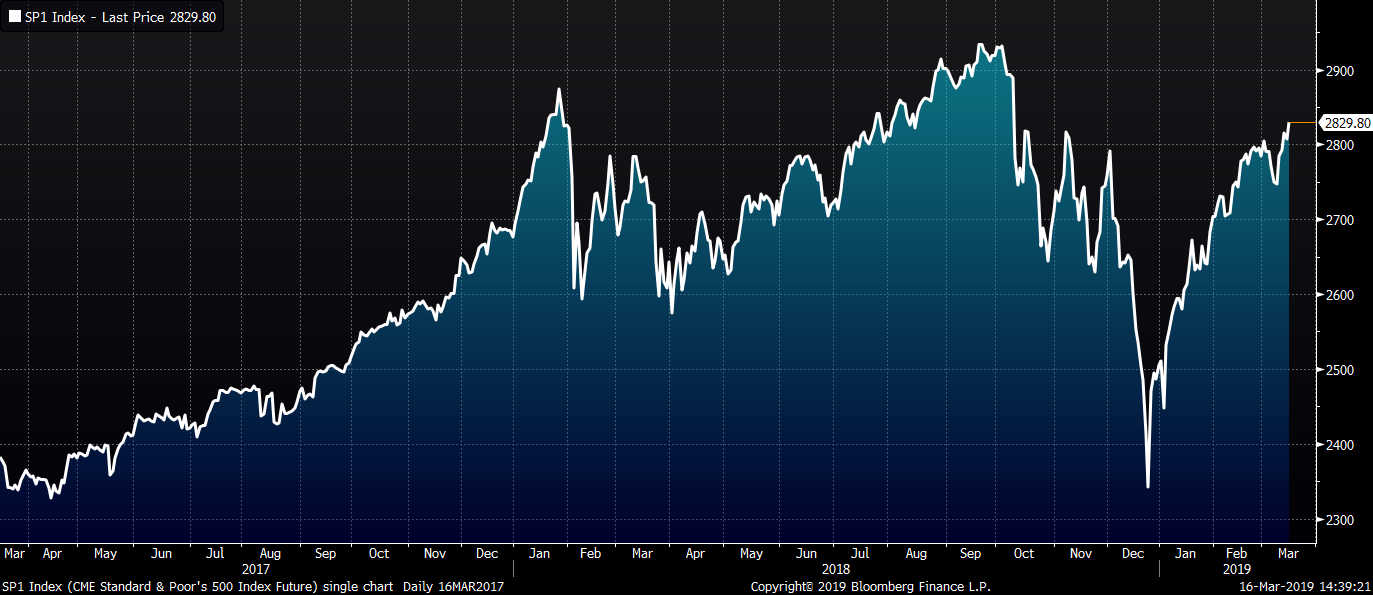
The S&P 500 was up 3%. Global markets moved higher, especially those in Asia. China’s property market index jumped 6.6%.
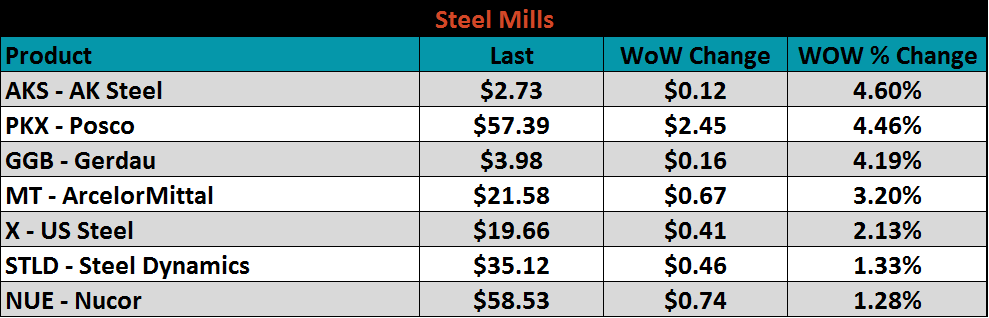
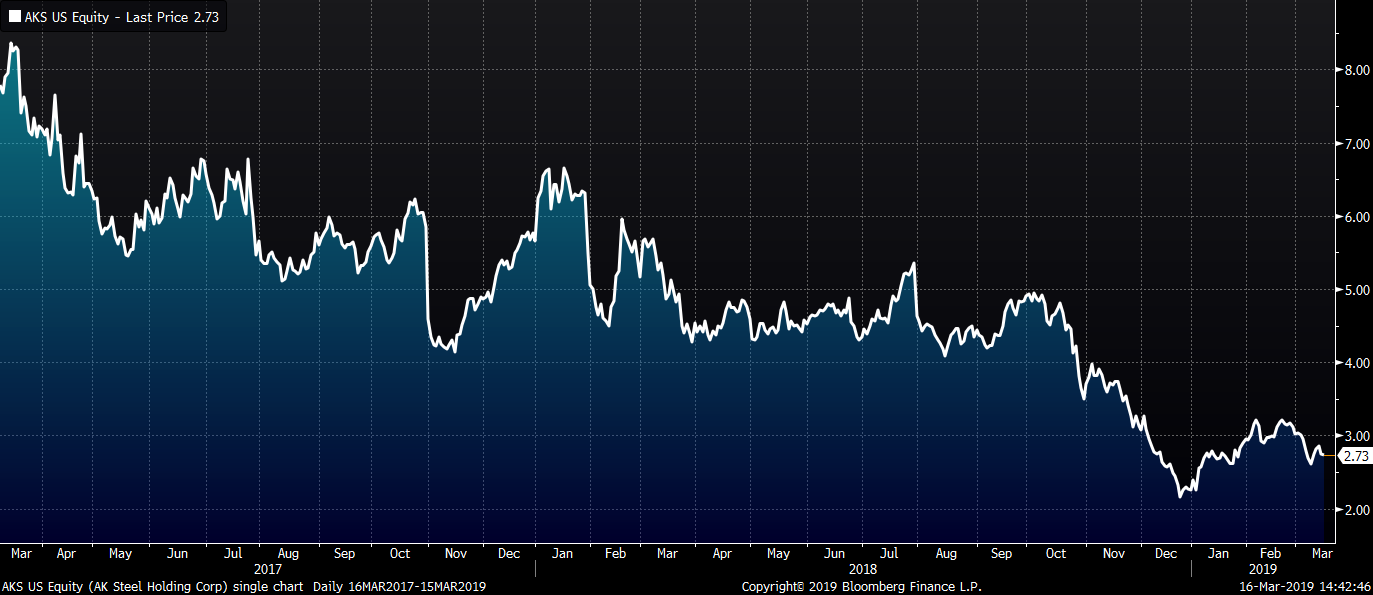
Steel mill stocks were all higher last week. AK Steel, Posco and Gerdau were each up over 4%.
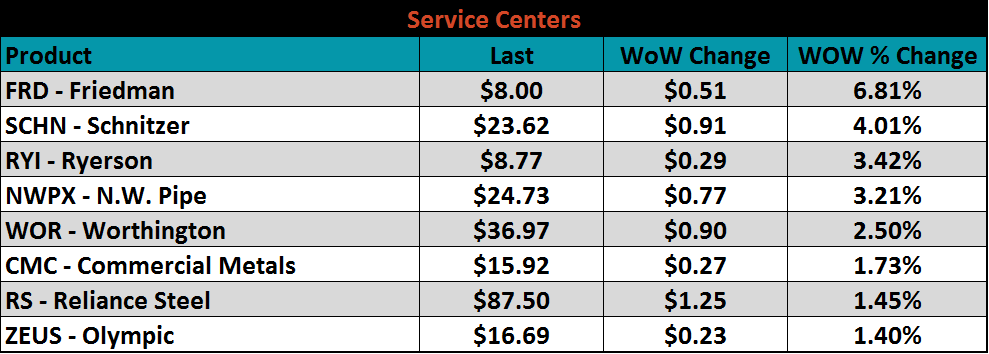
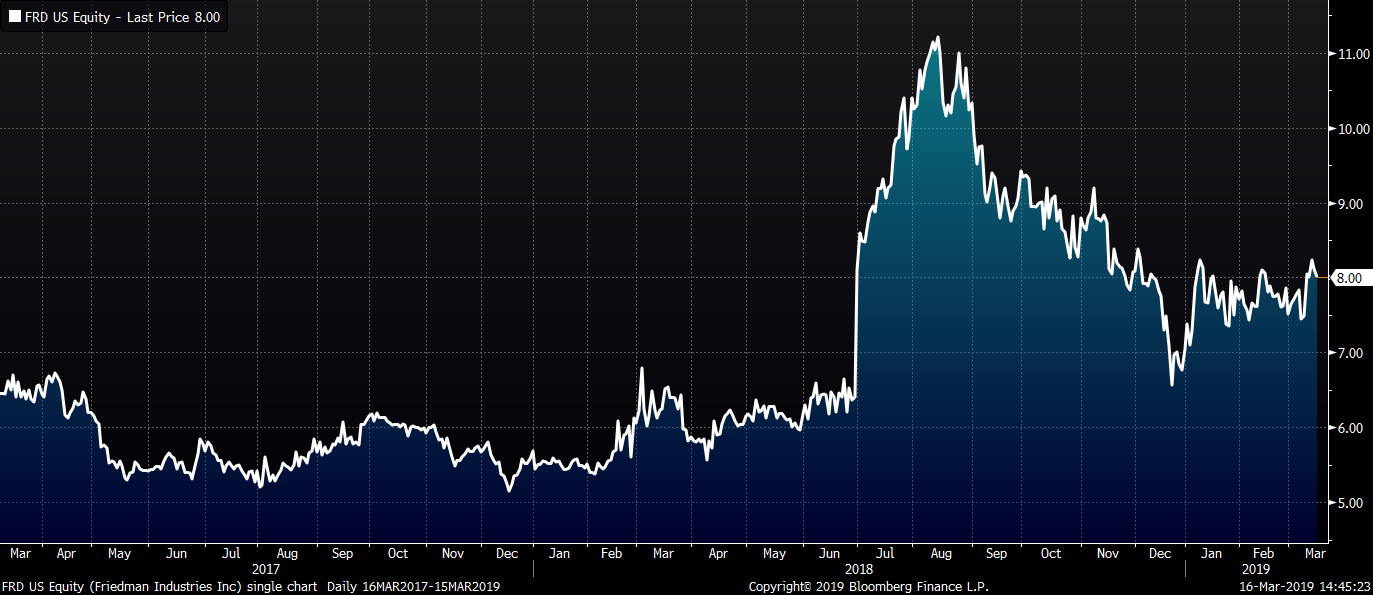
Service center stocks were all higher, led by Friedman, which gained 6.8%.
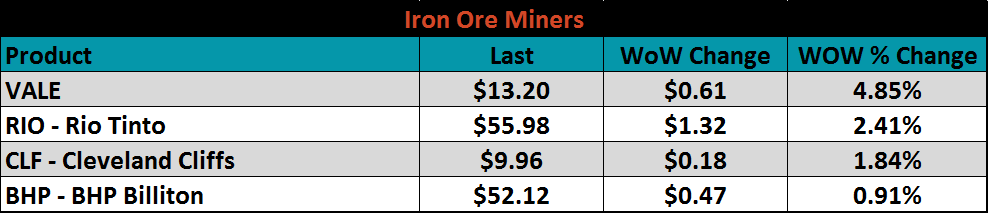
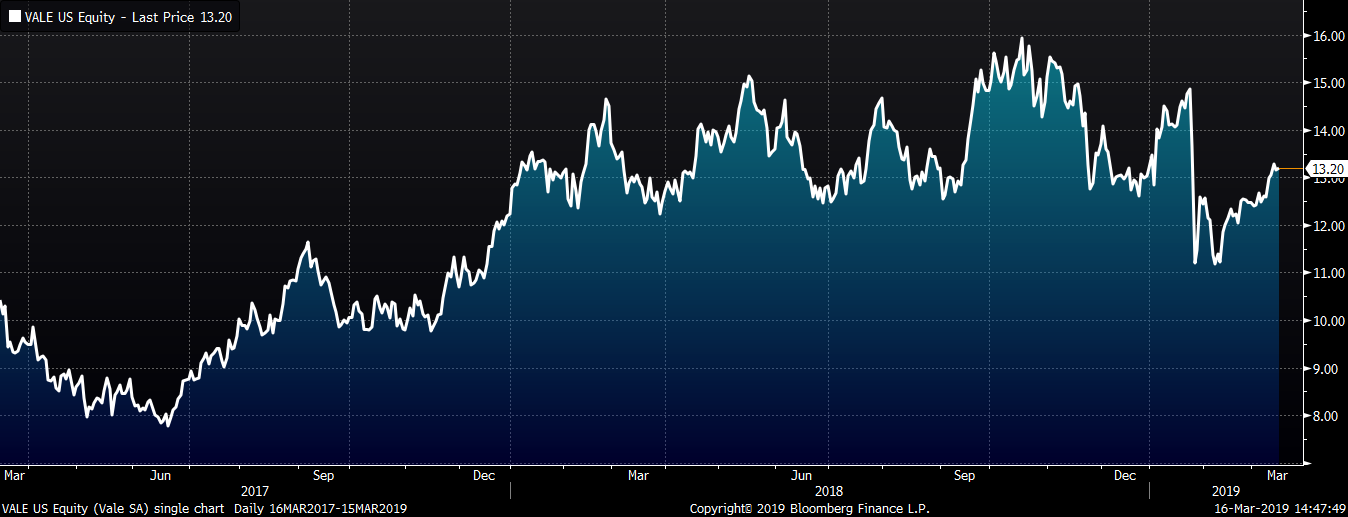
Mining’s stocks saw gains with Vale’s 4.9% leading the group.
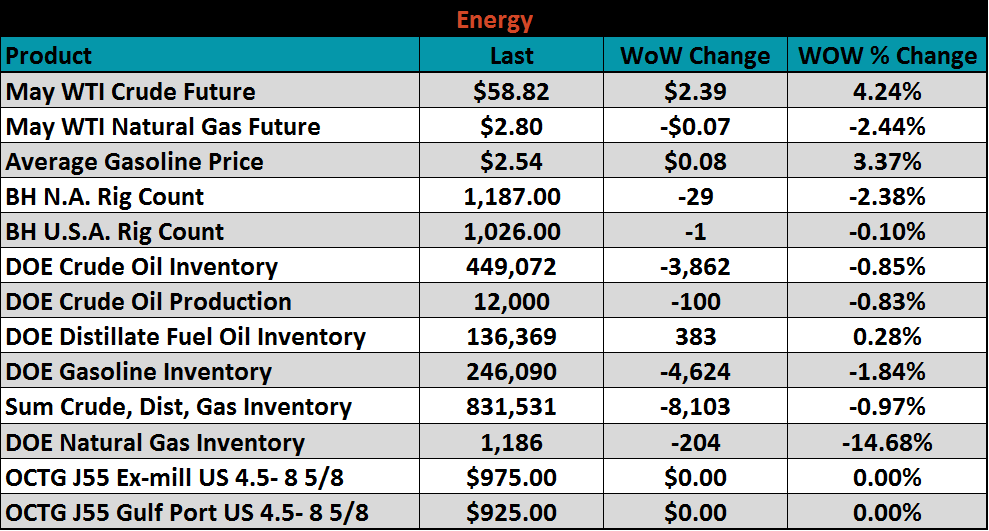
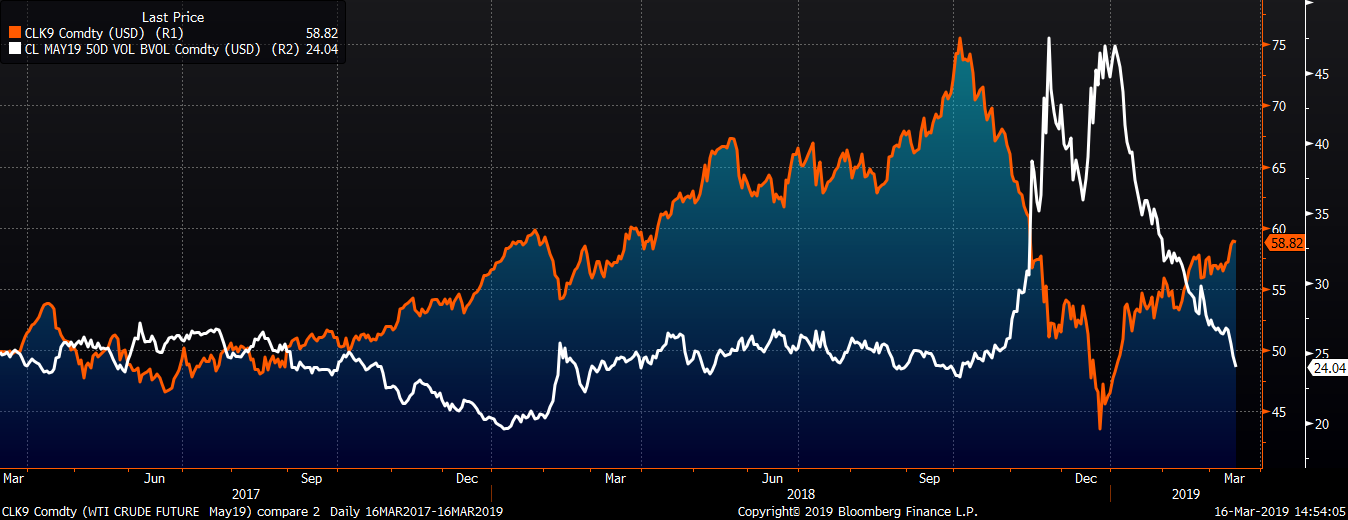
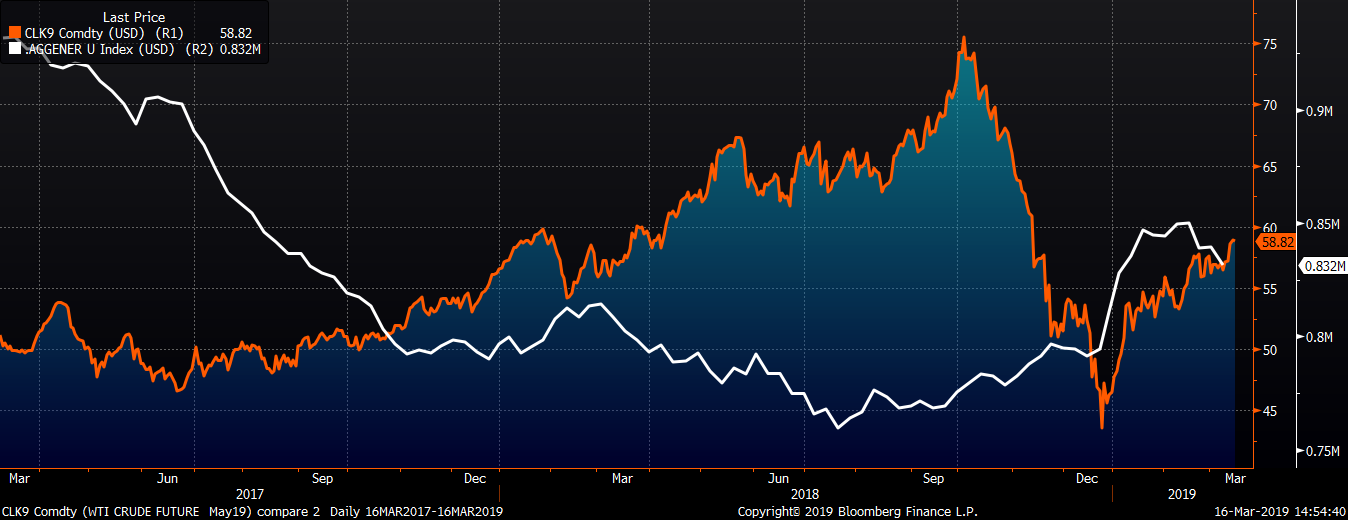
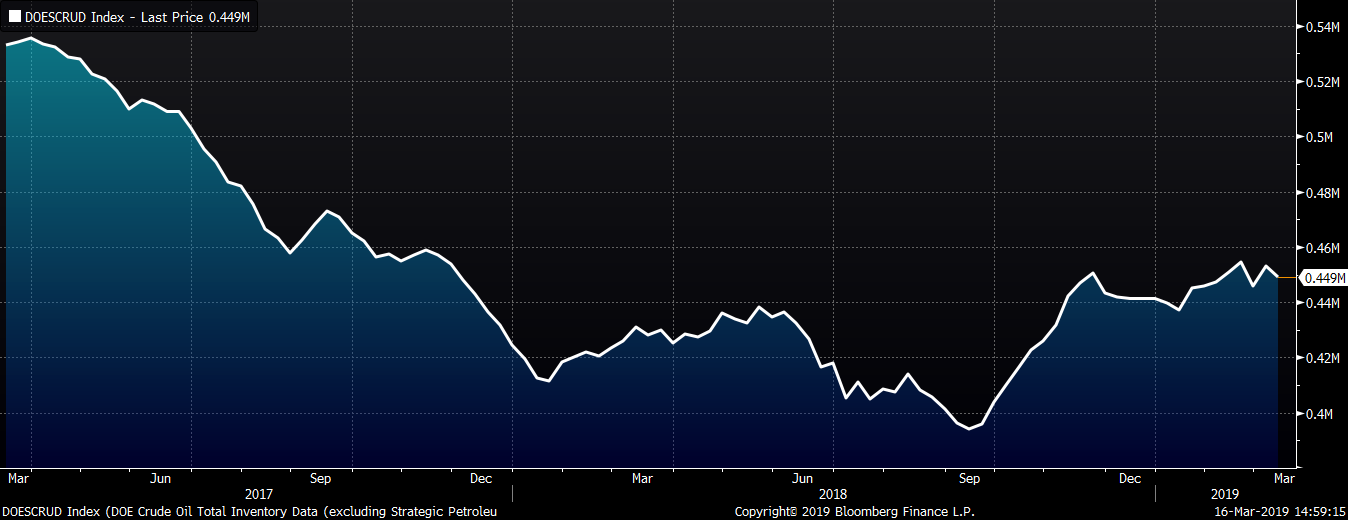
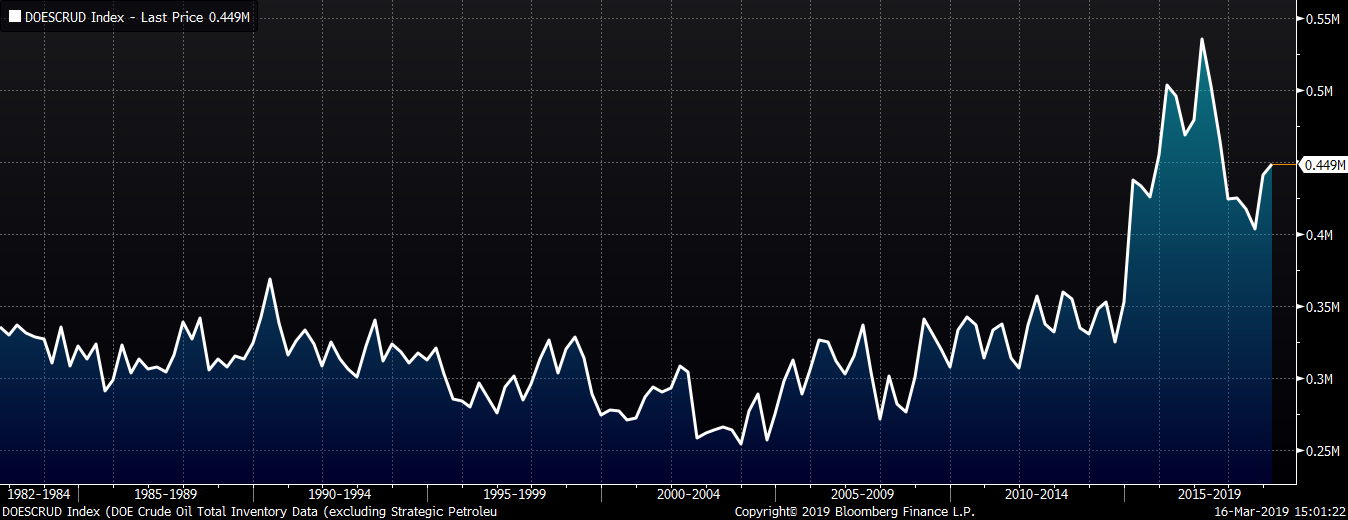
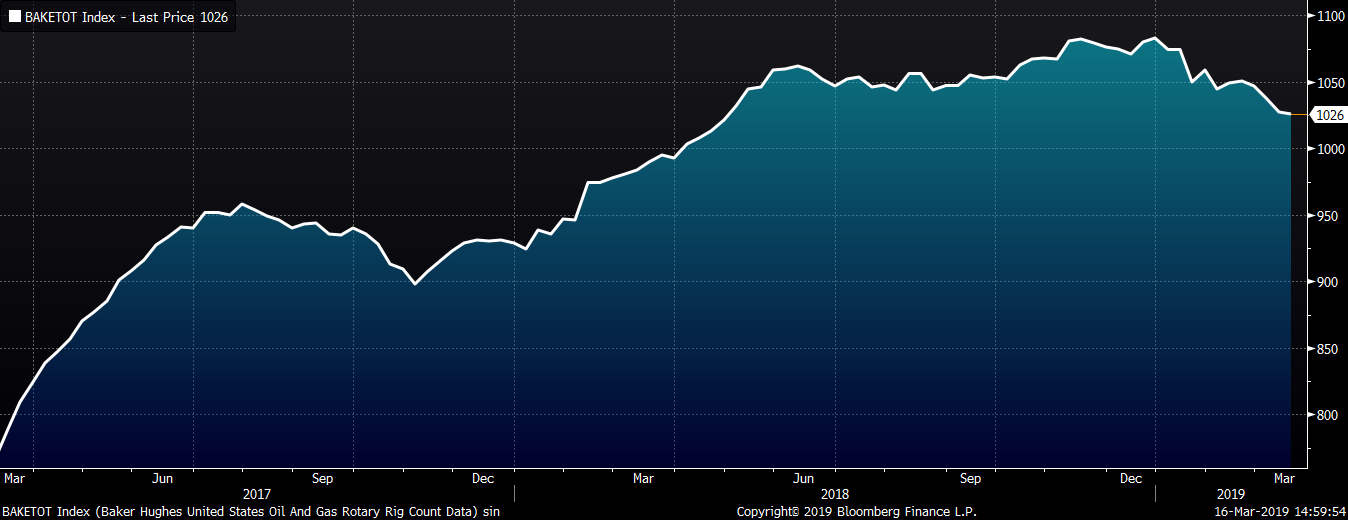
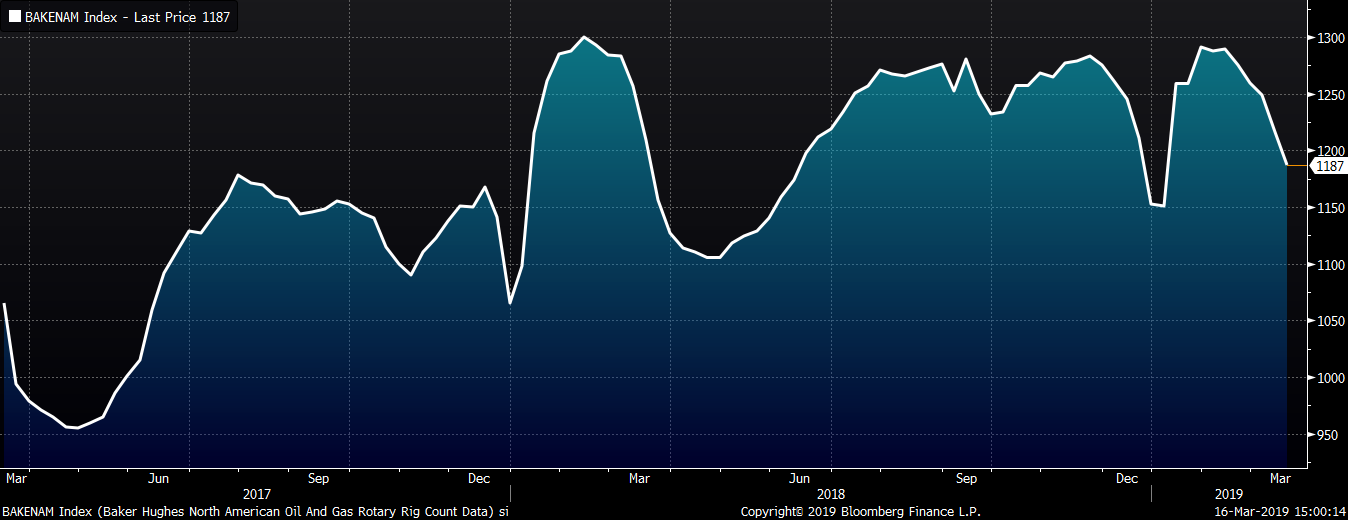
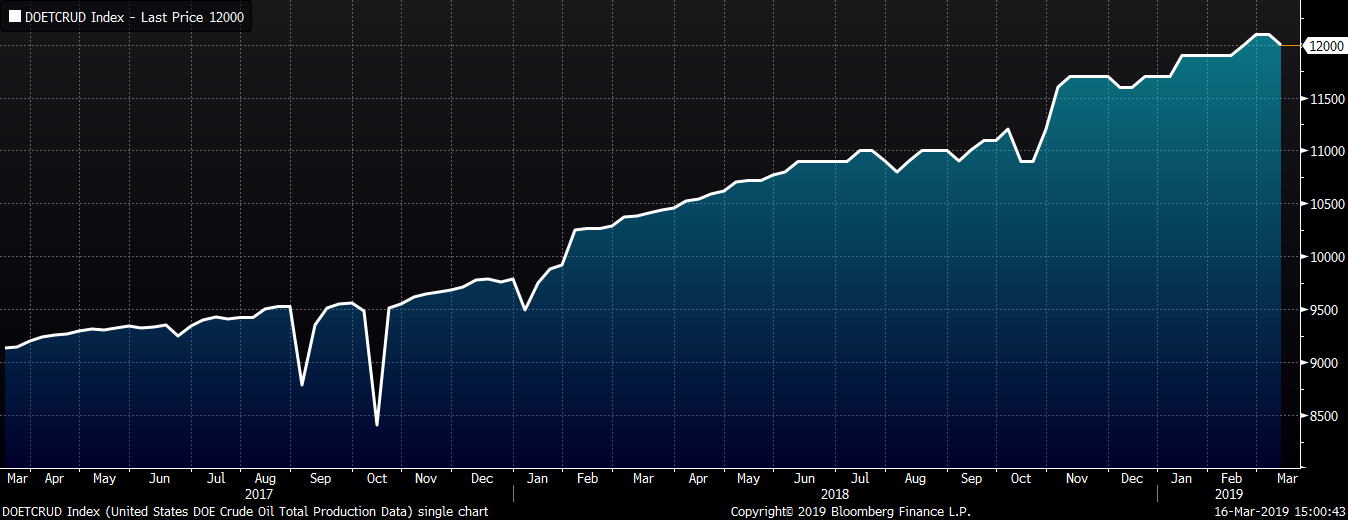
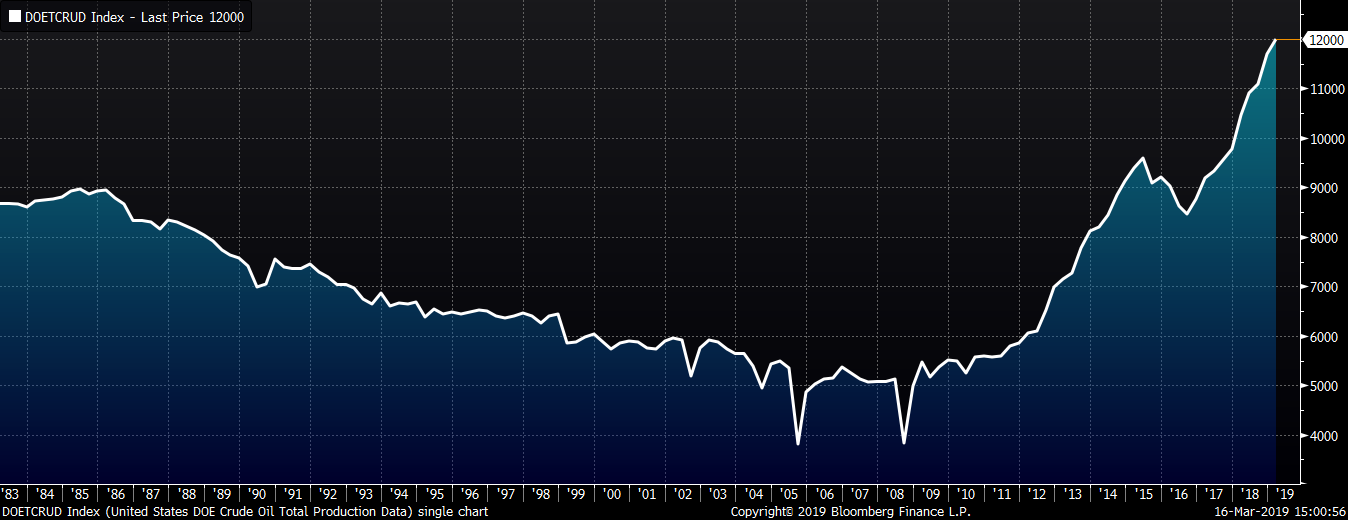
Last week, the May WTI crude oil future gained $2.39 or 4.2% to $58.82/bbl. Gasoline and crude oil inventories fell 1.8% and 0.9%, respectively, while distillate inventory rose 0.3%. The aggregate inventory level was down 1%. Crude oil production ticked down to 12m bbl/day. The U.S. rig count lost one rig while the North American rig count lost twenty-nine rigs. The May natural gas future lost $0.07 or 2.4% to $2.80/mmBtu. Natural gas inventory fell 14.7%.
The list below details some upside and downside risks relevant to the steel industry. The orange ones are occurring or look to be highly likely.
Upside Risks:
Downside Risks: