Content
-
Weekly Highlights
- Market Commentary
- Risks


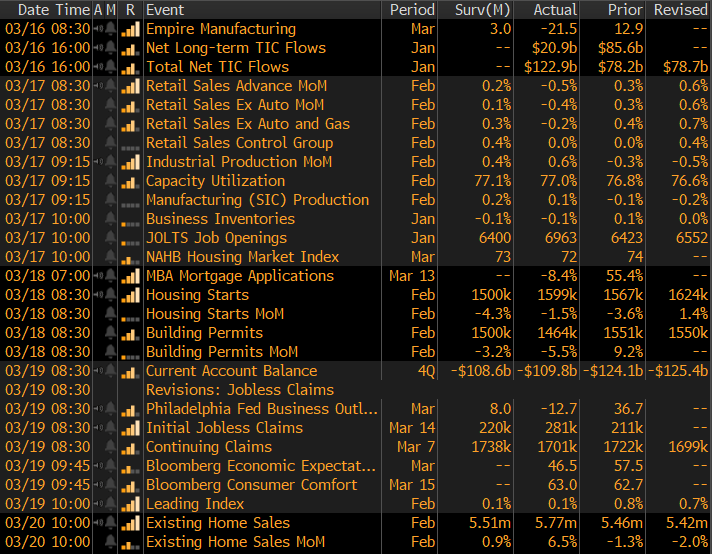
Many are discussing and predicting how bad the coronavirus health crisis will be for the economy. Over the last few weeks, updated estimates of second quarter GDP have been released showing expectations for a drop of 20-30%, and unemployment rising to levels not seen since the Great Depression. Many are drawing comparisons to the Global Financial Crisis of 2008/2009. How severely this crisis hits the economy will depend on how long it lasts, which nobody can possibly know right now. However, we do know that certain dynamics of the economic environment surrounding this crisis are different than 2008/2009, providing some optimism.
The US economy was stronger, and more stable, before this crisis than it was in 2007. Banks are much better capitalized as demonstrated in the annual supervisory stress test conducted by the Federal Reserve. Unemployment was at a historic low, and both individuals and businesses were able to strengthen their financial position during the economic recovery over the past 10 years. Another key difference is the amount of monetary and fiscal stimulus that the government will provide. The Federal Reserve has cut its key Fed Funds rate to zero, offered $1 trillion dollars in daily repos, support for individuals and small and large businesses totaling $4 trillion as well as unlimited Quantitative Easing. Congress is working to pass a fiscal stimulus bill, totaling over $2 trillion dollars. For comparison, the bank bailout in 2008 totaled $700 billion.
While the immediate goal of these stimulus measures is to alleviate the pain of the current crisis, the massive size of the stimulus will undoubtedly reverberate for months, or years, after the crisis ends, fueling economic growth. Additionally, we see a high likelihood that an infrastructure bill will pass within the next few years as cost becomes less of a limit with low interest rates and higher unemployment. This would provide additional tailwinds to the economy on the backside of the crisis. While the economic outlook in the short-term looks bleak, it appears the economy will have a very solid foundation to expand once this crisis passes.
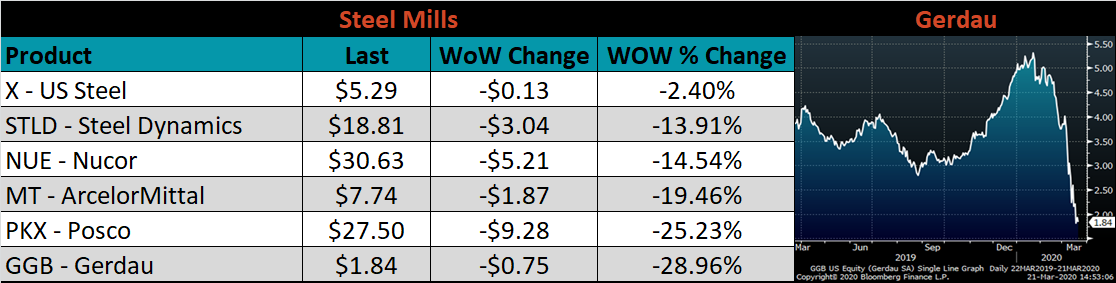
From the perspective of the steel market, the above policy actions will be supportive. However, the market has to go through some reckoning in order to get there. Over the next few months, there will be demand destruction. Automotive and energy orders at mills are already being canceled, and the future market prices are forecasting an oversupplied market. We have already seen announcements and rumors about capacity coming off from ArcelorMittal and US Steel. Depending on the length of factory closures, we may need to see more reductions for the market to reach a balance. If we do see the expected resurgence of demand towards the end of the year, capacity will need to be brought back on. Over the last year, several analysts predicted catastrophic price declines in the steel market as companies follow through with plans created after Section 232 to add additional production capacity. Much of this is scheduled to begin over the next year. The coronavirus crisis may cause the market to face this sooner than expected, and the production that is removed over the next several months may instead be replaced by new facilities once this crisis subsides.
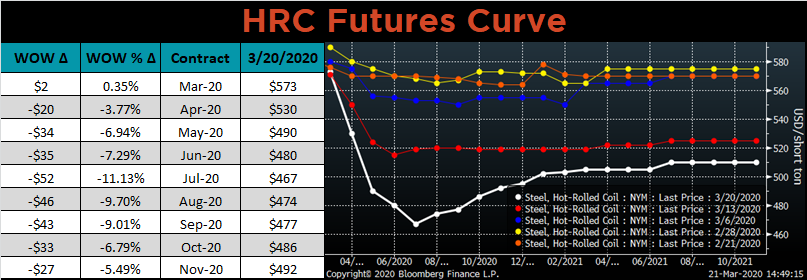
In terms of spot market pricing, not much has changed over the last week. However, there has been a flurry of activity in the future market. The curve continued to fall last week, reaching the lowest levels since last October. Despite this excessive selling from others in the market, we had several customers realize the opportunity of the depressed curve and lock in future material and prices. Here at FGM, we are doing the same because we do not expect the curve to remain this low for long.
Below are the most pertinent upside and downside price risks:
Upside Risks:
Downside Risks:
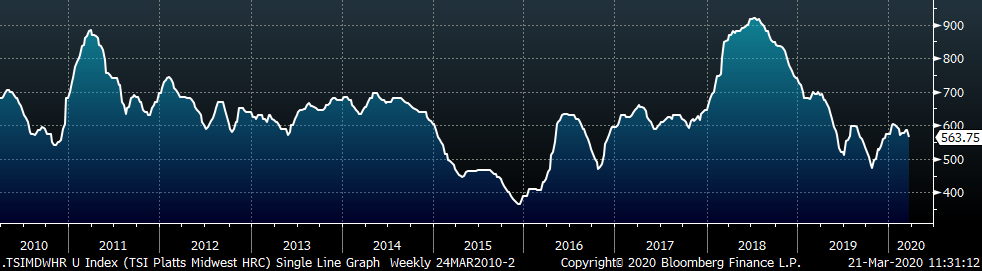
The Platts TSI Daily Midwest HRC Index was down $23.25 to $563.75.
The CME Midwest HRC futures curve is below with last Friday’s settlements in white. The entire curve moved down, most dramatically over the next 6 months.
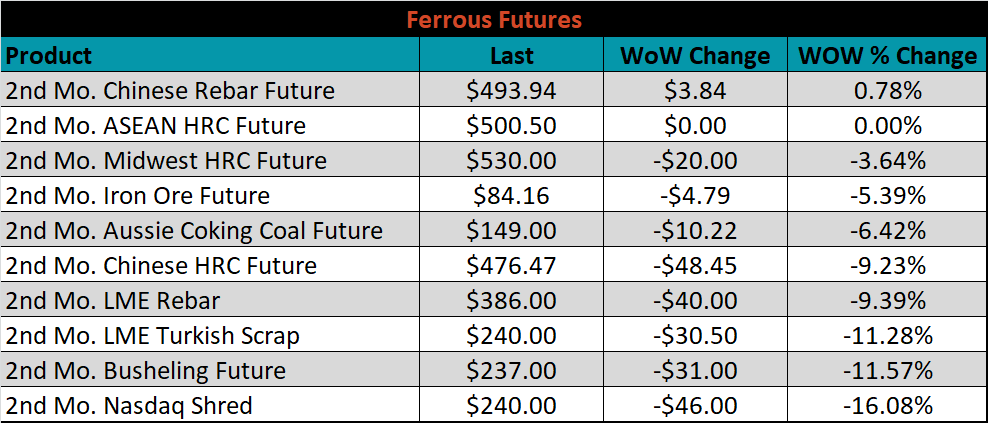
March ferrous futures were mostly lower. The Chinese rebar future gained 0.8%, while Nasdaq shred lost 16.1%.
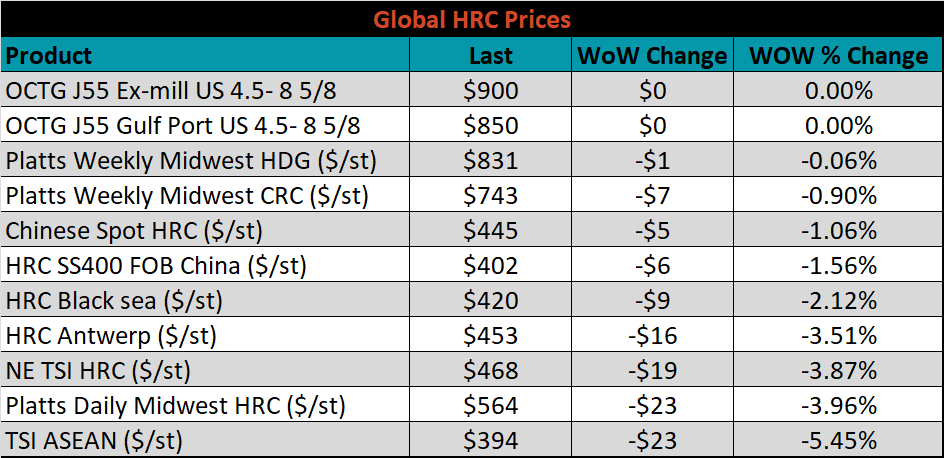
The global flat rolled indexes all lower, led by TSI Asean and TSI Midwest HRC, down 5.5% and 4%, respectively.
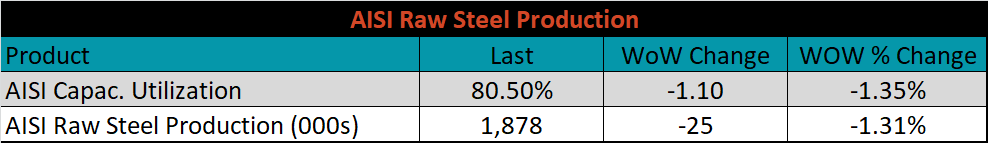
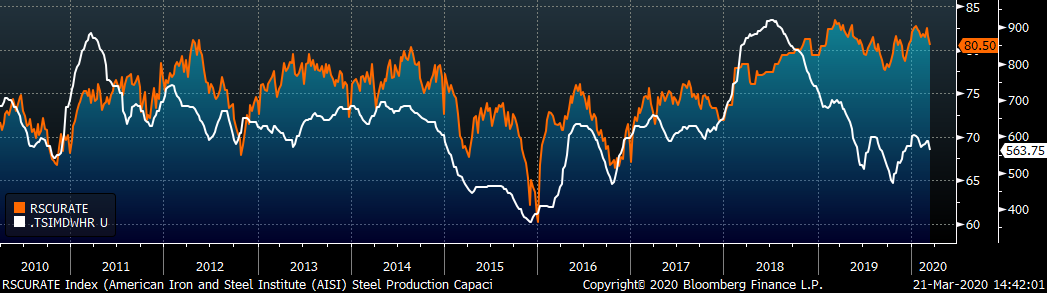
The AISI Capacity Utilization Rate was down 1.1% to 80.5%.
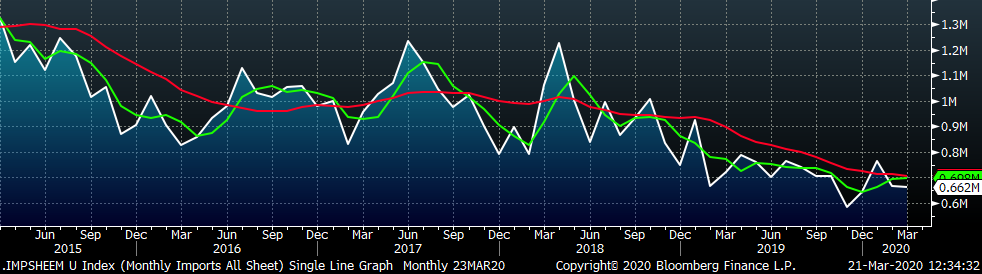
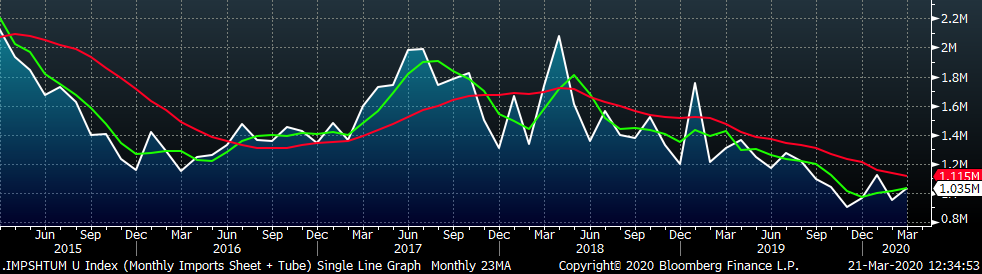
March flat rolled import license data is forecasting a decrease of 6k to 662k MoM.
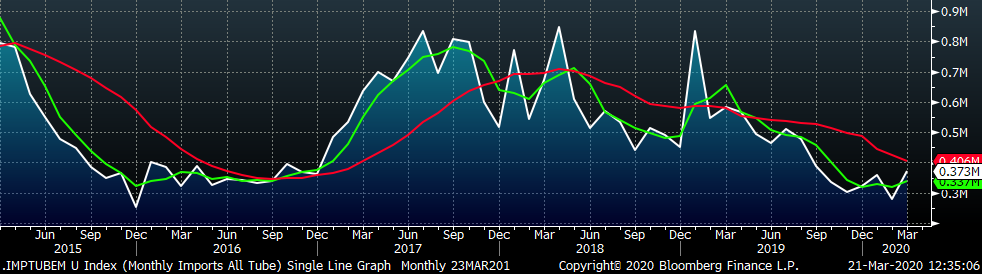
Tube imports license data is forecasting a MoM increase of 93k to 373k tons in March.
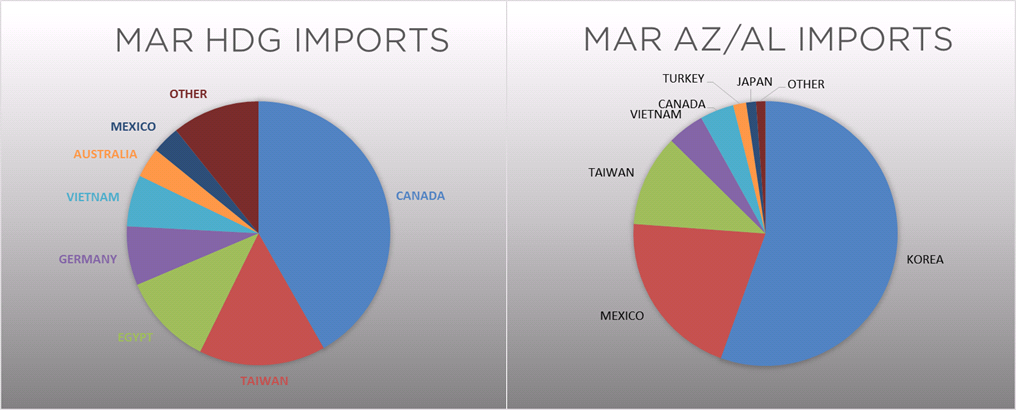
AZ/AL import license data is forecasting an increase of 2k in March to 62k.
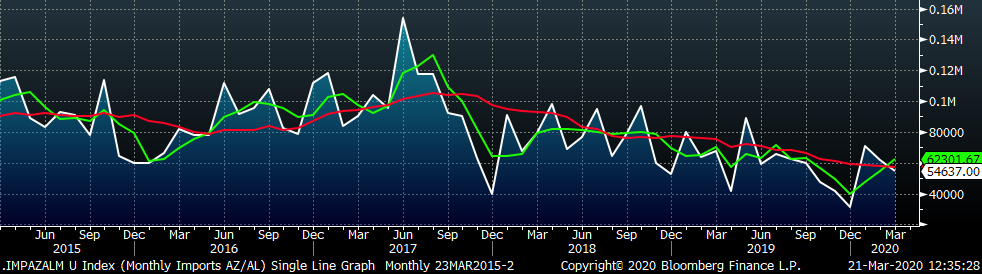
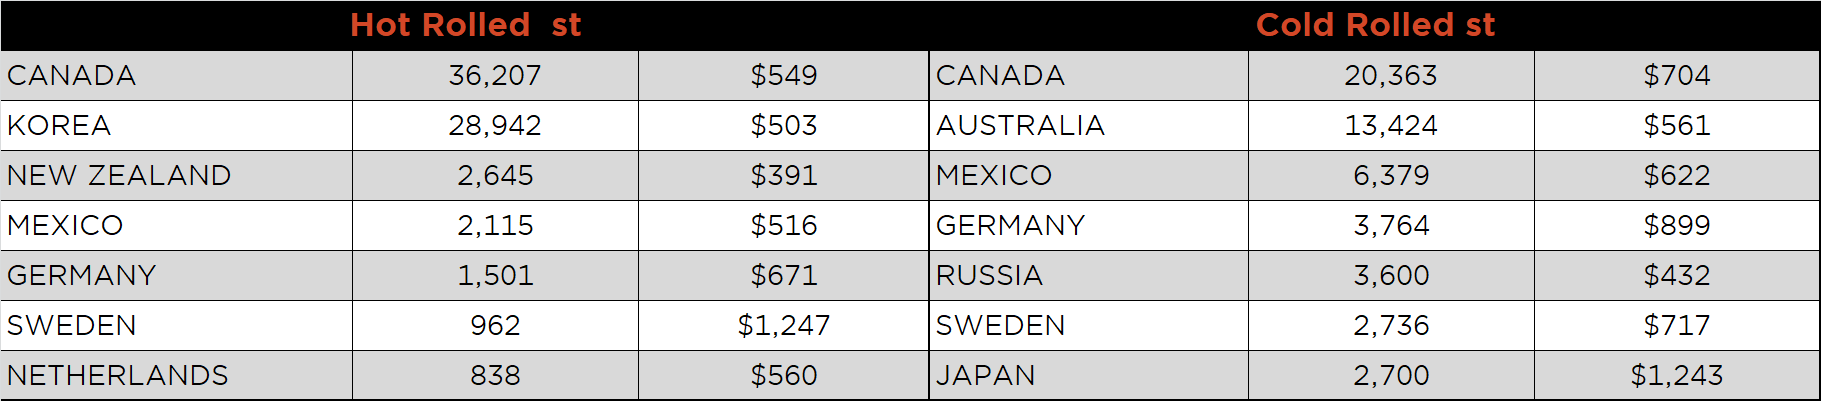
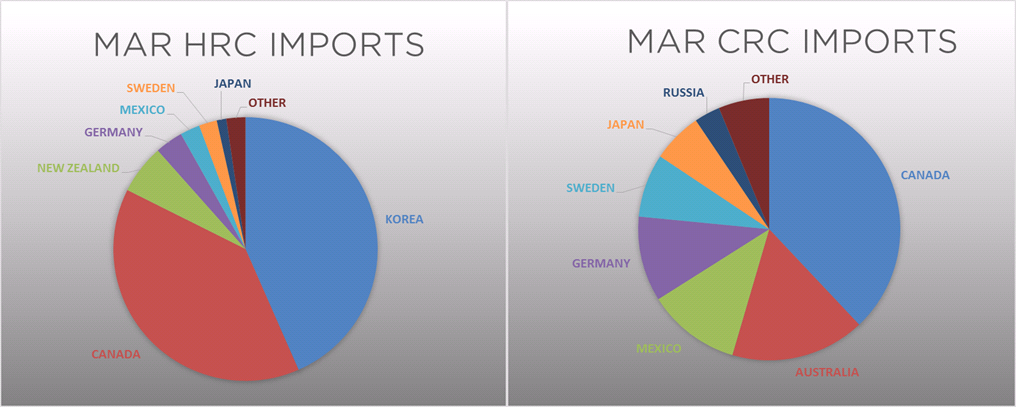
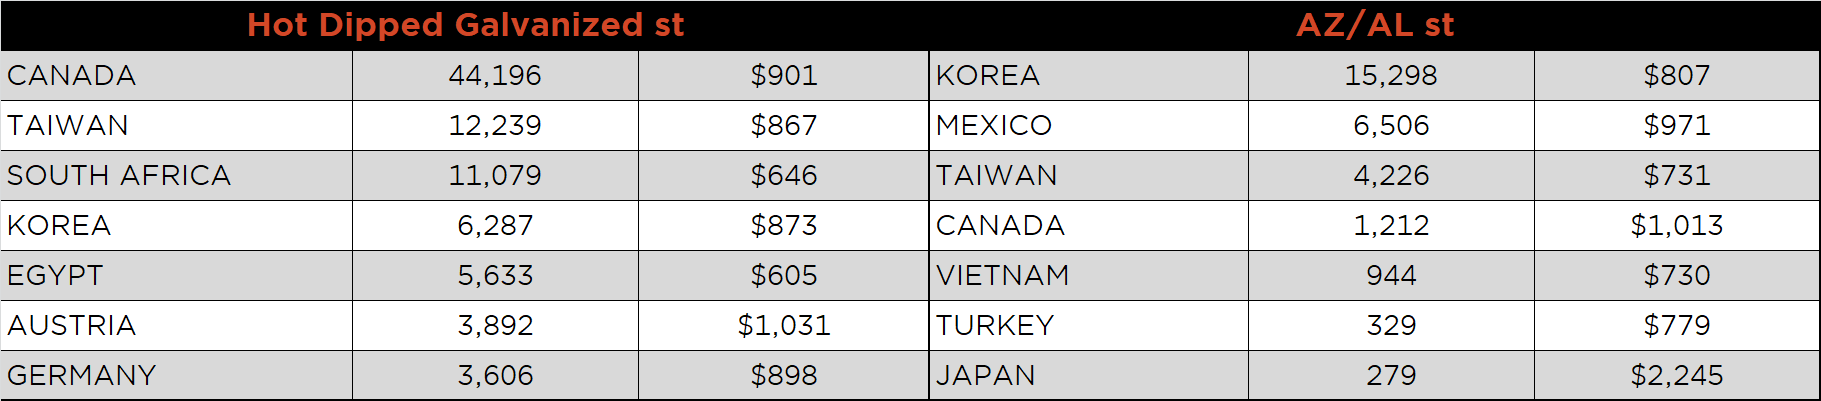
Below is February import license data through March 17, 2020.
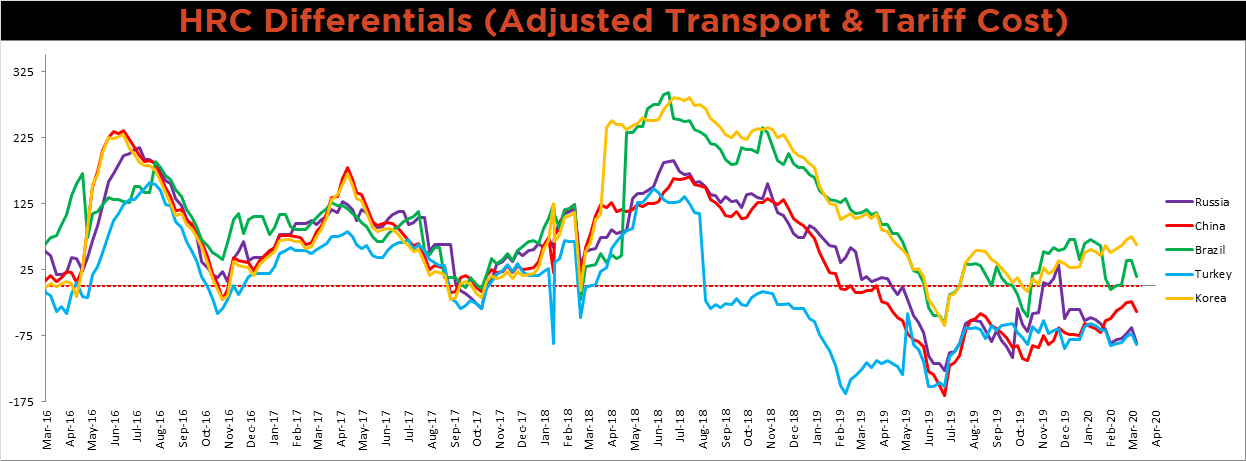
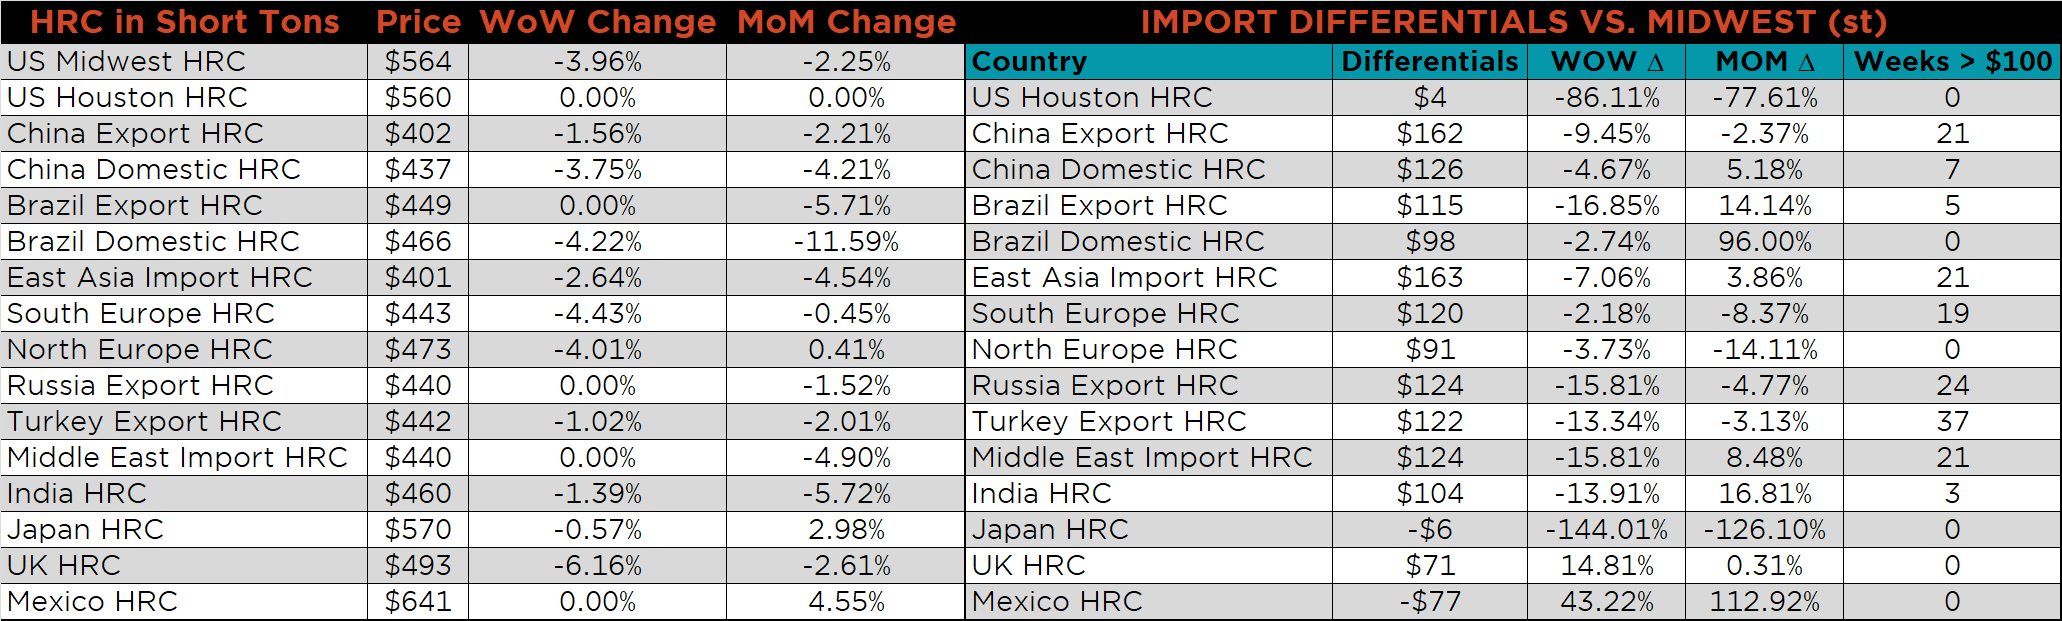
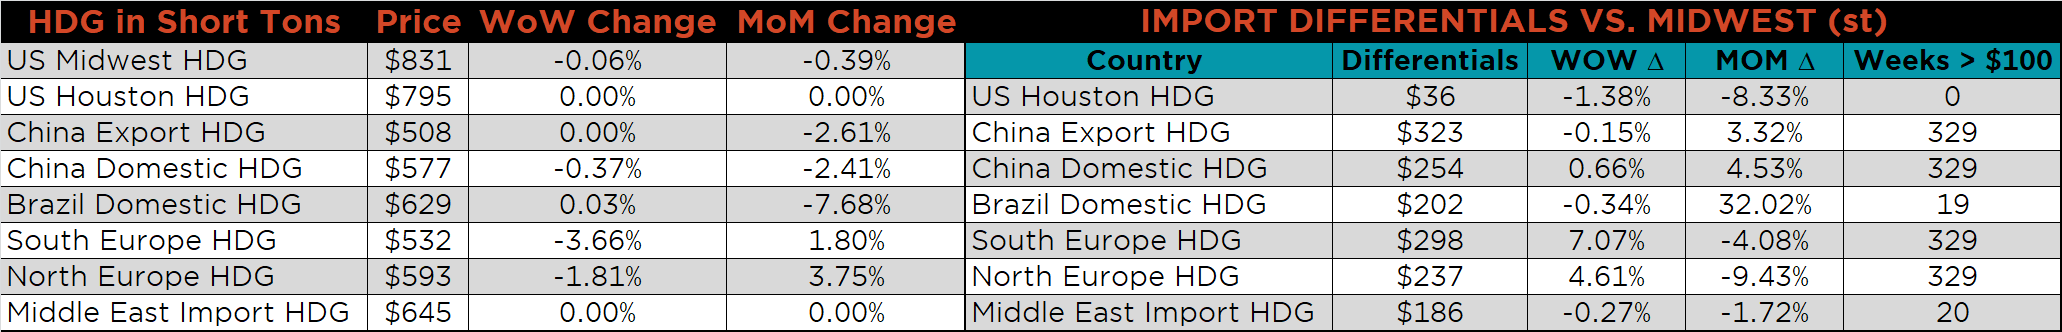
Below is the Midwest HRC price vs. each listed country’s export price using pricing from SBB Platts. We have adjusted each export price to include any tariff or transportation cost to get a comparable delivered price. All of the differentials fell dramatically as the U.S. domestic price was down over $23 compared to last week.
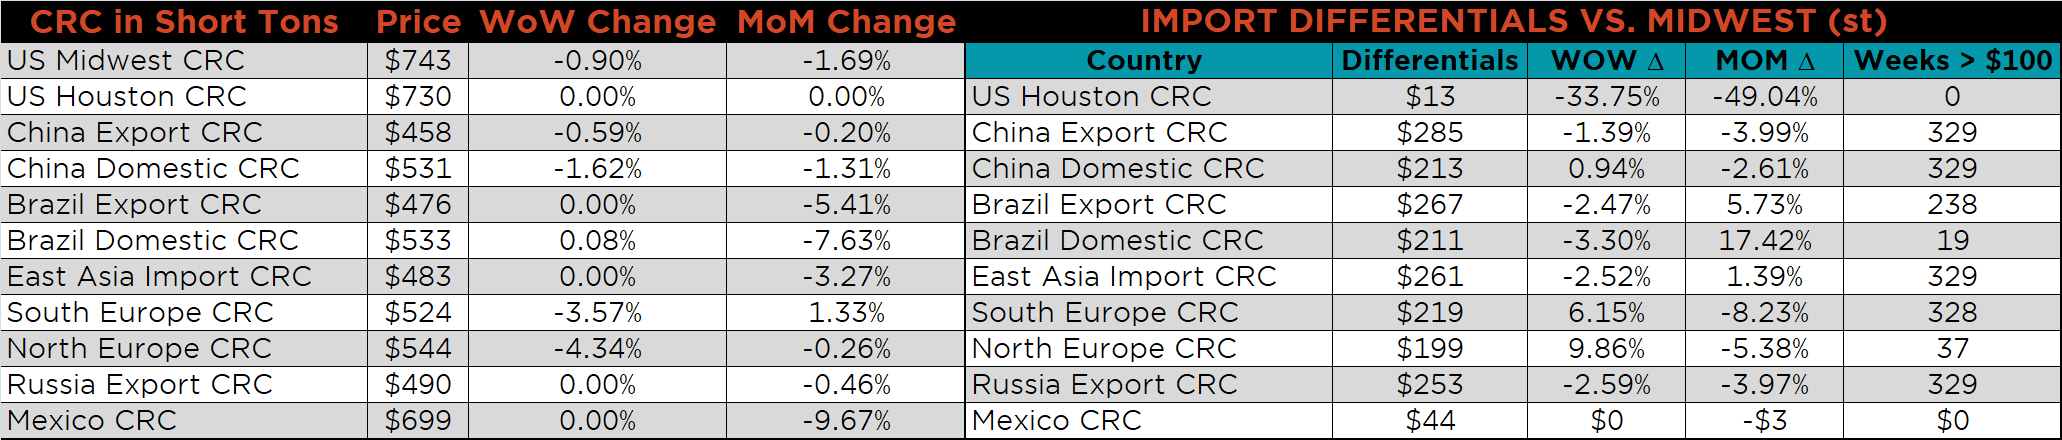
SBB Platt’s HRC, CRC and HDG pricing is below. The Midwest HRC, CRC and HDG prices were down 4%, 0.9% and 0.1%, respectively. The Chinese HRC price was down 1.6%.
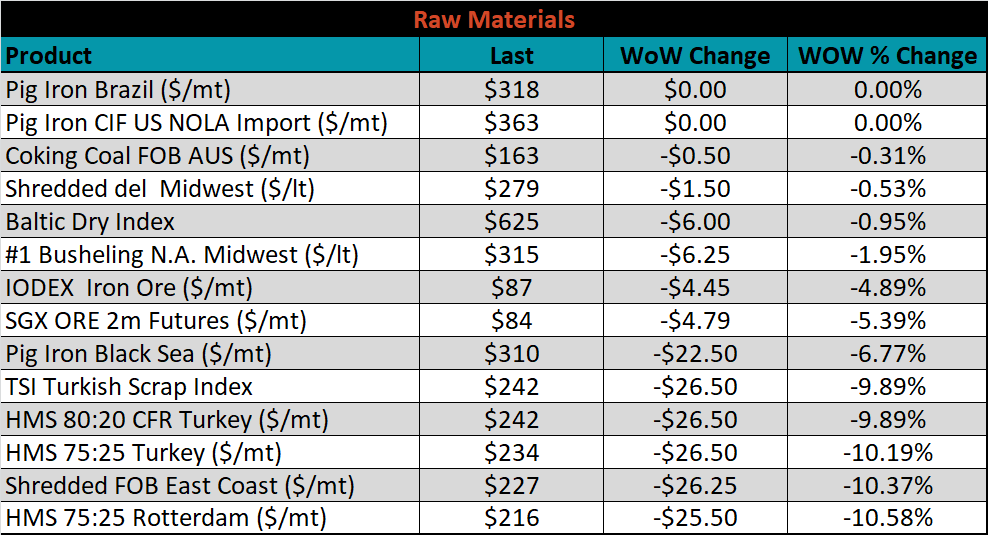
Raw material prices were unchanged or lower. The Brazilian pig iron future was flat, while Rotterdam HMS was down 10.6%.
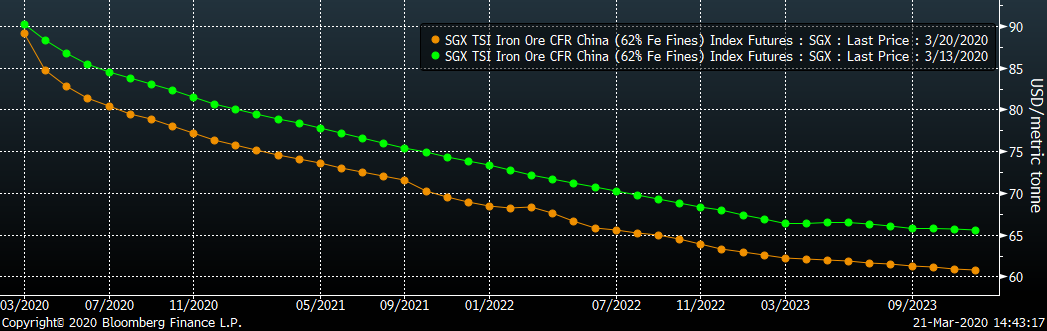
Below is the iron ore future curve with Friday’s settlments in orange, and the prior week’s settlements in green. The entire curve shifted lower.
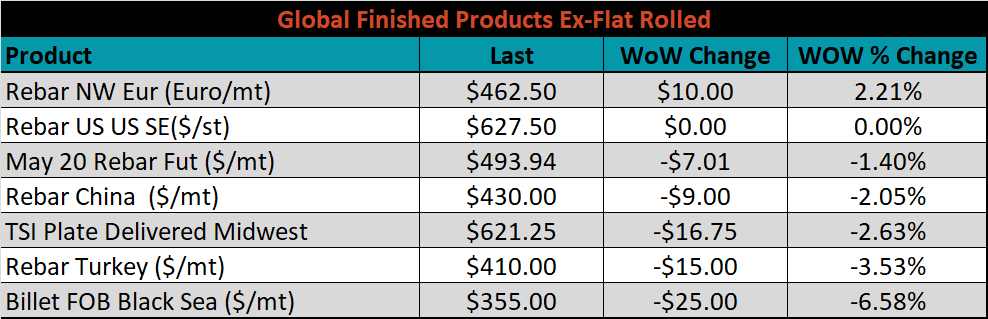
The ex-flat rolled prices are listed below.

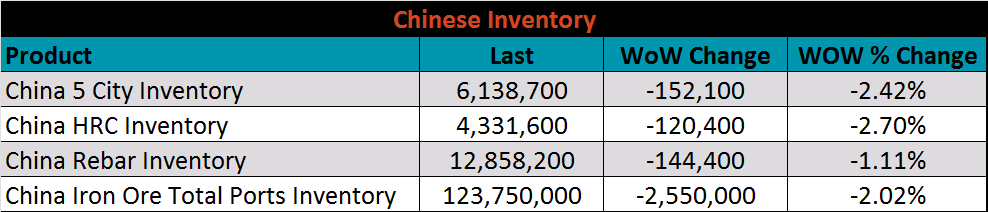
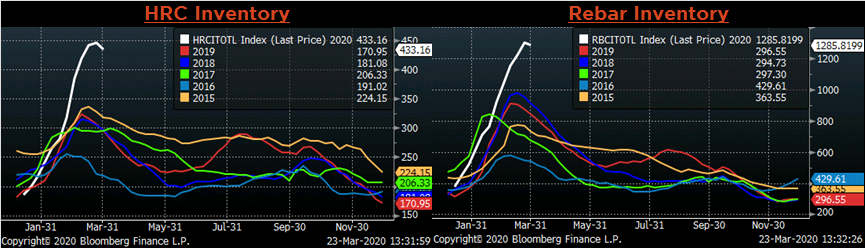
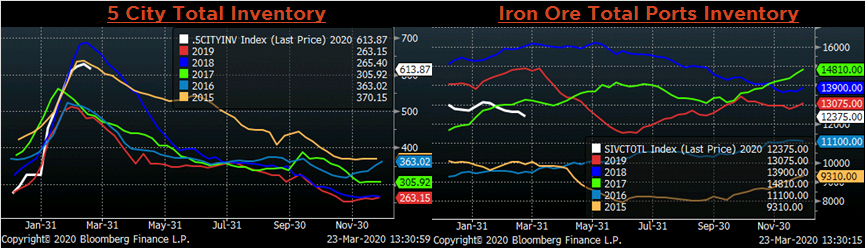
Below are inventory levels for Chinese finished steel products and iron ore. All of the inventory levels were lower for the first time this year. We have already seen pressure on the Chinese HRC forward curve likely due, in part, to the oversupply shown below. With global demand at such low levels due to the coronavirus pandemic, we anticipate continued short-term downward pressure on the price of Chinese HRC.
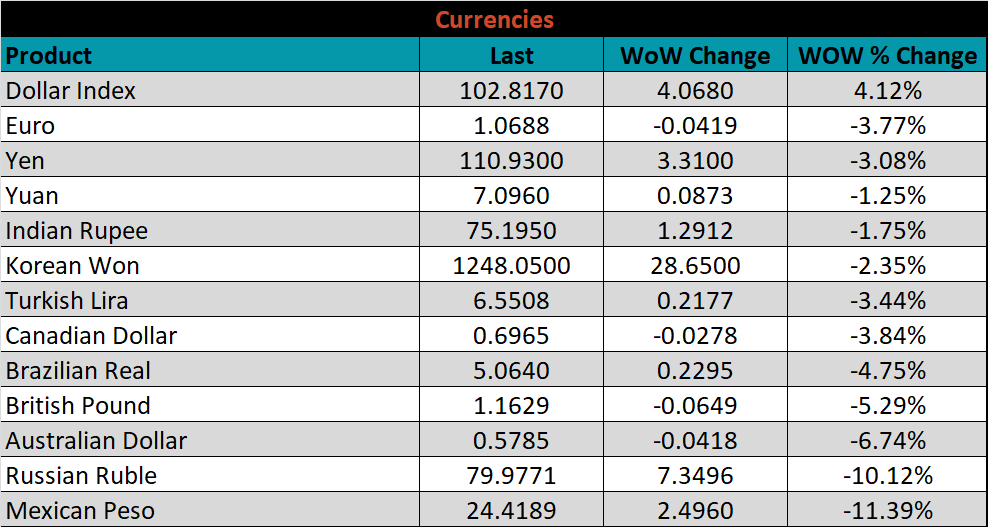
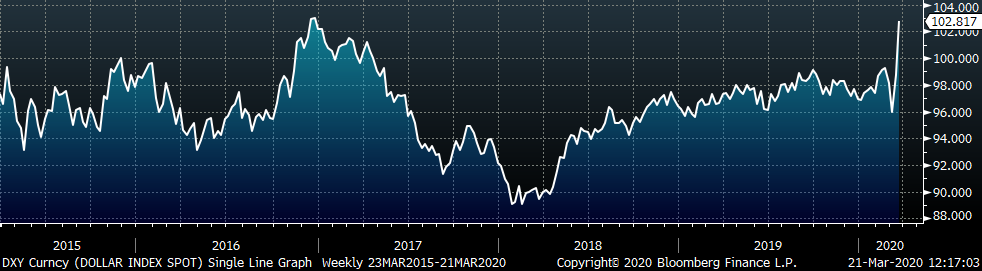
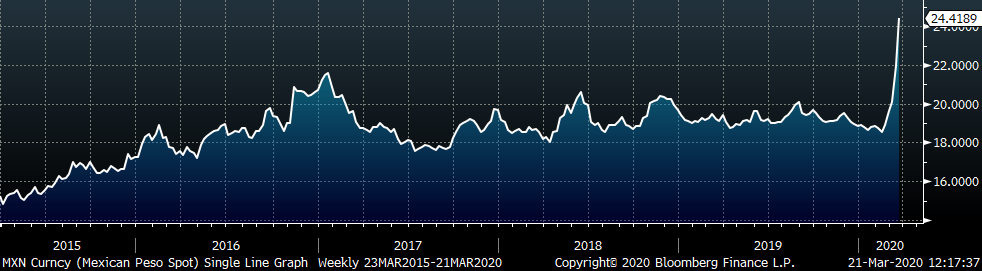
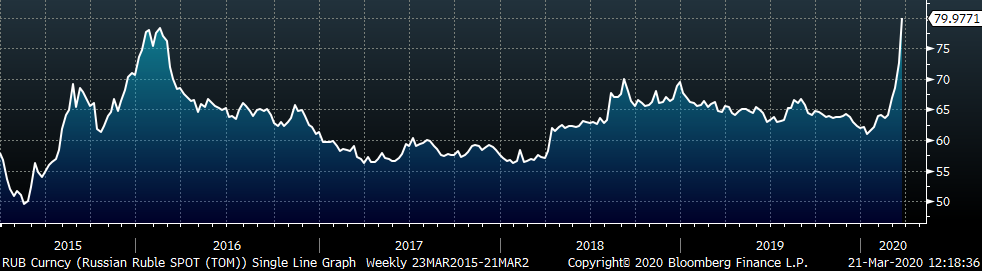
The U.S. dollar gained 4.07 to 102.82, while the Mexican Peso and Russian Ruble were both down double digits, 11.4% and 10.1% respectively. A strong dollar will weigh on commodity prices – commodities priced in dollars become more expensive for buyers in other currencies.
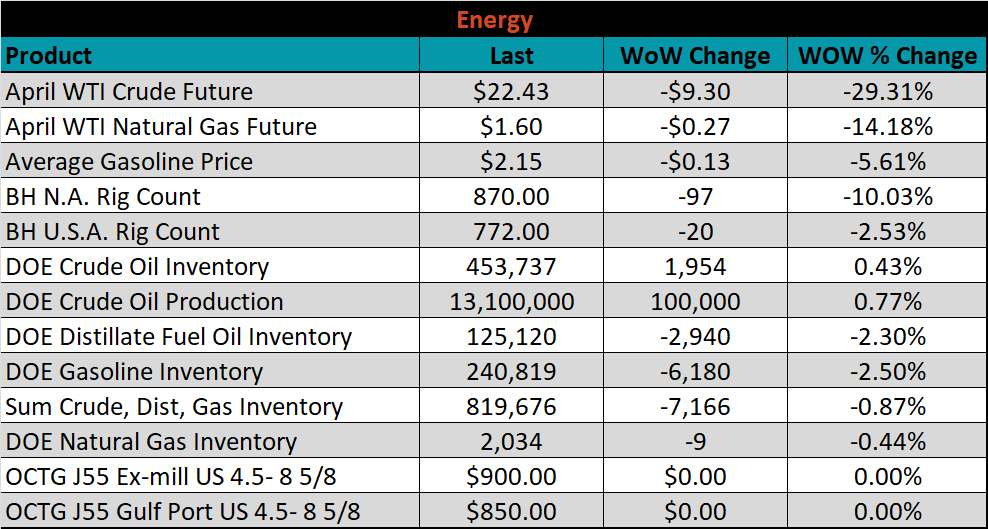
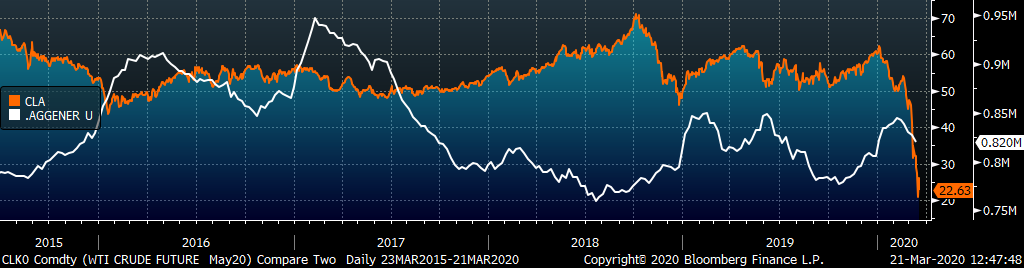
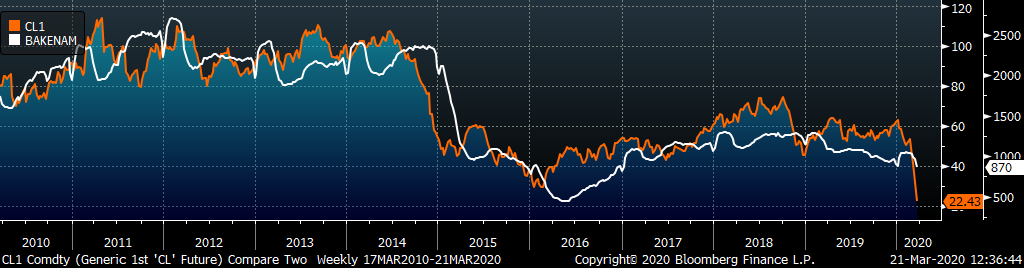
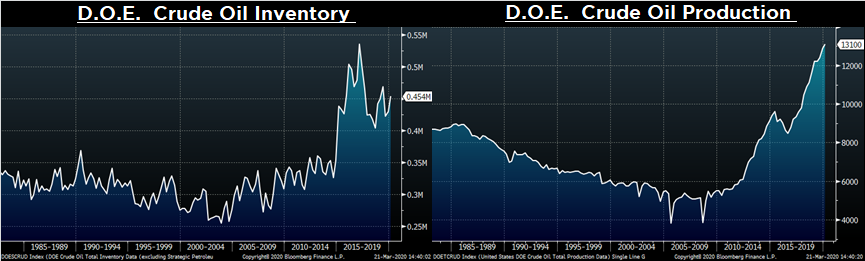
Last week, the April WTI crude oil future lost another $9.30 or 29.3% to $22.43/bbl. The aggregate inventory level was down 0.9% and crude oil production rose to 13.1m bbl/day. The Baker Hughes North American rig count was down 97 rigs, while the U.S. rig count was down 20 rigs. Without a compromise in the price war between Saudi Arabia and Russia, or a shift in demand outlook, prices are seeing little support.
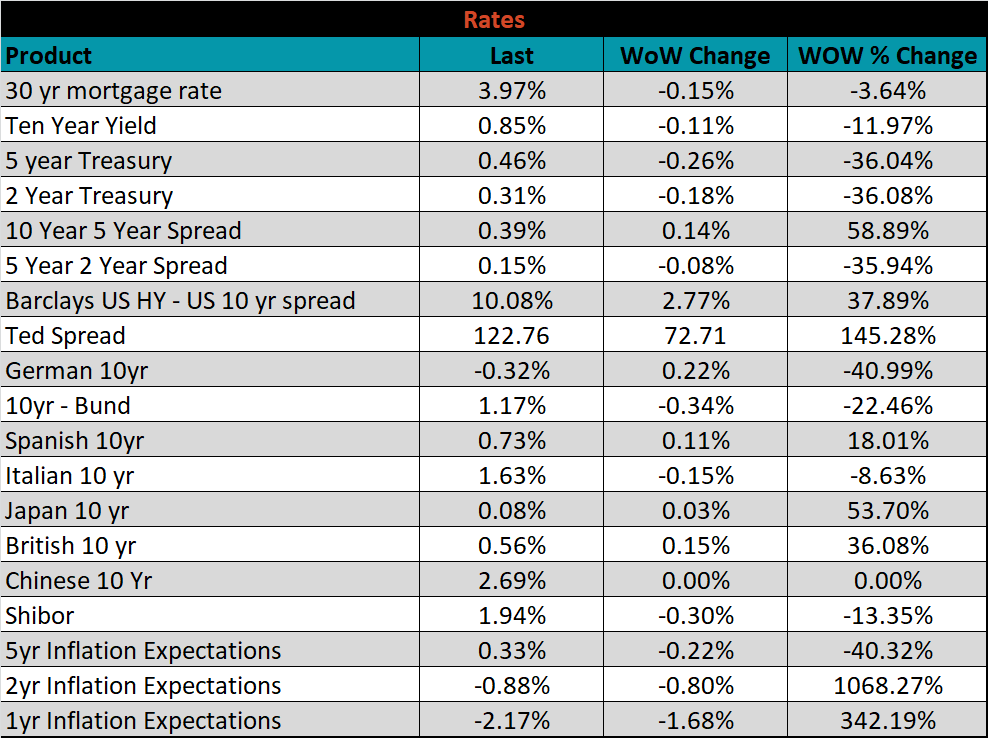
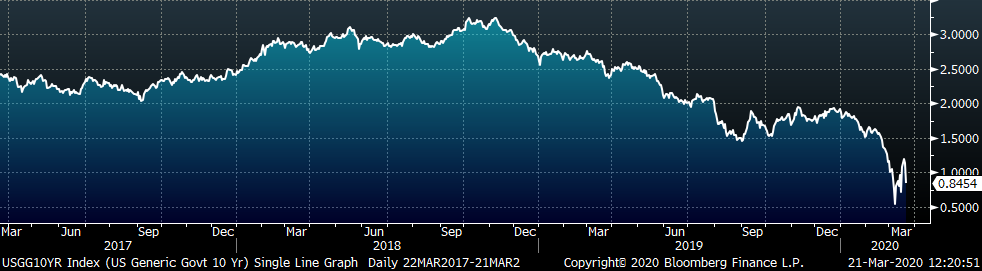
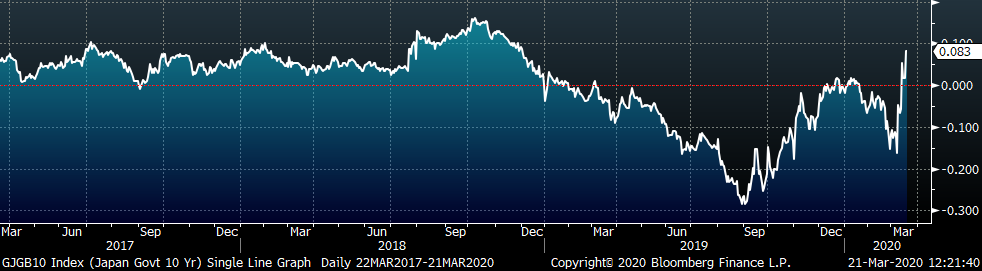
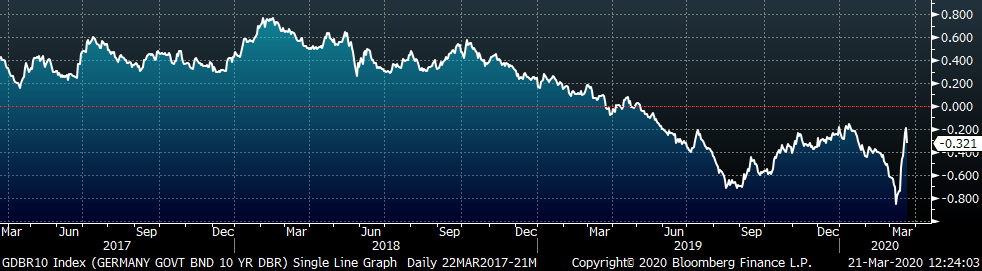
The U.S. 10-year yield was down 11 bps, closing the week at 0.85%. The German 10-year yield was up another 22 bps to minus 0.32% while the Japanese 10-year yield was up 3 bps to 0.08%. Inflation expectations continue to move lower, signaling the headwinds for economic growth.
The list below details some upside and downside risks relevant to the steel industry. The orange ones are occurring or look to be highly likely. The upside risks look to be in control.
Upside Risks:
Downside Risks: