Content
-
Weekly Highlights
- Market Commentary
- Risks


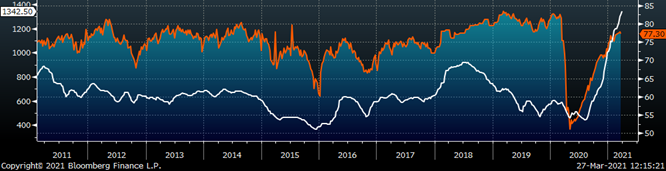
After a few weeks of apparent price consolidation at $1,300 for spot HRC, last week, the ferrous complex showed further strength with mills moving quotes above $1,350 with the spot indexes not far behind. This comes as March will soon surpass February with the highest HRC prices on record, just like February did to January. As the dust continues to settle, there is additional clarity on some of the optimism from the buying community referenced in last week’s report. This week, we will look at recent trends in supply and demand within the domestic market ahead of the new slew of economic releases coming on the first of the month.
Every week, we track new import orders and mill production, which can be found further below in every report. This process was even more vital as the severity of the supply shortage became clear late in the summer of last year. After receiving final census data for February imports, we see the first true evidence to match recent anecdotes that Imports are in fact coming in above the severely depressed levels we saw last year. On top of that, mills continue to increase production and are looking to June/July as the point at which they could catch up on their order books. Using these recent trends, we have created a simple scenario projection (below) to look at where the supply side could be in 6-months.
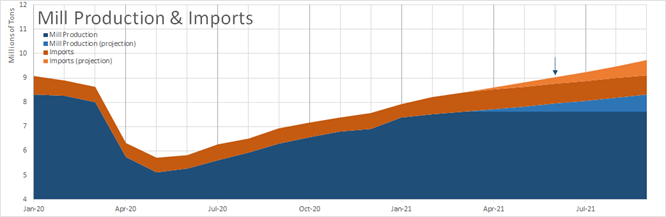
The darker shades represent current levels, and the lighter shades show a continuation of recent growth rates. Also, the blue arrow represents the point where supply returns the January 2020 pre-pandemic level. One might look to the futures market and assume that the second half of the year is the breaking point for the price of HRC, which incidentally sold off significantly last week. But that is only half of the story.
Potential demand erosion is another concept that has received much attention since the HRC price started to climb, with many participants expressing concern over final goods becoming too expensive. However, we look to the Regional Fed Manufacturing reports for March (below) for a more current gauge of demand at these elevated prices.
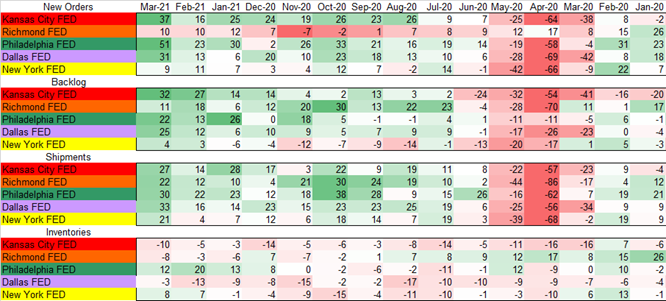
We see continued, broad strength in New Orders after last month’s dip. Additionally, there were increases in Backlogs and Shipments, while Inventories remain low. Finally, it is important to remember that with inventories still at diminished levels, restocking will be necessary in the months ahead, which would boost the current demand, possibly to levels that match the projected supply growth. Therefore, while elevated supply is needed in this steel short market, it does not necessarily indicate that prices must move lower immediately, due to the also necessary restocking. With that in mind, it is important to look at your own backlog and determine whether last week’s approximately $50 decrease in HRC futures pricing for the 2nd half of this year provides enough margin to lock in prices.
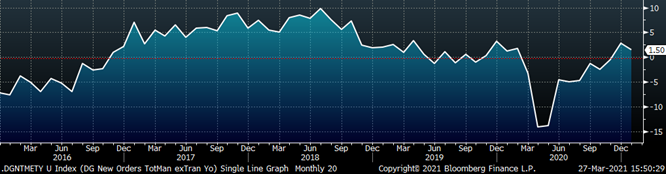
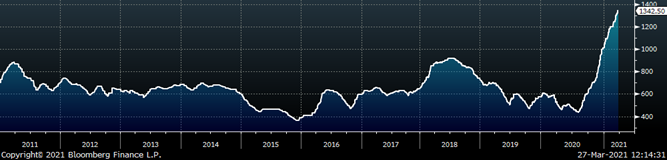
Below are final January new orders from the Durable Goods report. New orders for manufactured goods were up 1.3% compared to January 2020, but down 6.3% compared to December. Manufacturing ex-transportation new orders were up 1.5% YoY, but 4.5% lower than December. The final chart looks at the months on hand (inventory divided by shipments) for durable goods categories that are steel intensive. MOH increased slightly compared to December and is in line with the 12-month moving average.


Below are the most pertinent upside and downside price risks:
Upside Risks:
Downside Risks:
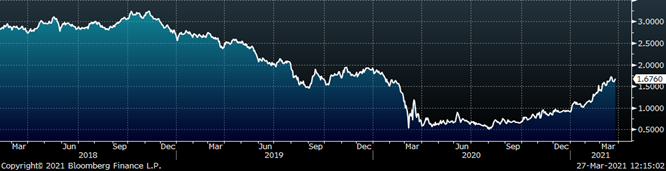
The Platts TSI Daily Midwest HRC Index increased by $31 to $1,342.50.
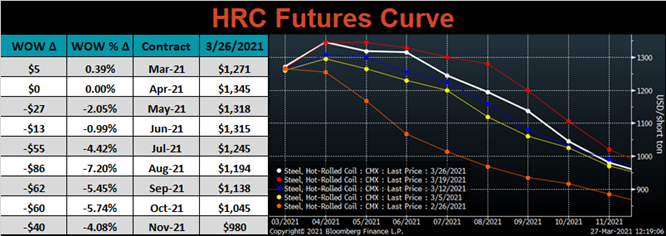
The CME Midwest HRC futures curve is below with last Friday’s settlements in white. Last week, the curve shifted lower across nearly all expirations, most significantly in the back. Even after last week’s sell-off prices remain above their levels from two weeks ago.
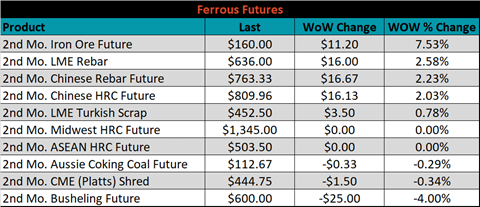
April ferrous futures were mixed. The April iron ore future gained 7.5%, while busheling lost 4%.
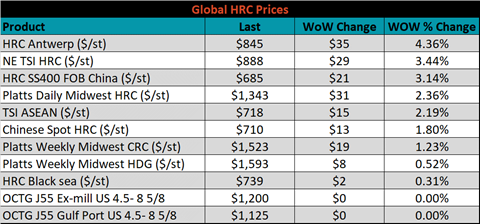
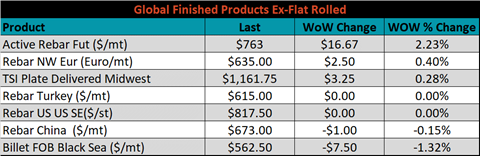
Global flat rolled indexes were all higher, led by Antwerp HRC, up 4.4%.
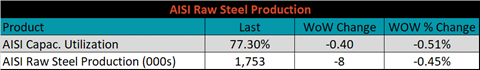
The AISI Capacity Utilization rate decreased 0.4% to 77.3%.
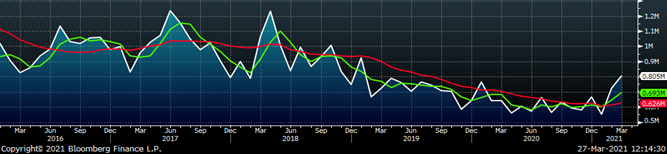
March flat rolled import license data is forecasting an increase of 84k to 805k MoM.
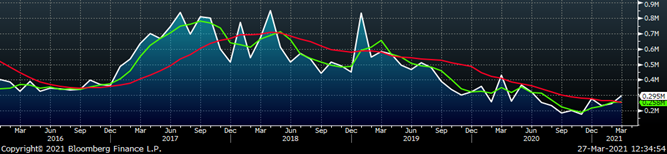
Tube imports license data is forecasting an increase of 49k to 295k in March.
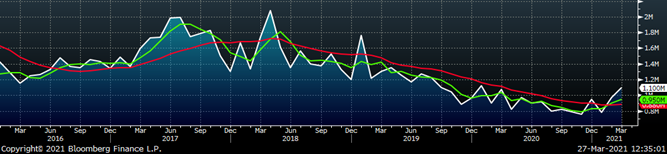
March AZ/AL import license data is forecasting an increase of 75k to 113k.
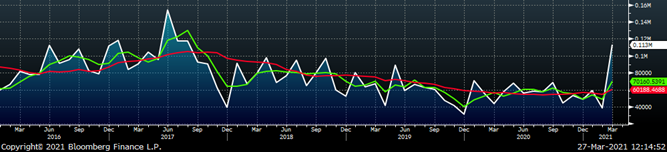
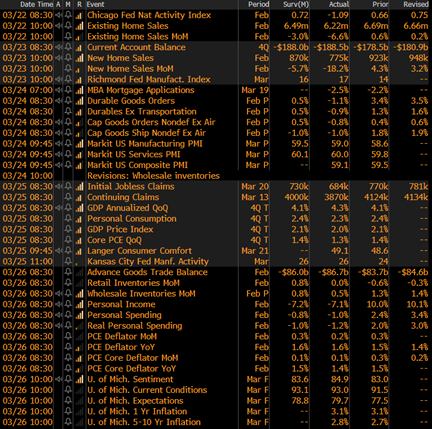
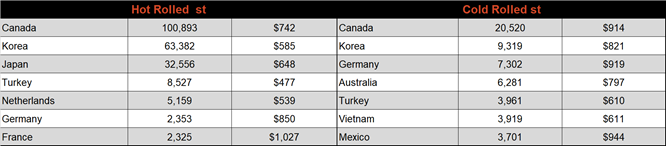
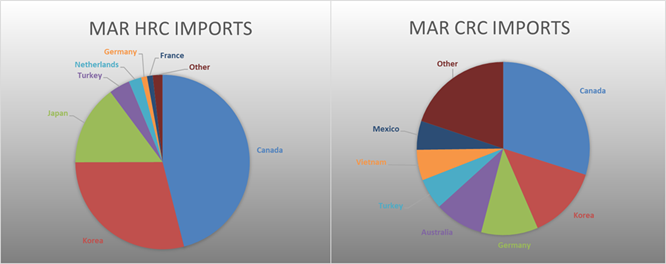
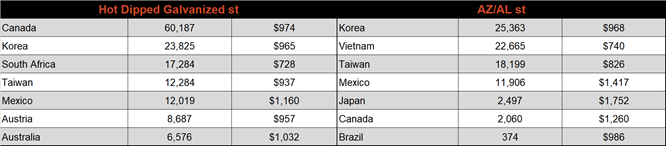
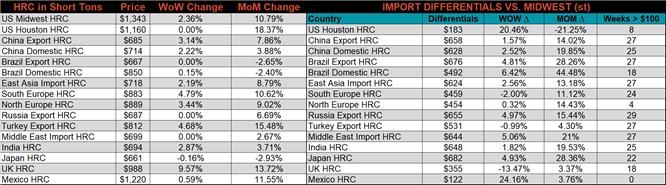
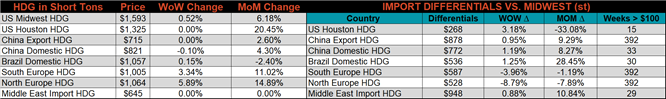
Below is March import license data through March 23, 2021.
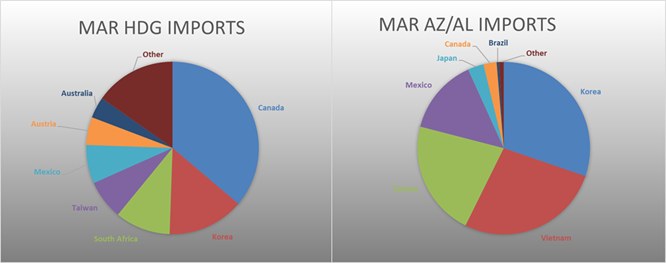
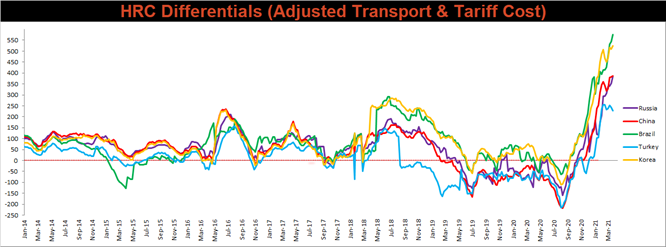
Below is the Midwest HRC price vs. each listed country’s export price using pricing from SBB Platts. We have adjusted each export price to include any tariff or transportation cost to get a comparable delivered price. The Turkish and Chinese differentials decreased, with their respective export prices outpacing that of the U.S. price, while the remaining differentials increased this week.
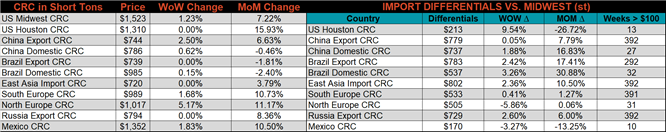
SBB Platt’s HRC, CRC and HDG pricing is below. The Midwest HRC, CRC & HDG prices were up 2.4%, 1.2% and 0.5%, respectively. Globally, the Turkish HRC export price was up another 4.7%.
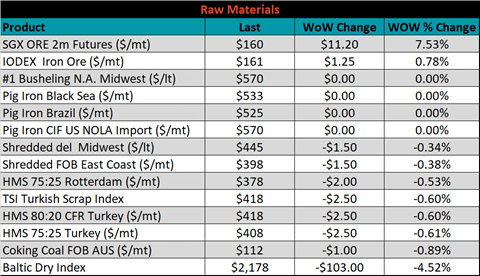
Raw material prices were mixed, April iron ore futures gained 7.5%, while Aussie coking coal was down 0.9%.
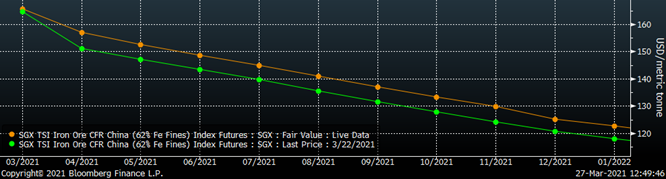
Below is the iron ore future curve with Friday’s settlements in orange, and the prior week’s settlements in green. Last week the curve shifted higher across all expirations
The ex-flat rolled prices are listed below.

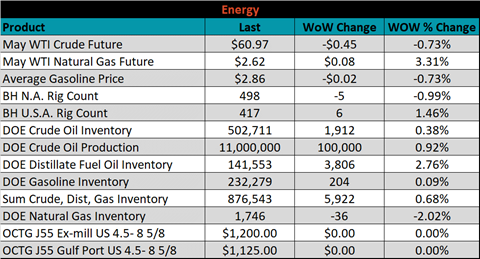
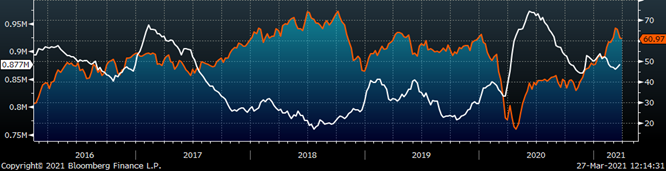
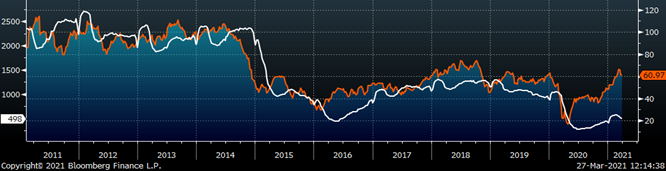
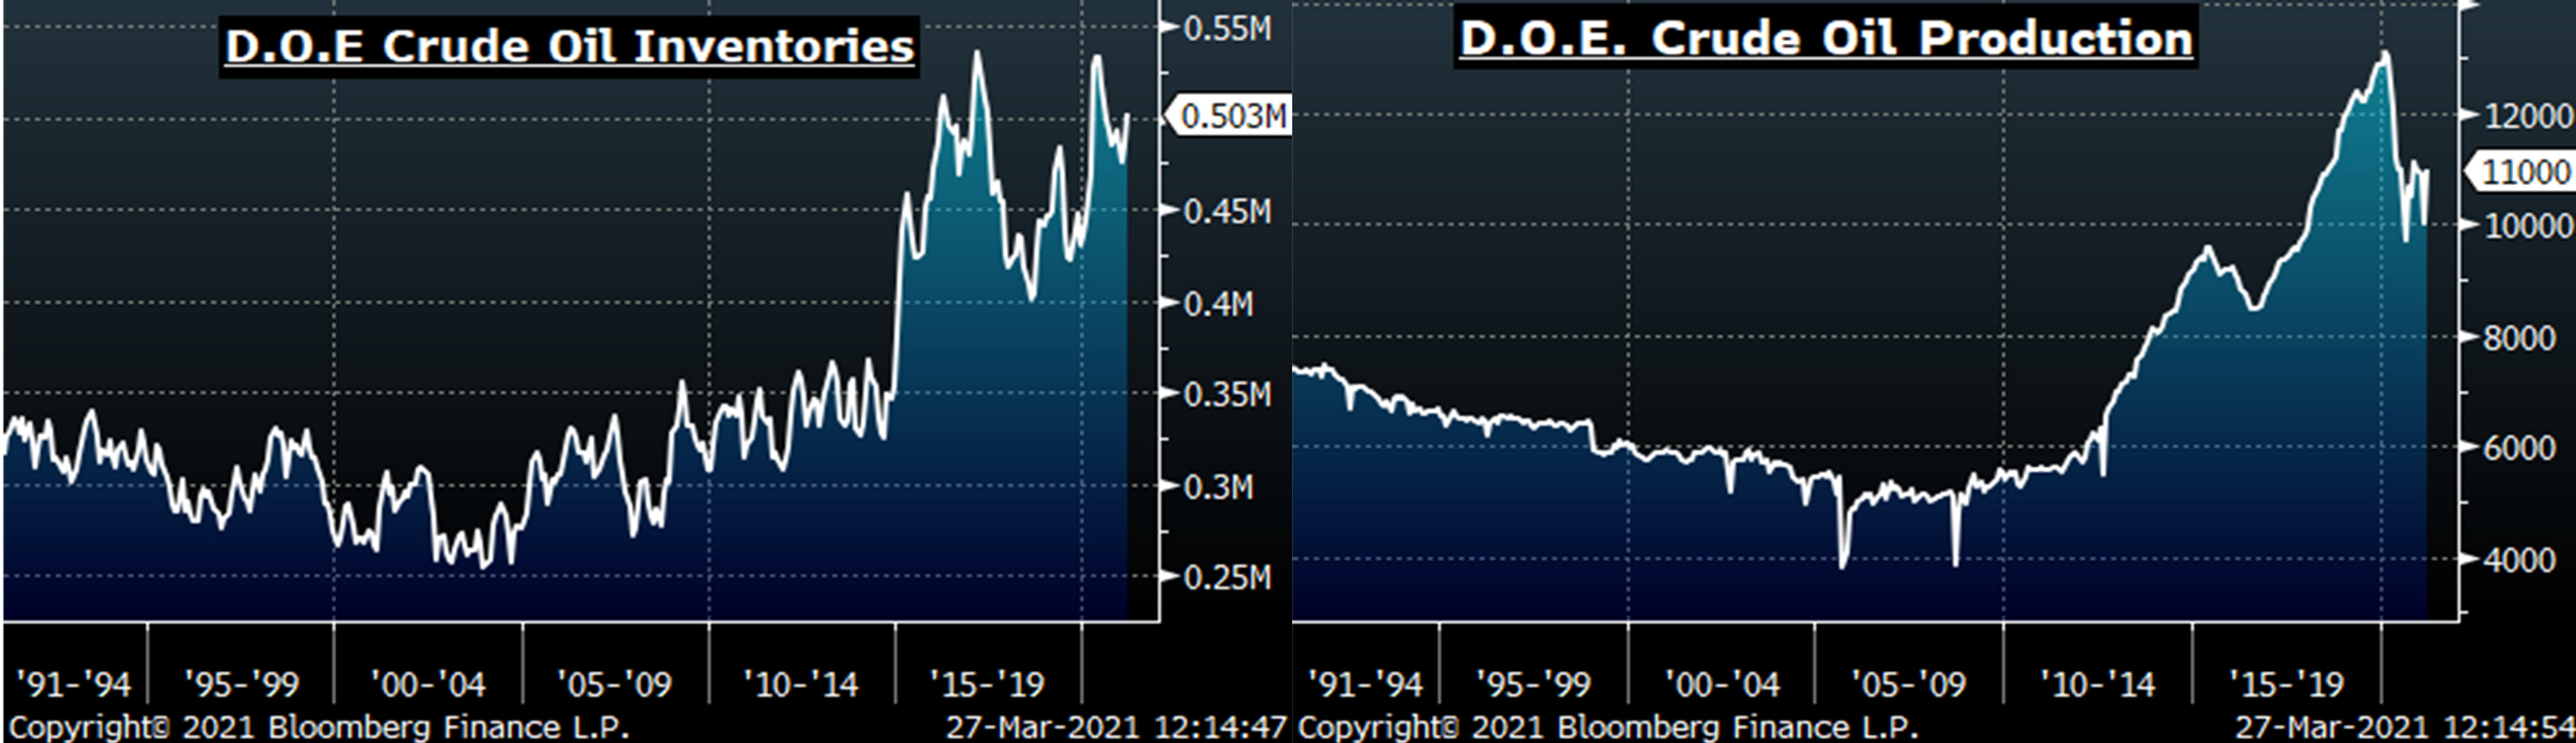
Last week, the May WTI crude oil future was down another $0.45 or 0.70% to $60.97/bbl. The aggregate inventory level was up 0.7% and crude oil production increased to 11m bbl/day. The Baker Hughes North American rig count was down another 5 rigs, while the U.S. rig count was up 6 rigs.
The list below details some upside and downside risks relevant to the steel industry. The orange ones are occurring or look to be highly likely. The upside risks look to be in control.
Upside Risks:
Downside Risks: