

March 5, 2021

Market Commentary
Across the domestic ferrous market last week, we saw a general “throwing in of the towel” throughout the physical market, the future market and the pundit community. Physically, spot HRC prices are nearing $1,300/st, with some mills heard offering potential availability at even higher prices. The buying community seems to have accepted that last year’s prices are nowhere in the near future, and pulled the trigger to secure material at current prices. Speculators in the future market who have held short positions for the past several weeks appear to have reluctantly covered their shorts as the curve moved up astronomically. The future expiring in July was up over $180/st, a 15% move in just one week. Journalist and analysts have come to terms with the fact that their bearish outlooks since last fall have proven flawed at best. Price targets for the rest of 2021 and beyond are being raised to match the strength that is apparent in the physical spot market. This week we will look at what went wrong with the case for lower prices in order to understand what relevant data and analysis should be used going forward.
Looking back to publications from the fall, predictions for lower steel prices in 2021 were based on three main themes including increased domestic production, increasing imports, and weak demand. Looking at the supply side first, analysts looked at historical trends showing domestic producers bringing on production and capacity as prices rise. They also incorporated planned supply additions into their current supply outlook and doomsday price predictions. However, as production has consolidated into four main producers in the U.S., historical models appear less reliable as production levels remain below pre-pandemic levels despite prices at levels more than two times higher than the historical average.
Imports were supposed to surge due to elevated price differentials and the possibility of easing trade restrictions from a new administration. However, this massive inflow has yet to appear in trade data, as Sections 232 tariffs remain in place for the foreseeable future, and global strength in prices and similarly tight supply in foreign markets prevent rapid changes in the domestic import market.
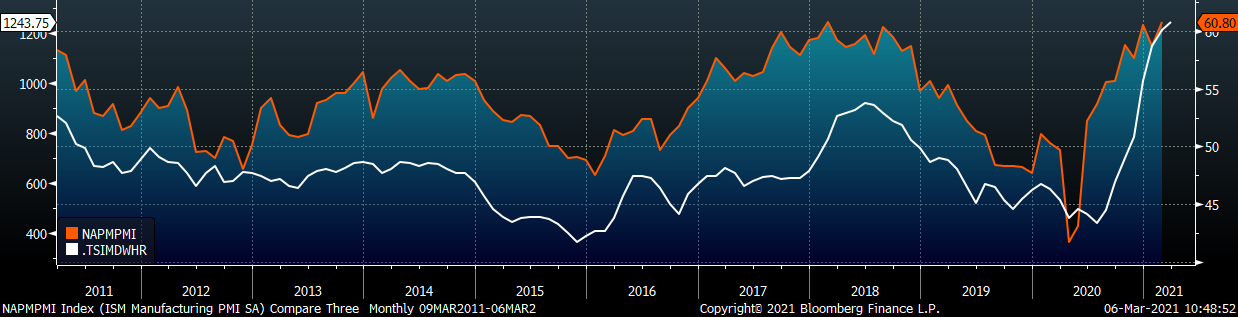
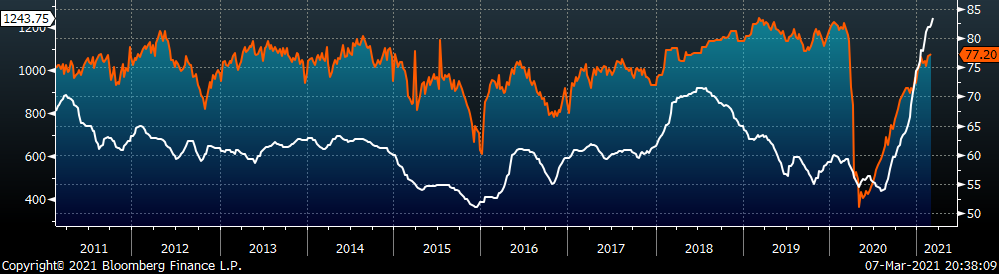
Finally, we have heard for months that elevated prices were unsustainable because demand would decline as prices moved higher. Interestingly, this rhetoric was most prevalent from publications uninvolved in the physical steel trade and buyers who were sitting on the sidelines. Moreover, it started in November when prices were at $700. What these prognosticators missed was strength in the demand recovery for steel related products. While the economy as a whole recovered a modest pace, the manufacturing sector came roaring back, as evidenced by the below chart comparing the Platts Midwest HRC index (white) and the ISM Manufacturing PMI (orange).
Demand continues to recover at an elevated pace, and we’re seeing steel consuming businesses growing volumes compared to pre-pandemic levels. Even the sectors that were troublesome last year, such as energy, are bouncing back rapidly. The below report is heavy in economic data points that show growing demand for goods as well as continued strength in ferrous related commodity markets across the globe.
ISM PMI
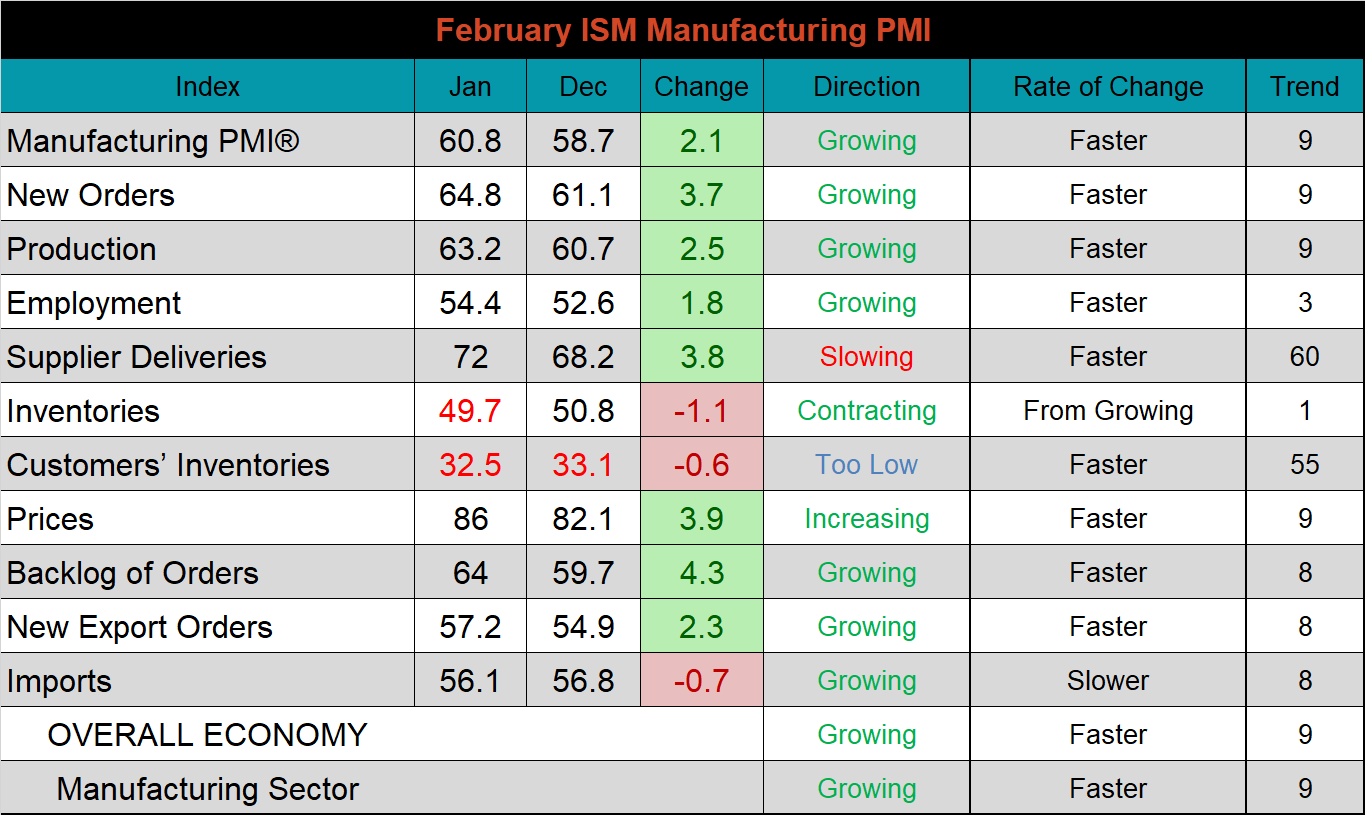
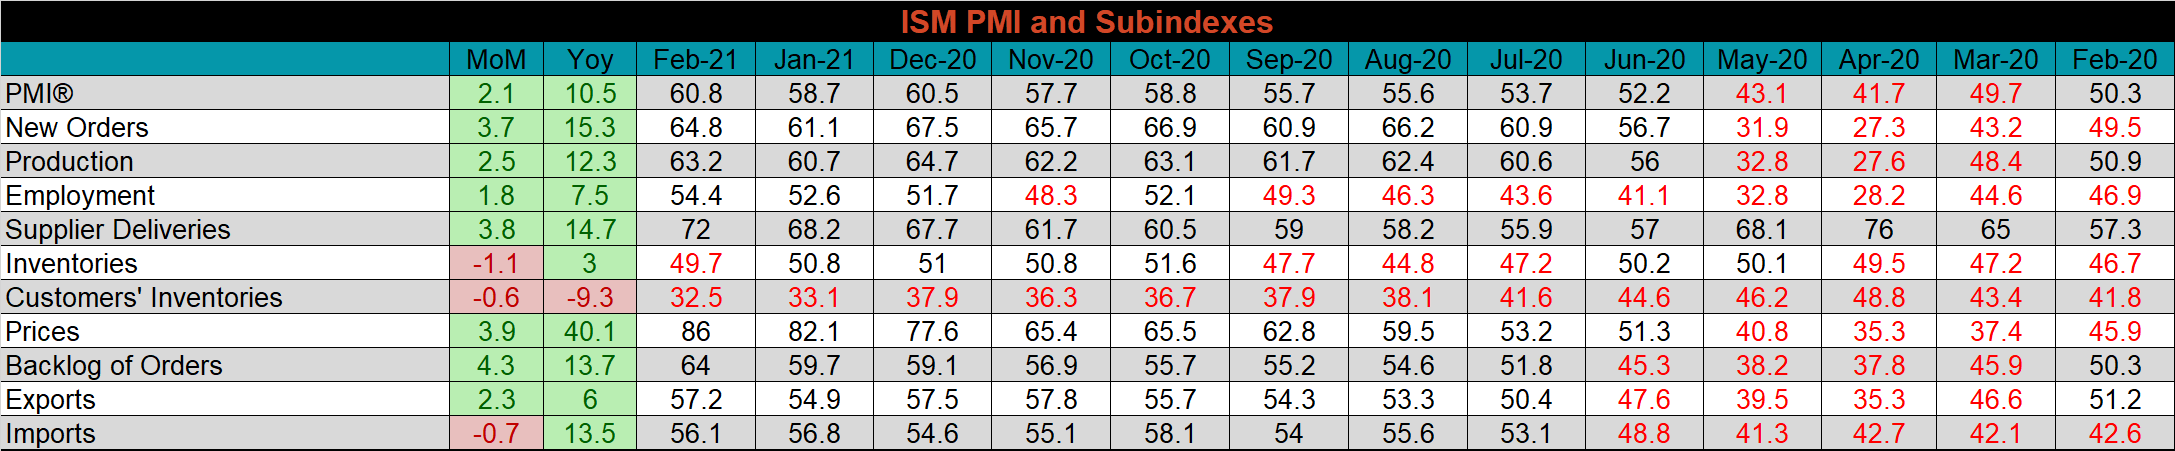
The February ISM Manufacturing PMI and subindexes are below. The topline PMI number was up 2.1 points to 60.8 remaining in expansion territory.
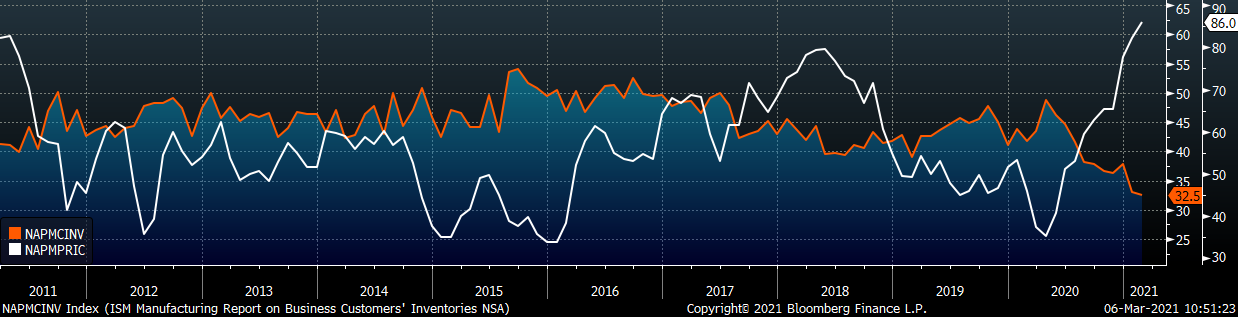
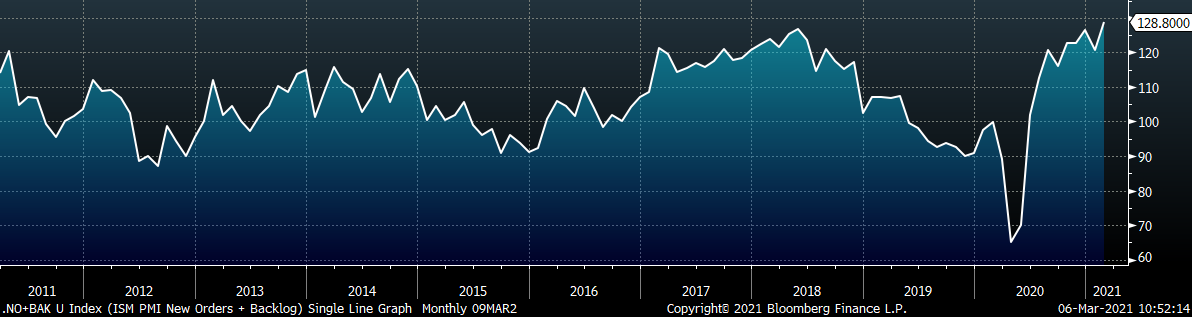
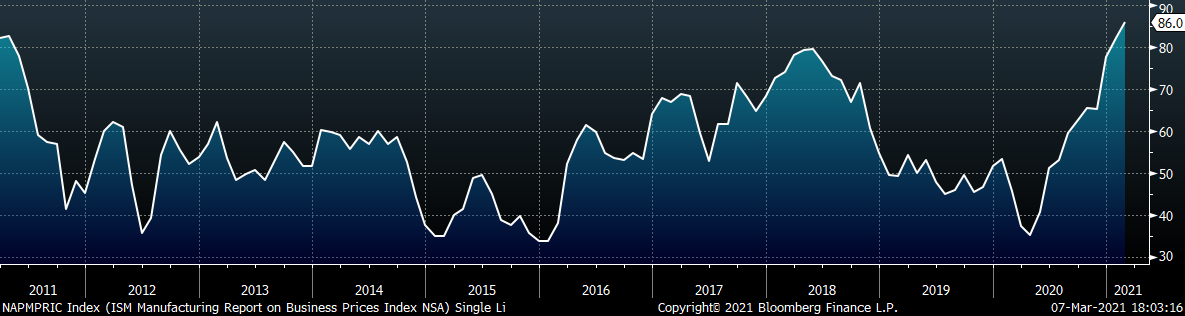
The chart below compares the ISM prices subindex with the ISM customer inventories subindex. The prices subindex was up 3.9 points, and is at the highest level in recent history, while the customers’ inventories subindex printed its lowest reading ever, tied with the low of 2009. The second chart shows the new orders plus backlog subindexes. New orders and backlogs both expanded at a faster rate in February, now at the highest level since 2004. The final chart shows the prices subindex increasing further, topping the peak in 2011, reflecting the inflationary preasures we are seeing throughout the commodity complex. The ISM PMI report continues to show strong demand, constrained supply and elevated prices across the manufacturing base.
ISM Manufacturing PMI Customer Inventories Subindex (orange) & Prices Subindex (white)
ISM Manufacturing PMI New Orders plus Backlog Subindexes
ISM Manufacturing Prices Subindex
PMI subindexes were mostly higher MoM and YoY. Imports and inventories declined MoM, and both inventory subindexes are the only two contracting.
Global PMI
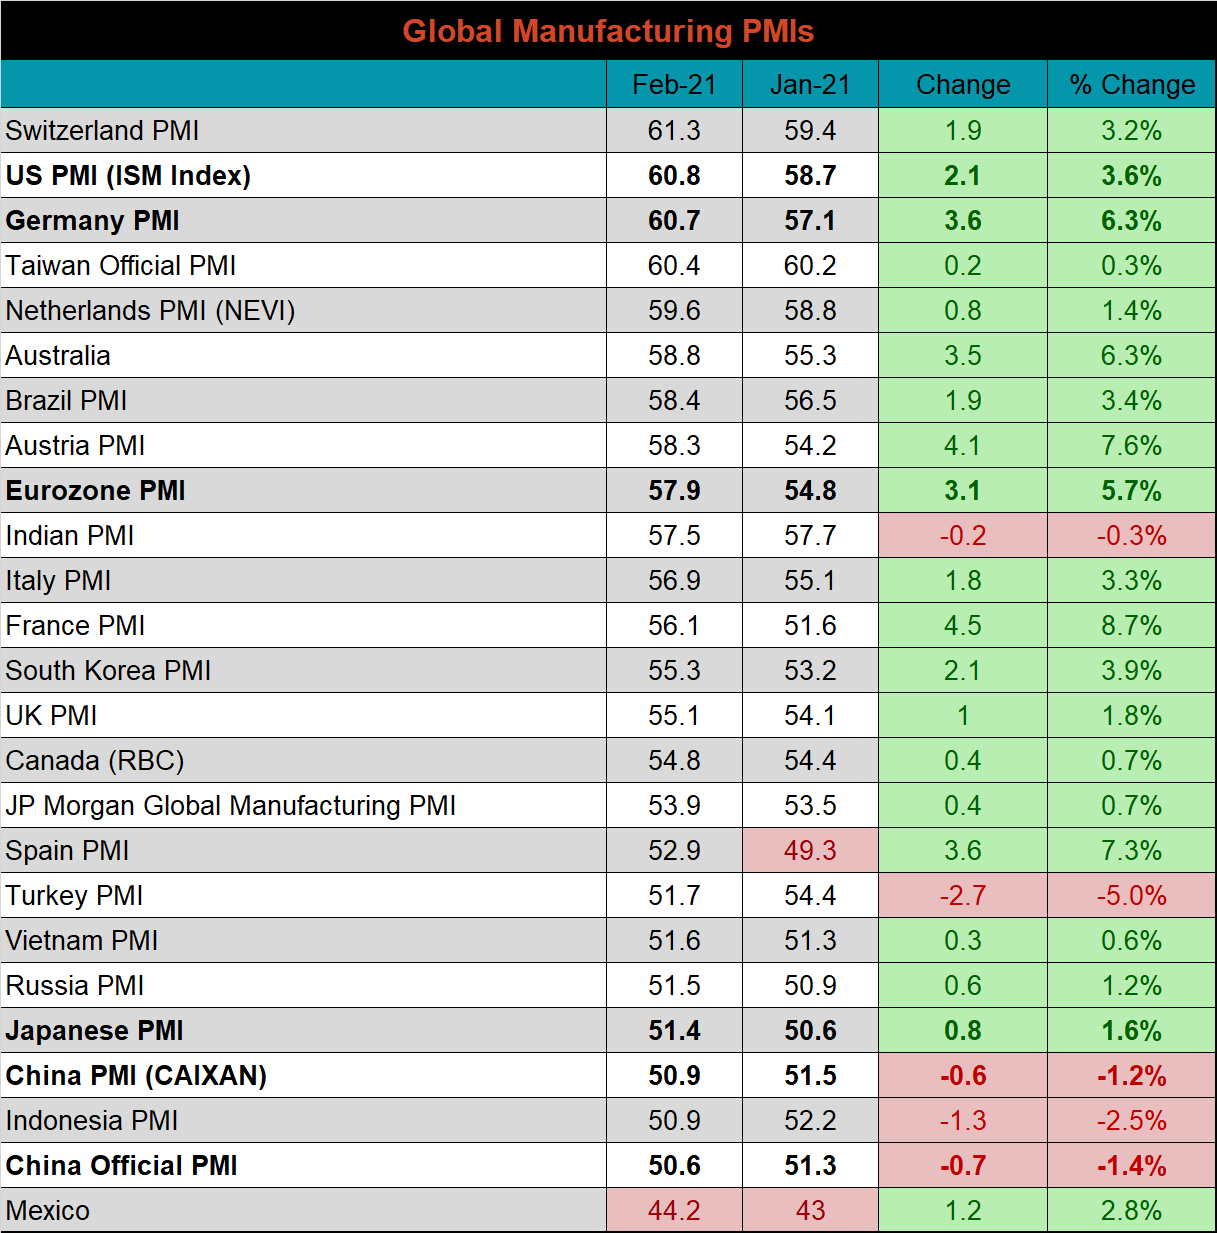
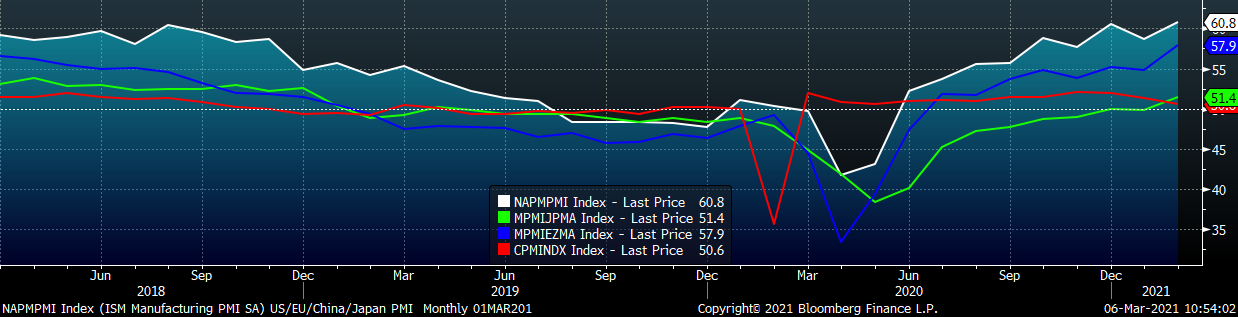
February global PMI printings remain strong, all but one of the watched countries in expansion (above 50) territory. The Japanese and two Chinese PMIs are expanding, but at a very low rate.
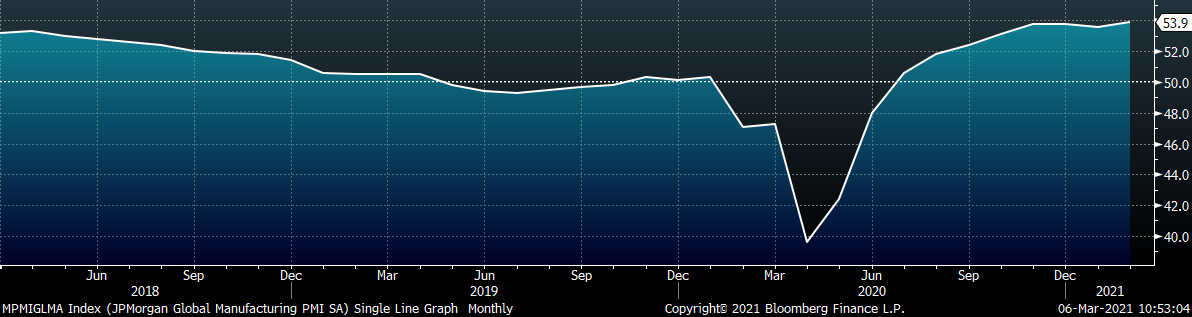
J.P. Morgan Global Manufacturing
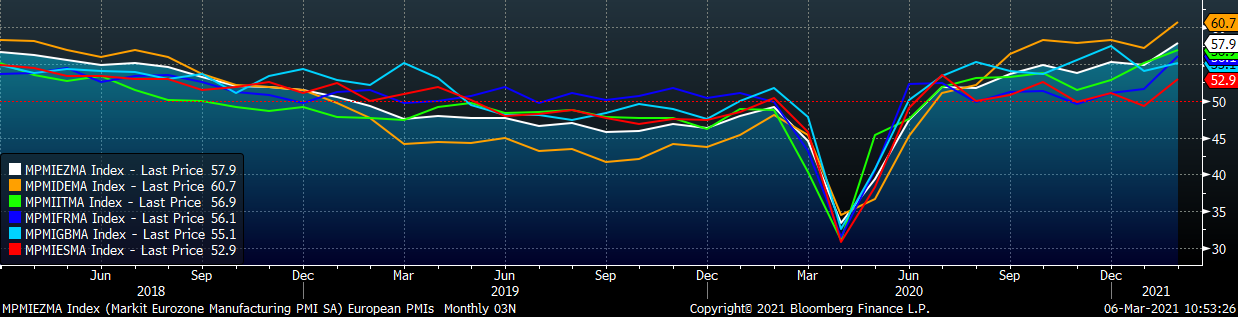
Eurozone (white), German (orange), Italian (green), Spanish (red), and French (blue), U.K. (teal) Manufacturing PMIs
US (white), Euro (blue), Chinese (red) and Japanese (green) Manufacturing PMIs
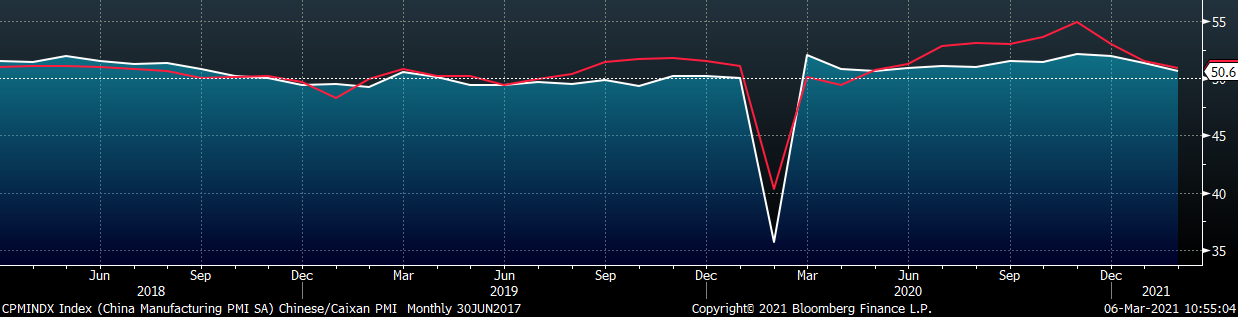
Both China’s official manufacturing PMI and the Caixan PMI decreased, and are barely in expansion.
China Official (white) and Caixan (red) Manufacturing PMIs
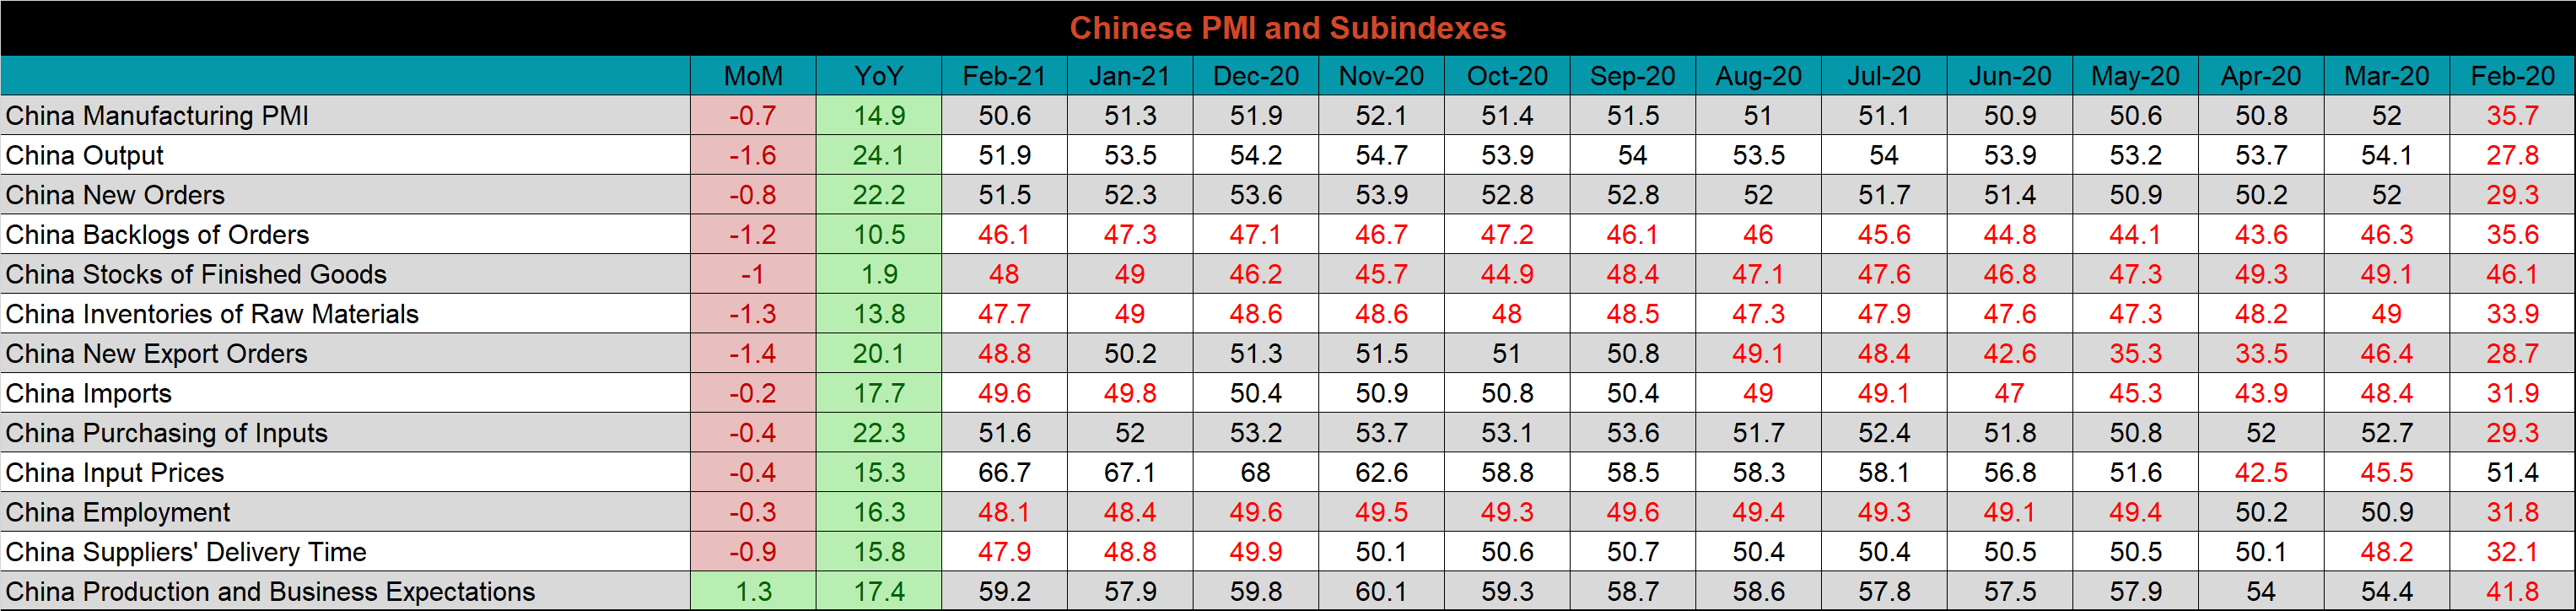
The table below breaks down China’s official manufacturing PMI subindexes, which was mostly lower MoM, but strong compared to pandemic driven low levels of February 2020. Export orders moving into contraction is troublesome for the export driven economy.
Construction Spending
January seasonally adjusted U.S. construction spending was up 1.7% compared to December, and 5.8% higher than a year ago.
January U.S. Construction Spending
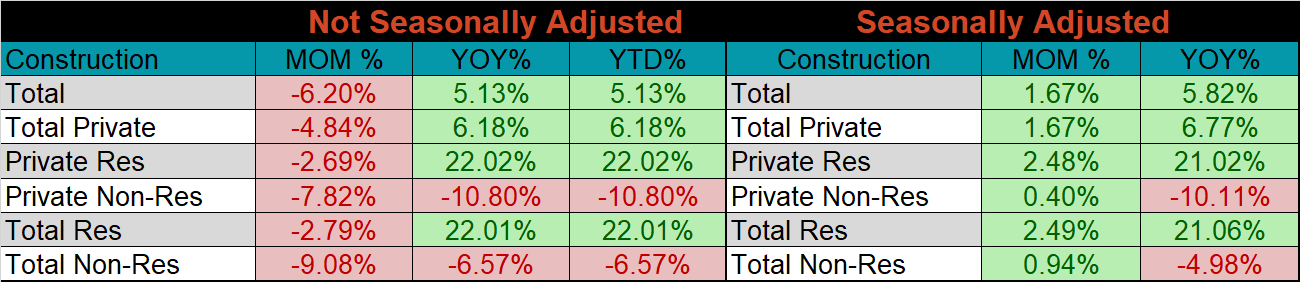
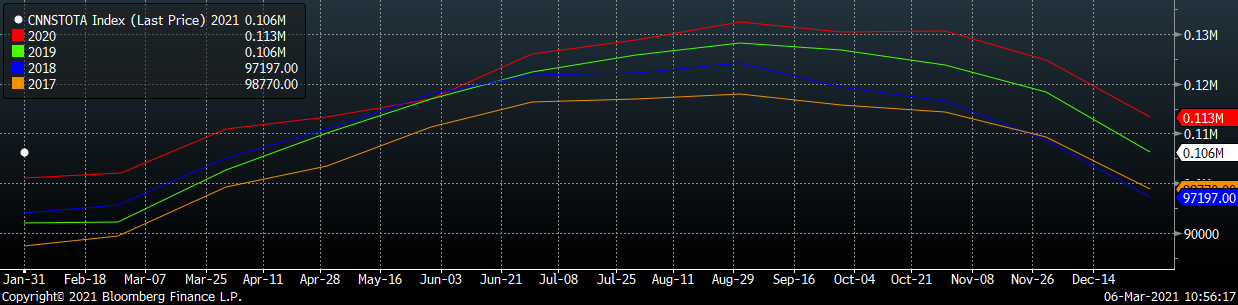
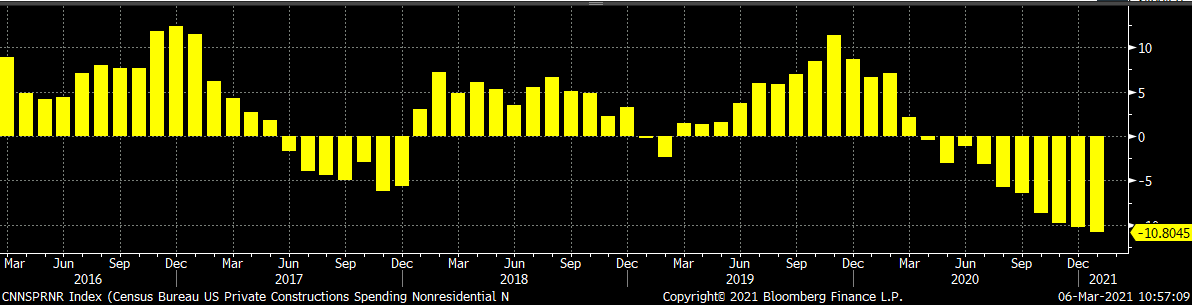
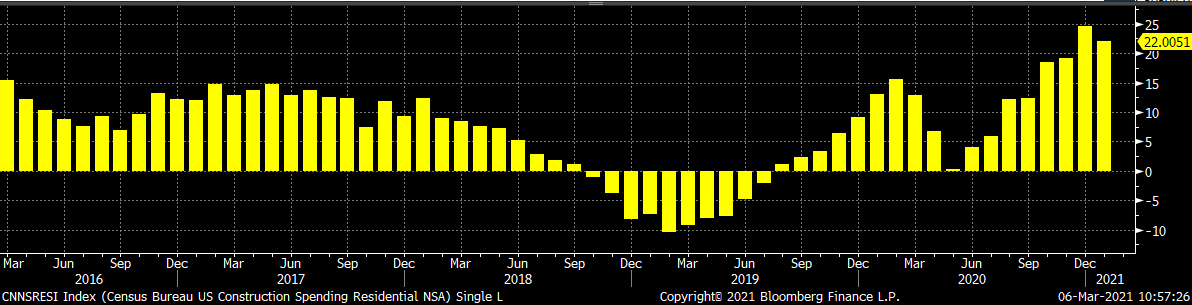
The white dot in the chart below represents not seasonally adjusted construction spending in January and compares it to the spending of the previous 4 years. Spending in January was elevated compared to prior years. The last two charts show the YoY changes in construction spending. Private non-residential spending decreased further in January, for the tenth month in a row, while residential spending remains elevated, but at a slightly lower growth rate compared to December.
U.S. Construction Spending
U.S. Private Nonresidential Construction Spending NSA YoY % Change
U.S. Residential Construction Spending NSA YoY % Change
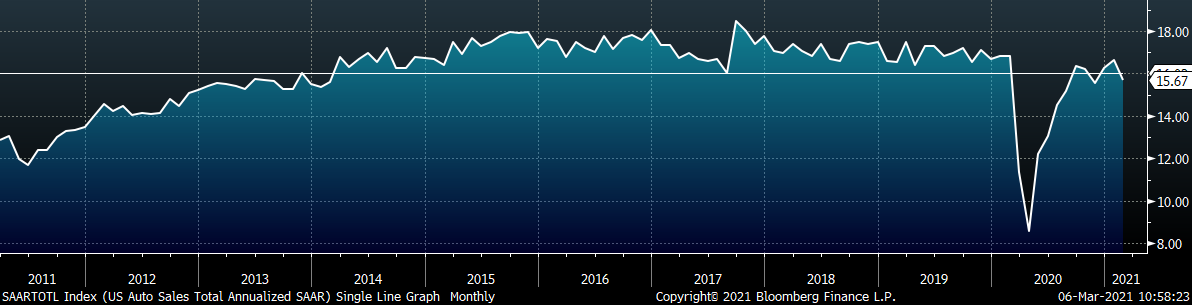
Auto Sales
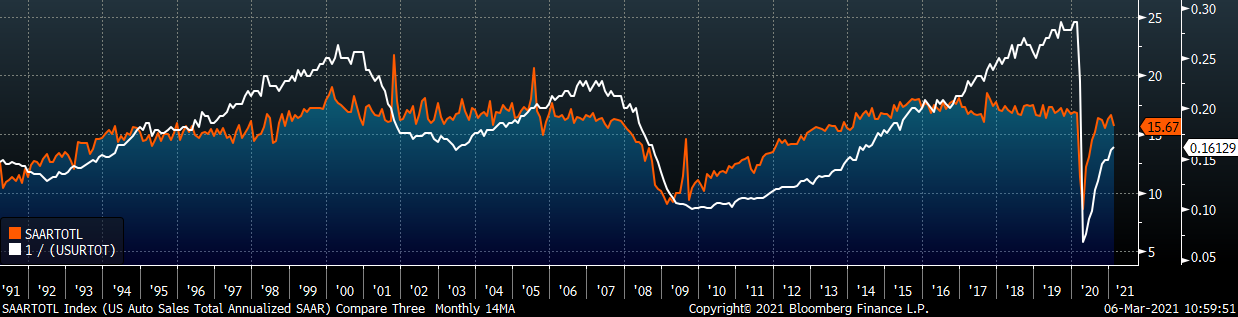
February U.S. light vehicle sales decreased to a 15.7m seasonally adjusted annualized rate (S.A.A.R). The second chart shows the relationship between the unemployment rate and auto sales. The unemployment rate is inverted to show that declining unemployment typically leads to increasing auto sales. The labor market continues to recover, while auto sales have stabilized near their 10 year average, possibly driven by low inventories at dealerships.
February U.S. Auto Sales (S.A.A.R.)
February U.S. Auto Sales (orange) and the Inverted Unemployment Rate (white)
Risks
Below are the most pertinent upside and downside price risks:
Upside Risks:
- Higher share of discretionary income allocated to goods from steel intensive industries
- Strengthening global flat rolled and raw material prices
- Unplanned & extended planned outages
- Low current import levels
- Declining/low inventory levels at end users and service centers
- Broad increases in commodity prices due to a weakening US Dollar
- Limited spot transactions skewing market indexes to extreme levels
Downside Risks:
- Increased domestic production capacity
- Increasing price differentials leading to higher imports
- Steel consumers substitute to lower cost alternatives
- Steel buyers and consumers “double ordering” to more than cover steel needs
- Weak labor and construction markets
- Tightening credit markets, as elevated prices push total costs to credit caps
- Reduction and/or removal of domestic trade barriers
- Supply chain disruptions allowing producers to catch up on orders
HRC Futures
All of the below data points are as of March 5, 2021
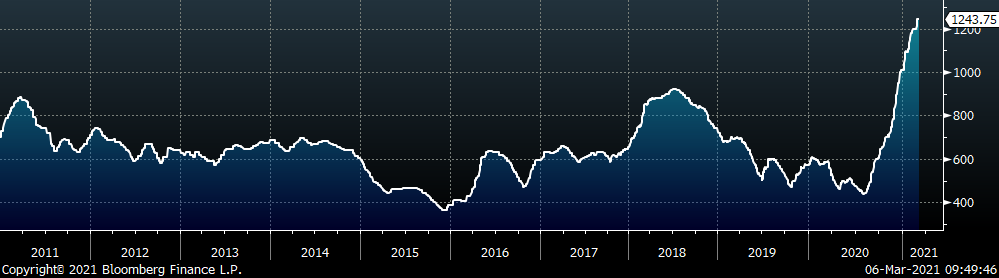
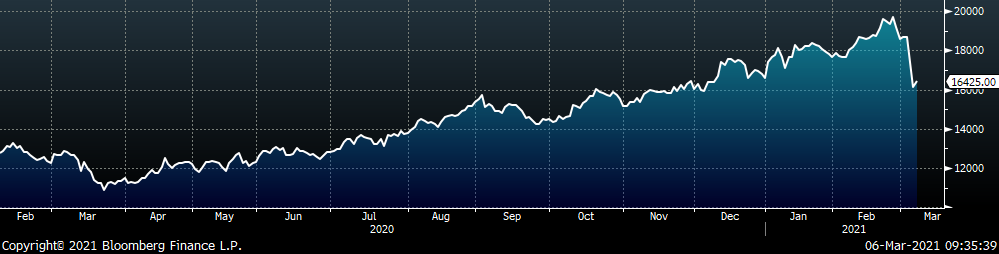
The Platts TSI Daily Midwest HRC Index increased by $32 to $1,243.75.
Platts TSI Daily Midwest HRC Index
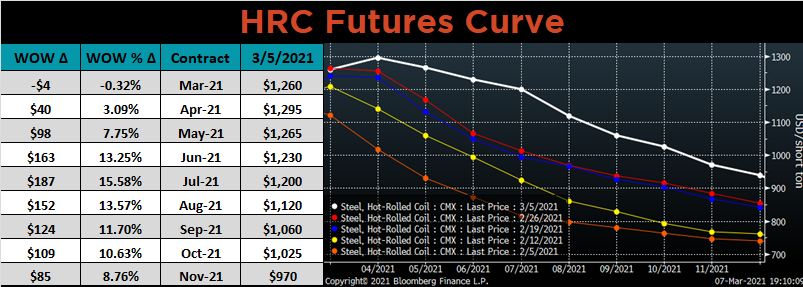
The CME Midwest HRC futures curve is below with last Friday’s settlements in white. Last week, the entire curve exploded higher, with July moving up $187 per ton! While the curve remains backwardated (upward sloping), it is the flattest structure since last fall, signaling that the market has finally priced in elevated prices for an extended period.
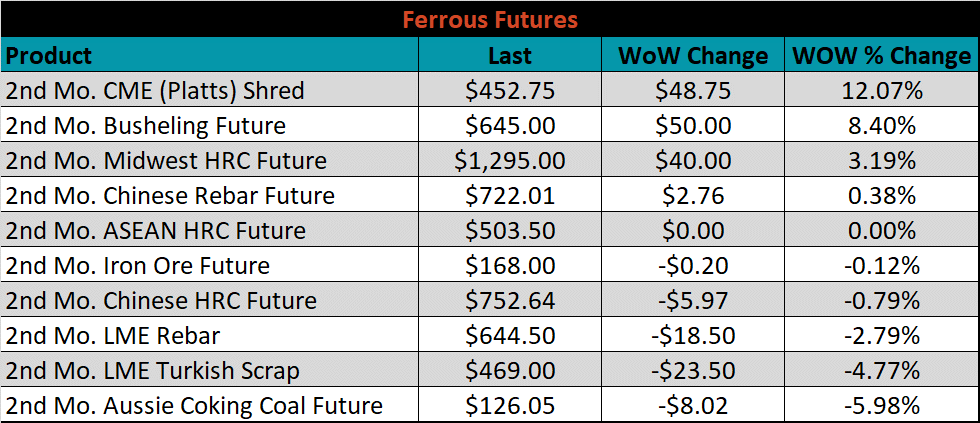
April ferrous futures were mixed. Busheling increased 8.4%, while Aussie coking coal lost another 6.0%.
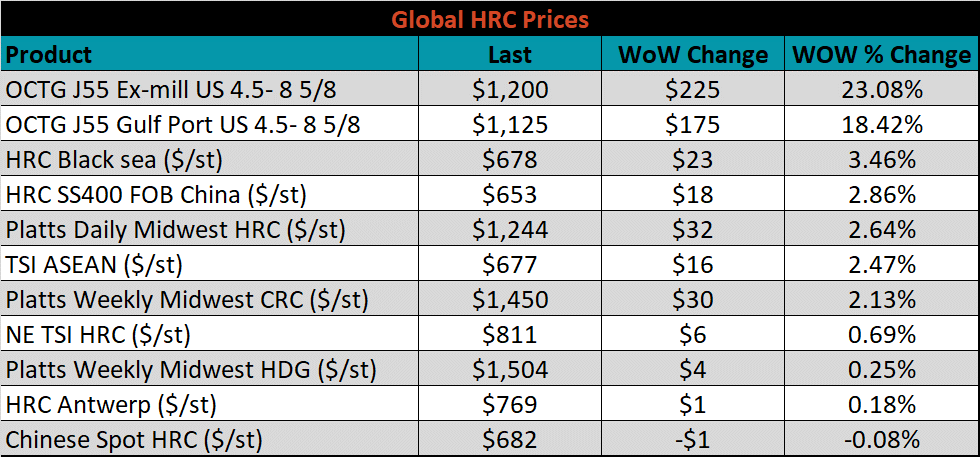
Global flat rolled indexes were almost all higher, led by OCTG prices, up approximately 20%, while Chinese HRC slid 0.1%.
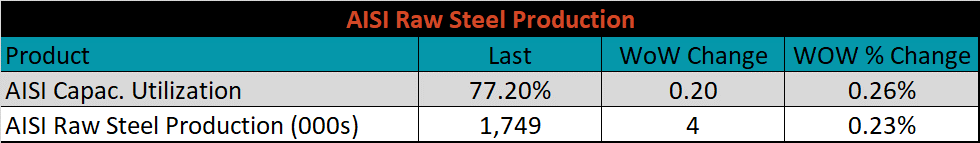
The AISI Capacity Utilization rate increased 0.2% to 77.2%.
AISI Steel Capacity Utilization Rate (orange) and TSI Daily HRC Price (white)
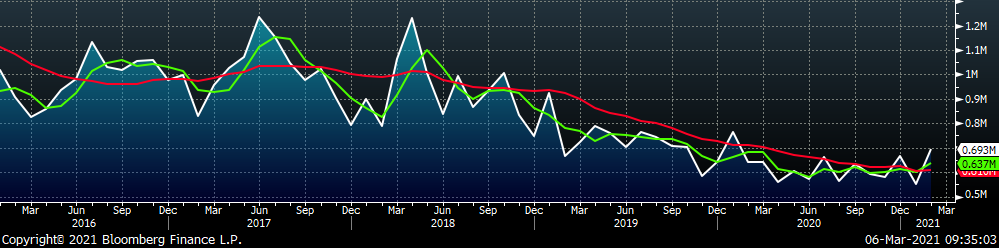
Imports & Differentials
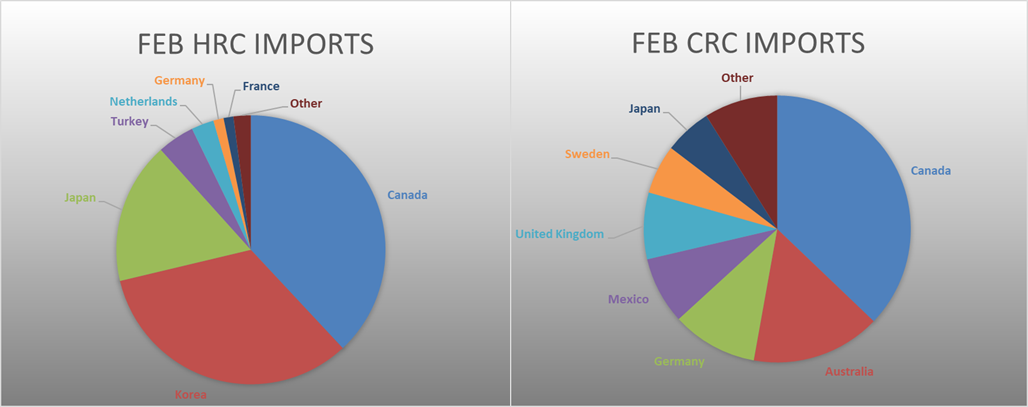
February flat rolled import license data is forecasting an increase of 142k to 693k MoM.
All Sheet Imports (white) w/ 3-Mo. (green) & 12-Mo. Moving Average (red)
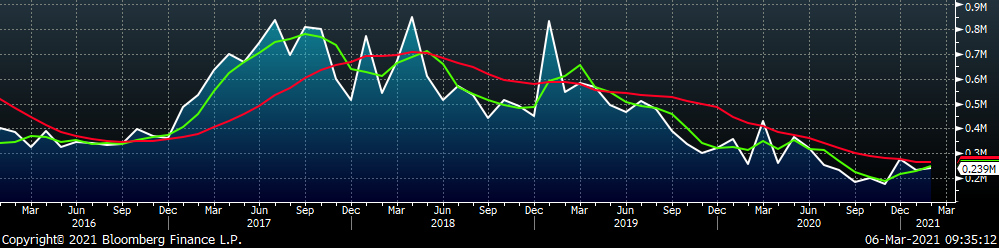
Tube imports license data is forecasting an increase of 7k to 239k in February.
All Tube Imports (white) w/ 3-Mo. (green) & 12-Mo. Moving Average (red)
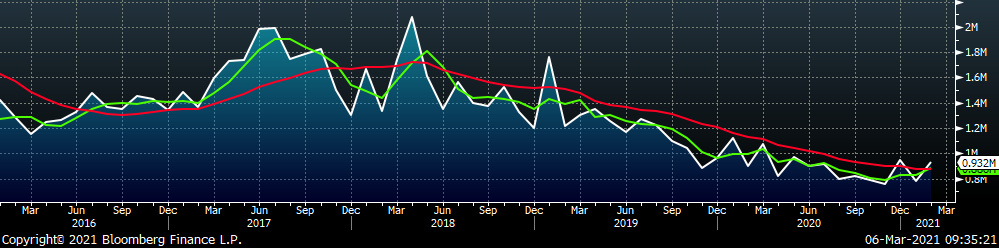
All Sheet plus Tube (white) w/ 3-Mo. (green) & 12-Mo. Moving Average (red)
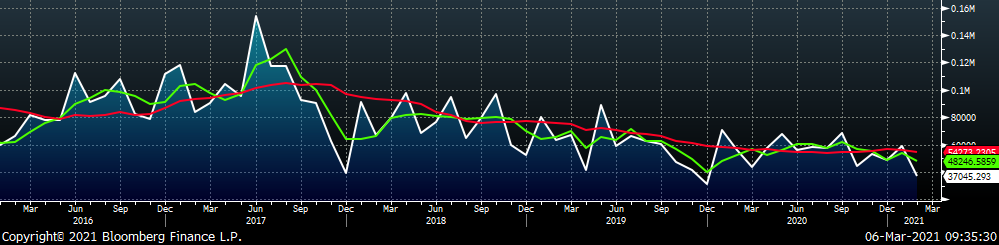
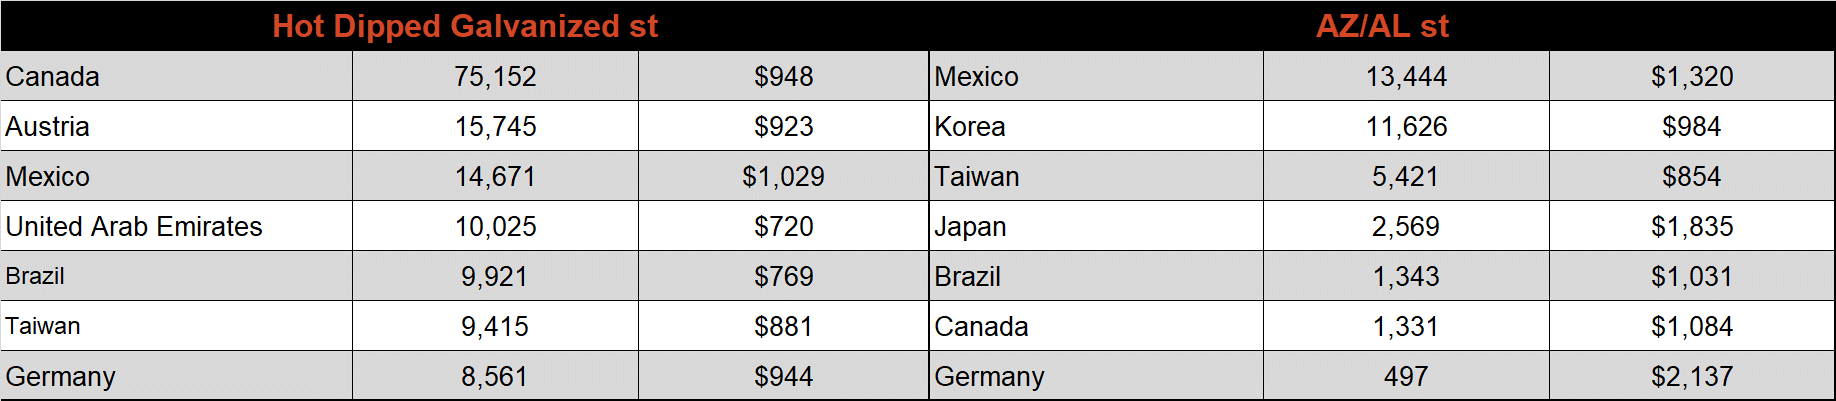
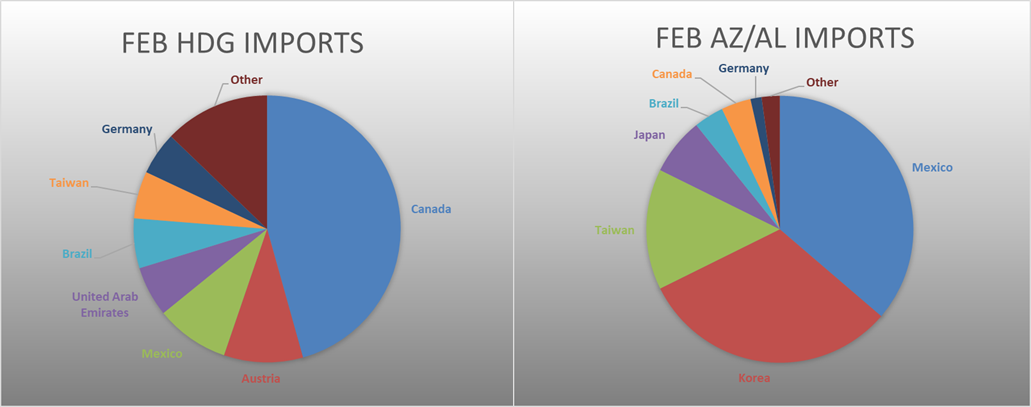
February AZ/AL import license data is forecasting a decrease of 22k to 37k.
Galvalume Imports (white) w/ 3 Mo. (green) & 12 Mo. Moving Average (red)
Below is February import license data through March 2, 2021.
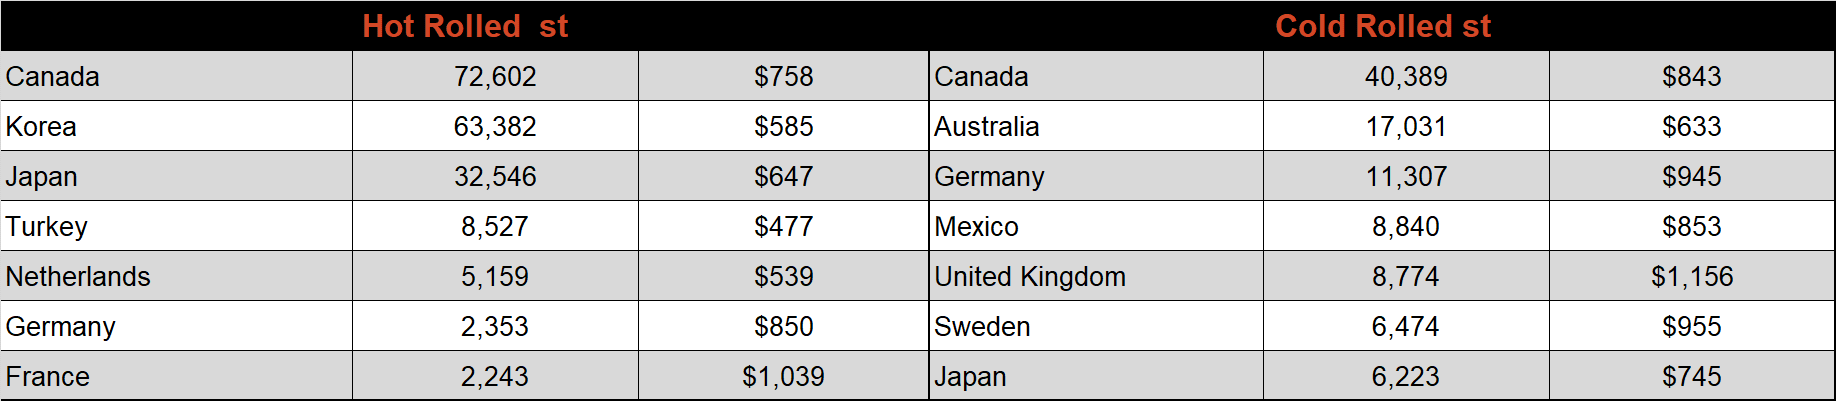
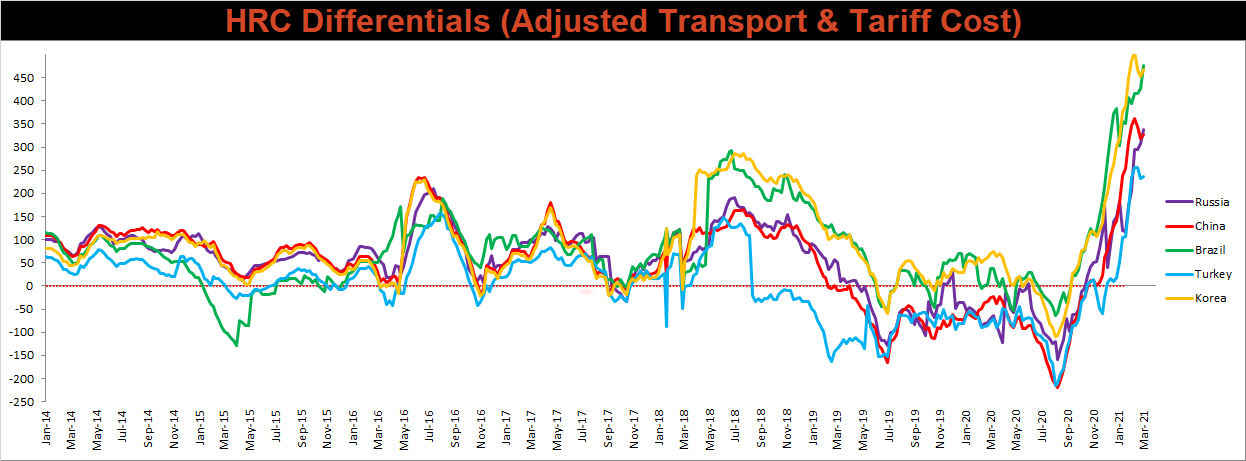
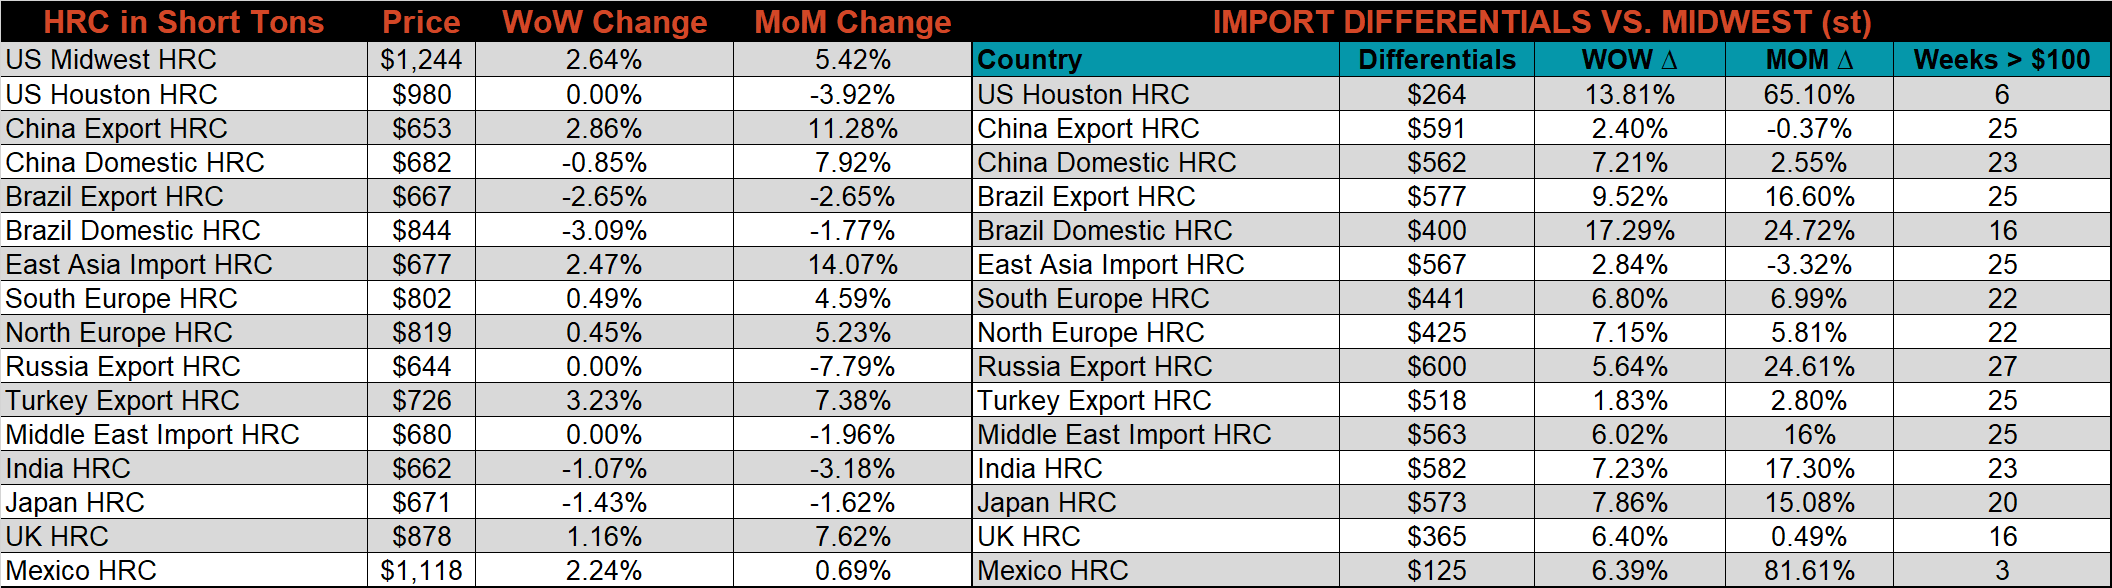
Below is the Midwest HRC price vs. each listed country’s export price using pricing from SBB Platts. We have adjusted each export price to include any tariff or transportation cost to get a comparable delivered price. All differentials increased this week with the large gains in the Midwest HRC price.
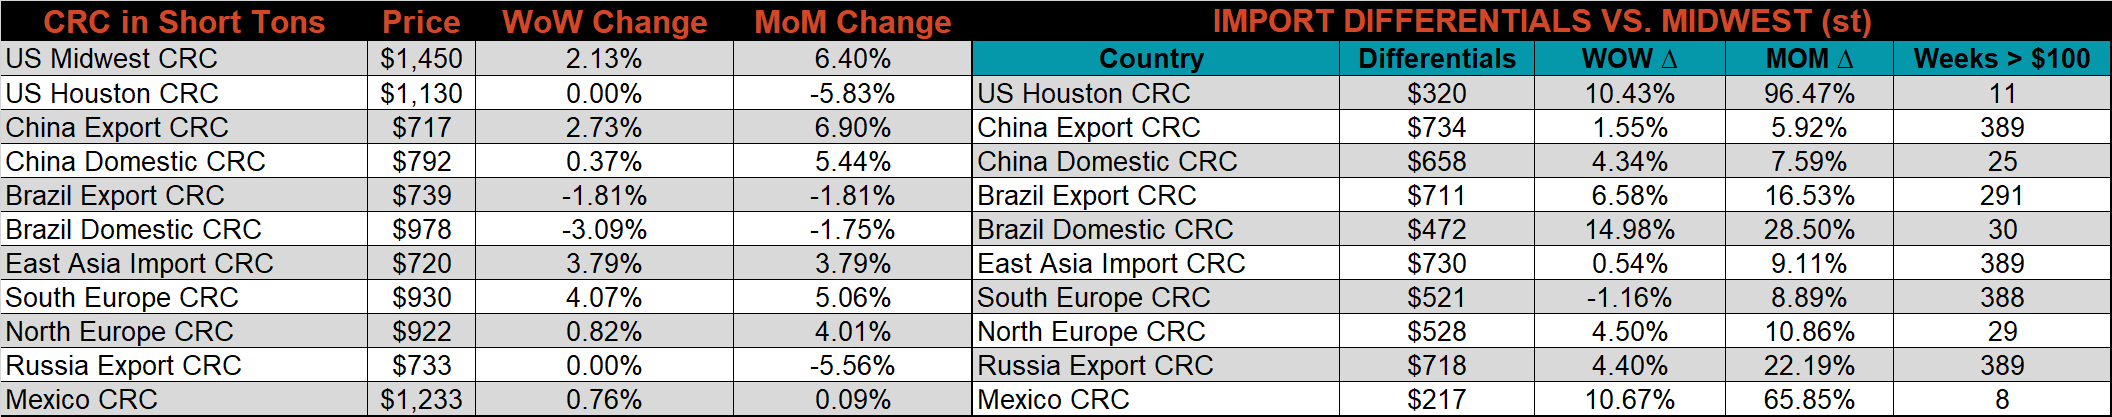
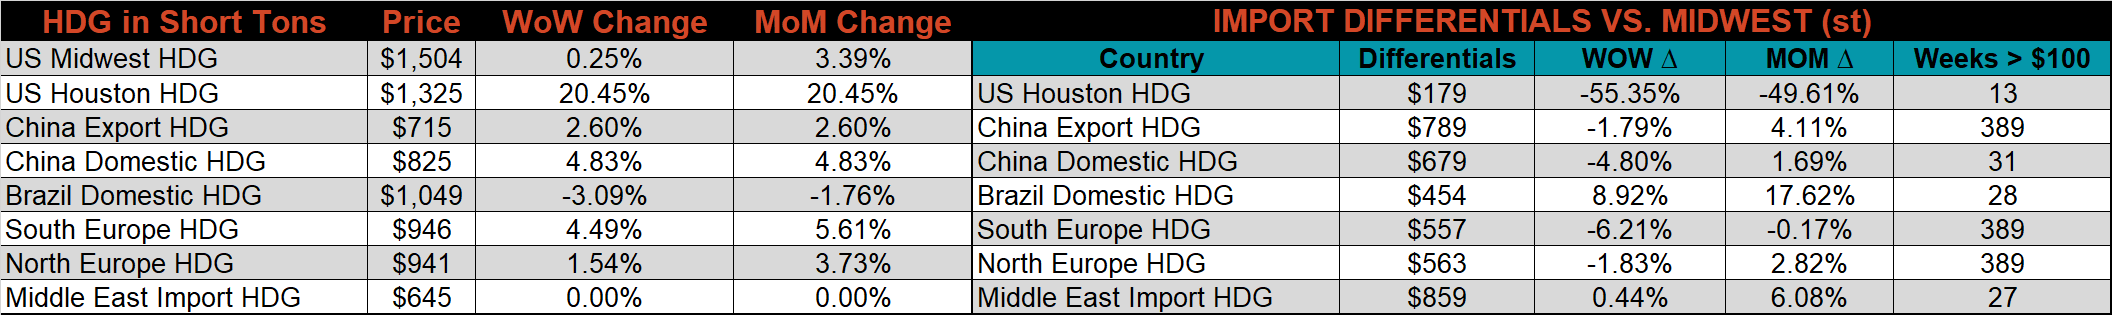
SBB Platt’s HRC, CRC and HDG pricing is below. The Midwest HRC, CRC & HDG prices were up 2.6%, 2.1% and 0.3%, respectively. Globally, the Chinese HRC export price was up 2.9%.
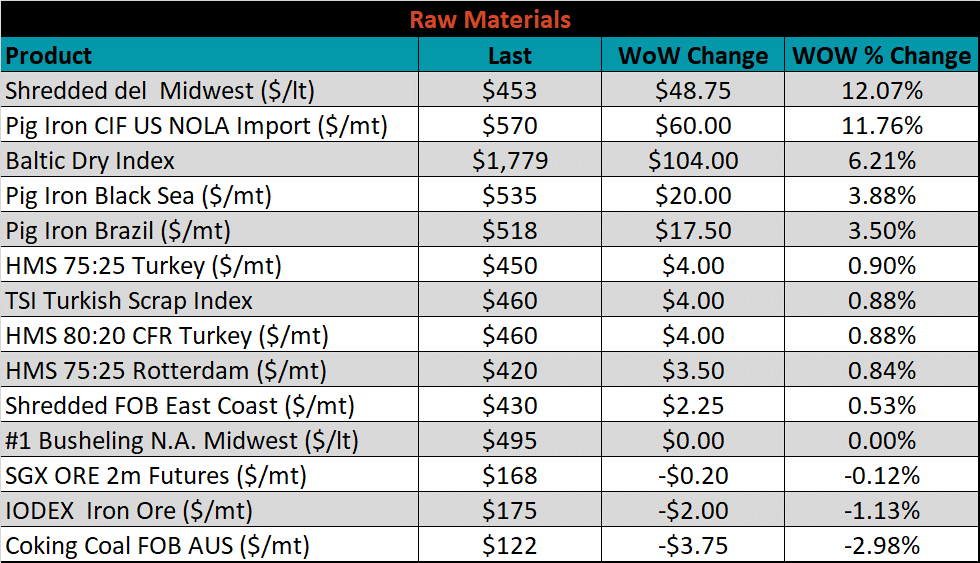
Raw Materials
Raw material prices were mixed, with Midwest shredded scrap up 12.1%, while Aussie coking coal was down another 3.0%.
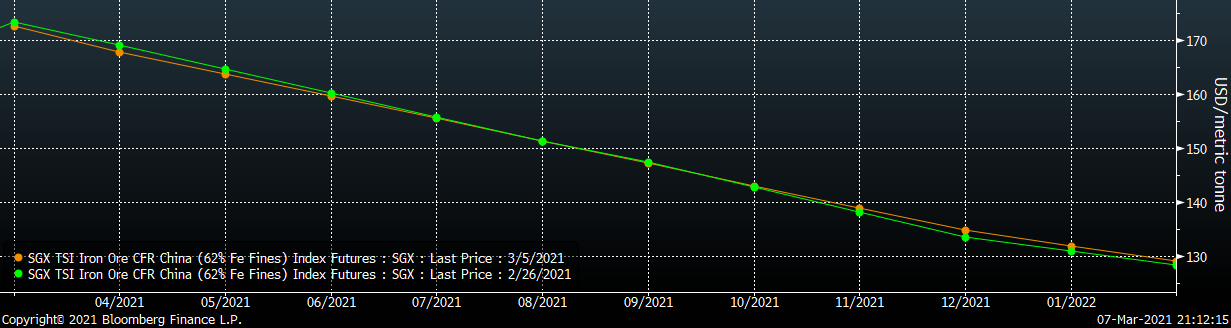
Below is the iron ore future curve with Friday’s settlements in orange, and the prior week’s settlements in green. Last week the curve flattened, with the front sliding and the back increased.
SGX Iron Ore Futures Curve
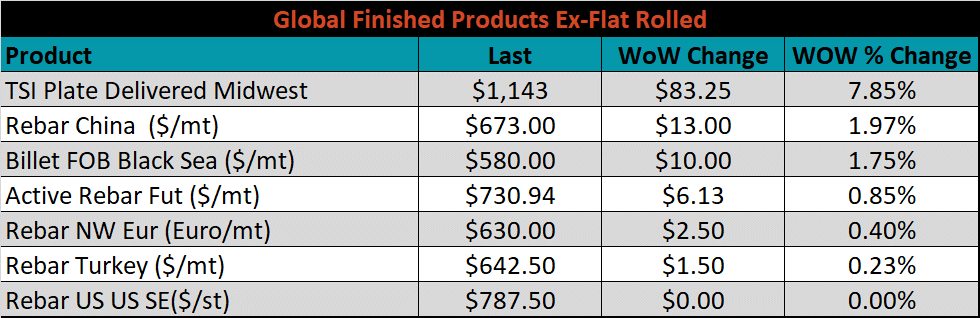
The ex-flat rolled prices are listed below.

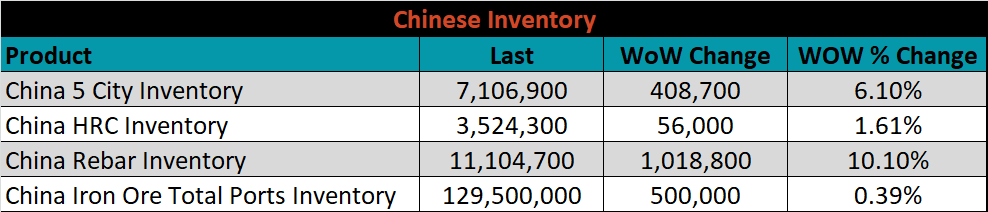
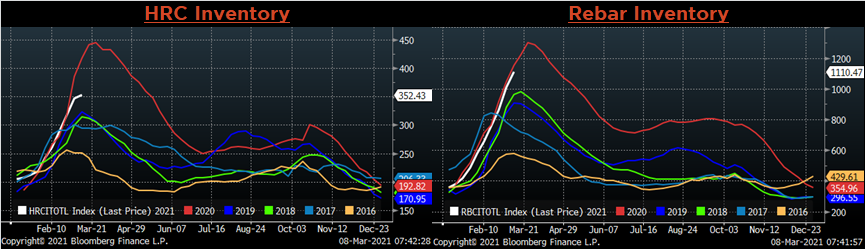
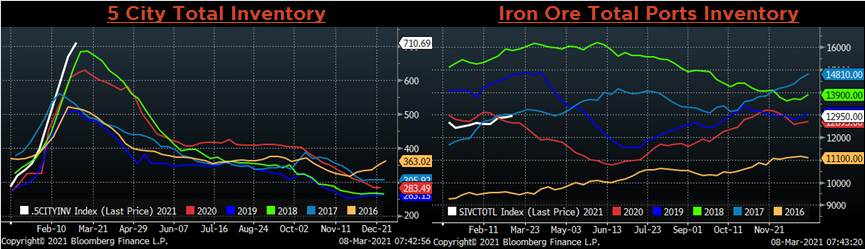
Chinese Inventory
Below are inventory levels for Chinese finished steel products and iron ore. Inventory levels were up across the board, led by Rebar, up 10.1%, approaching last year’s peak. With inventory levels nearing pandemic driven elevated levels of last year, it will be difficult to also match the spring inventory draw, as credit conditions are much tighter this year.
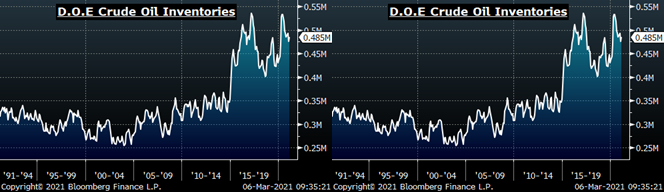
Energy
Last week, the April WTI crude oil future gained $4.60 or 7.5% to $66.09/bbl. The aggregate inventory level was down another 0.2% and crude oil production increased to 10.0m bbl/day. The Baker Hughes North American rig count was down 21 rigs, while the U.S. rig count was up 1 rig.
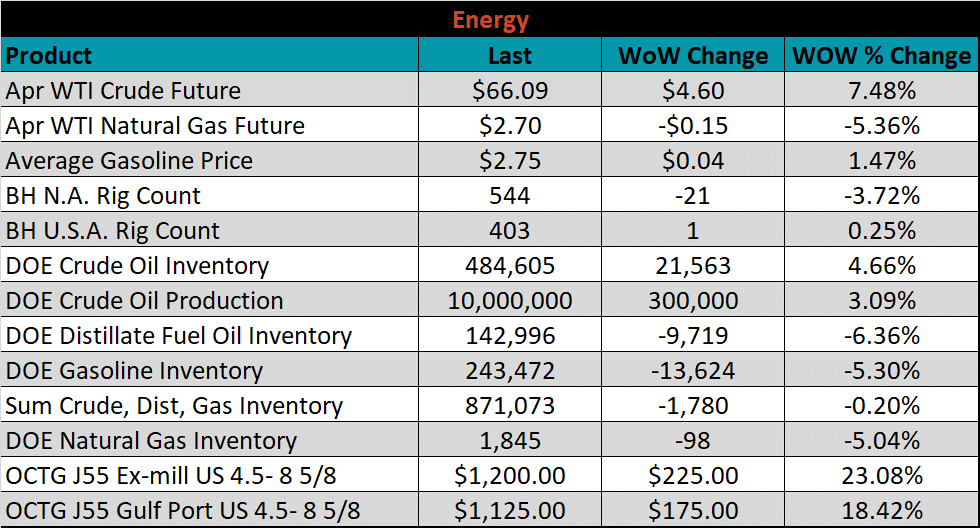
April WTI Crude Oil Futures (orange) vs. Aggregate Energy Inventory (white)
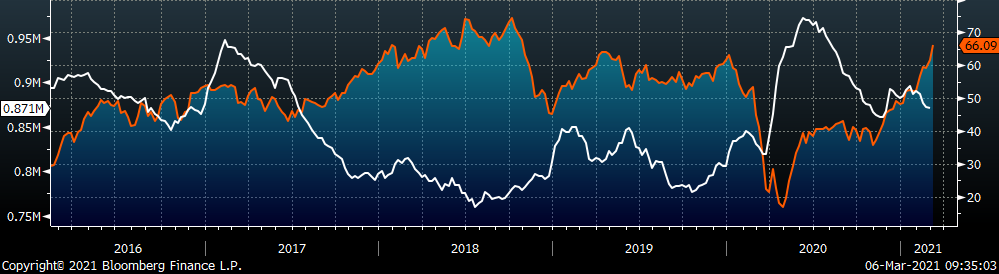
Front Month WTI Crude Oil Future (orange) and Baker Hughes N.A. Rig Count (white)
The list below details some upside and downside risks relevant to the steel industry. The orange ones are occurring or look to be highly likely. The upside risks look to be in control.
Upside Risks:
- Higher share of discretionary income allocated to goods from steel intensive industries
- Changes in China’s policies regarding ferrous markets, including production cuts and imports
- Strengthening global flat rolled and raw material prices
- Unplanned & extended planned outages, including operational issues leaving mills behind
- Declining/low inventory levels at end users and service centers
- Broad increases in commodity prices due to a weakening US Dollar
- Limited spot transactions skewing market indexes to extreme levels
- Chinese economic stimulus measures
- Fiscal policy measures including a new stimulus and/or infrastructure package
- Low interest rates
- China strict steel capacity cuts
- Energy industry rebound
- Unexpected inflation
- Further section 232 tariffs and quotas restricting supply
Downside Risks:
- Increased domestic production capacity
- Increasing price differentials leading to higher imports
- Steel consumers substitute to lower cost alternatives
- Steel buyers and consumers “double ordering” to more than cover steel needs
- Weak labor and construction markets
- Tightening credit markets, as elevated prices push total costs to credit caps
- Reduction and/or removal of domestic trade barriers
- Supply chain disruptions allowing producers to catch up on orders
- Political & geopolitical uncertainty
- Weak global economics/PMIs
- Trade slowdown in China due to tensions with US, Hong Kong, and others
- Domestic automotive industry under pressure
- Chinese restrictions in property market
- The Chinese Financial Crisis
- Unexpected sharp China RMB devaluation