Content
-
Weekly Highlights
- Market Commentary
- ISM PMI
- Global PMI
- Construction Spending
- Auto Sales
- Risks


Two weeks ago, mills increased prices by $40, and in normal times, we would know by now what spot prices the market would accept. However, now there is arguably more uncertainty as to price outlook. Mills have maintained their offers at $600 and have no reason to negotiate lower yet as they maintain strong order books for the next few months. However, buyers are sticking to their strategy of only buying material on their contracts at discounted levels to the spot index. With the mounting uncertainty around the coronavirus and its effects on the economy, there is no reason for buyers to take a risk through purchasing or holding inventory. Over the last week, some risks to the economy have exhibited themselves in asset prices and economic data, causing many to predict an economic downturn or recession. This week we will dive into some of them.
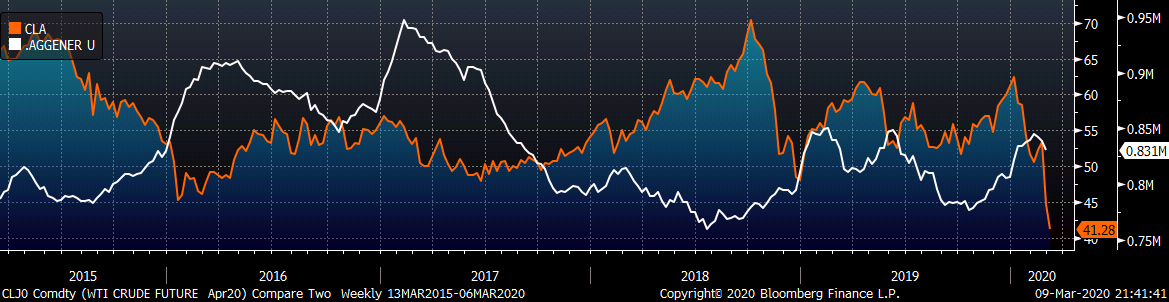
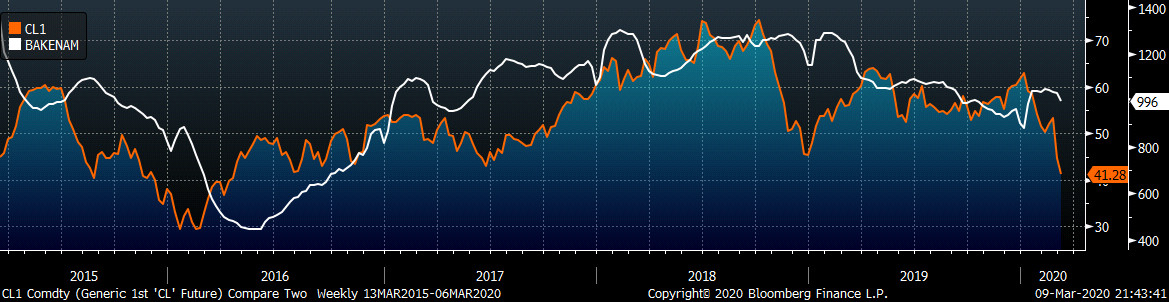
Oil prices were down almost 8% last week after OPEC and Russia failed to agree to a supply cut, and fell even more at the beginning of this week as Saudi Arabia increased production and cut prices. The price of crude oil can be viewed as a barometer of global demand, and the price plummeting is concerning. From the perspective of the steel market, energy is a significant component of the domestic steel demand. Many energy companies will struggle to generate enough cash flow to meet debt obligations with oil prices at current levels, which will create holes in mills order books as these companies pull back production or leave the market completely. The chart below shows the weekly correlation between oil prices and the 3rd month HRC future price going back 7 years.
Oil prices collapsed in 2015 ahead of a manufacturing slowdown. Interestingly during this time, the correlation between oil and HRC futures increased, meaning that steel futures also declined. In periods where oil prices are declining, this correlation increases. Looking at the current spot market for both HRC and oil, this points to downside in the steel market.
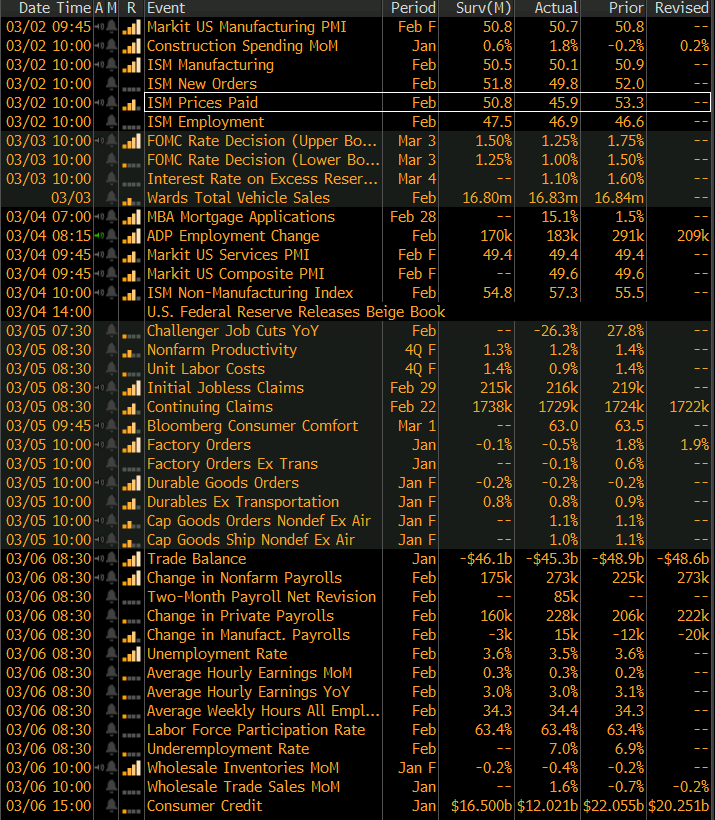
Often during times of significant market volatility, asset prices diverge from underlying fundamentals. This creates opportunities for traders or hedgers, but confusion for others trying to develop long-term projections for their business. Last week, several economic data reports were released, and while backward looking, can give some insight into areas of strength or weakness in the economy. An area of strength was the construction spending report, which showed seasonably strong construction spending. While residential spending was a large driver of this strength, there were also positive revisions and growth in the steel intensive private, non-residential construction spending data. However, we also received domestic and global PMI reports, which showed lackluster sentiment in the manufacturing sector. This index tends to be a good gauge of demand in the steel sector, and is correlated to HRC prices at times. Further weakness in PMI readings should direct caution among buyers.
For buyers not ready to pay the elevated spot prices, and are worried about the economic outlook, we recommend planning and determining a price that you would feel comfortable buying. In a high volatility environment, the forward curve may give you that opportunity sooner than you think.
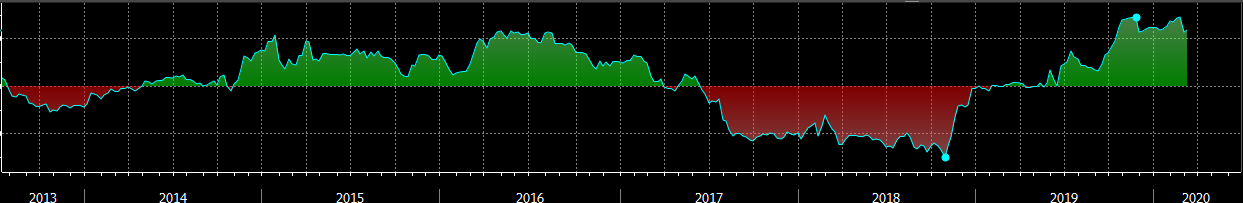
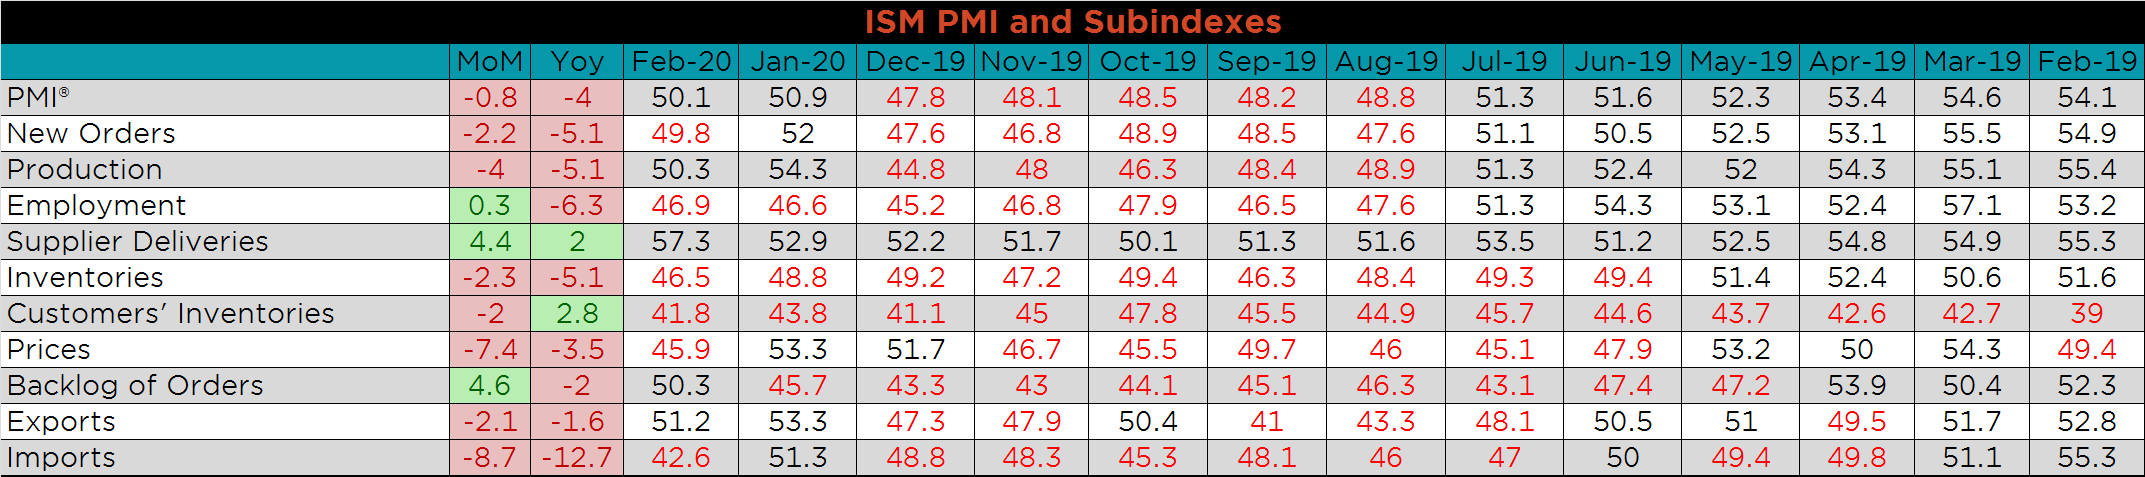
The February ISM Manufacturing PMI and subindexes are below. The topline PMI number was down 0.8 points and remains in expansion.
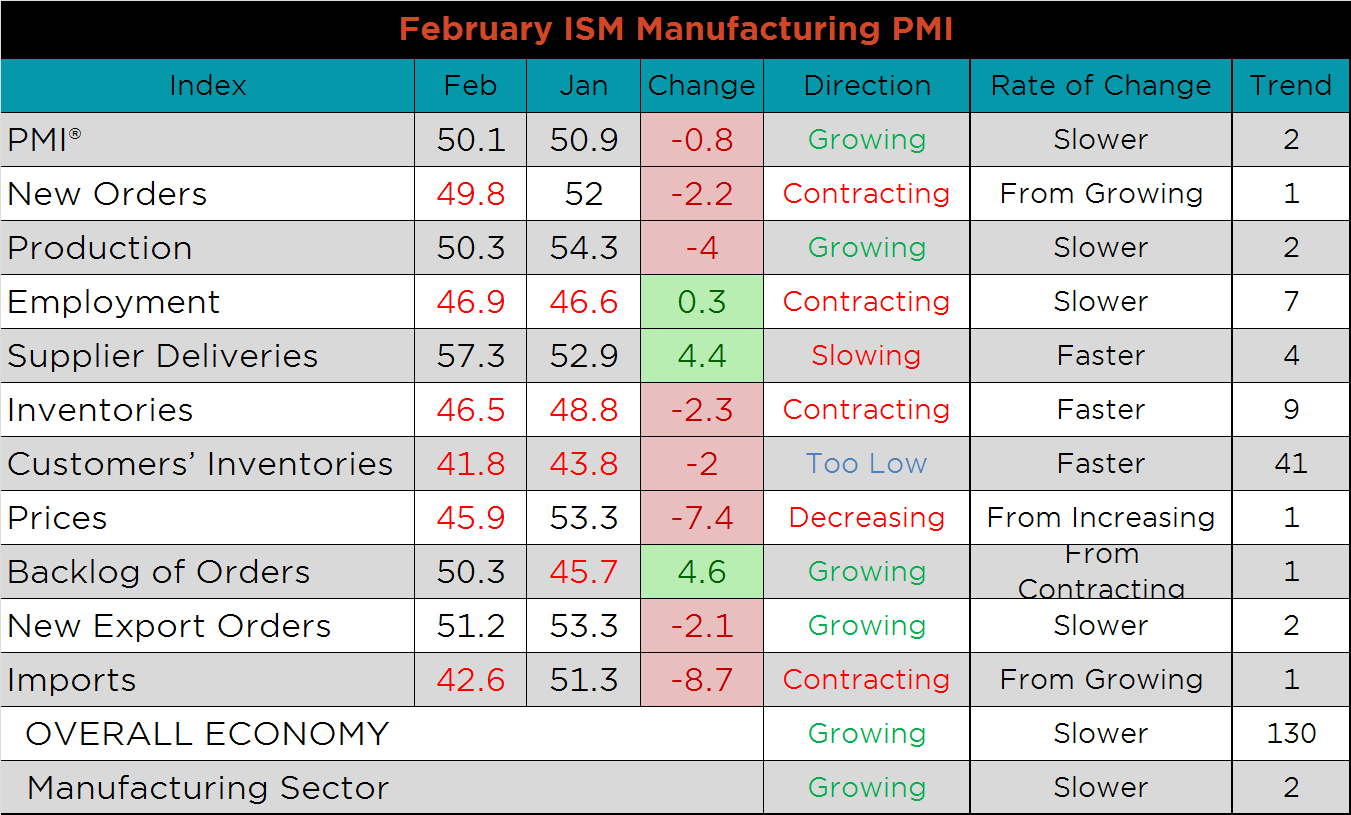
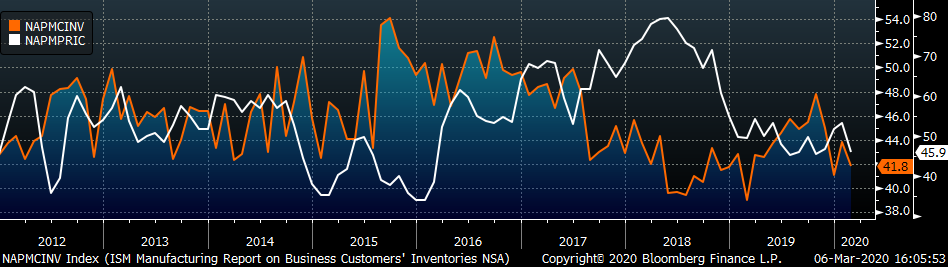
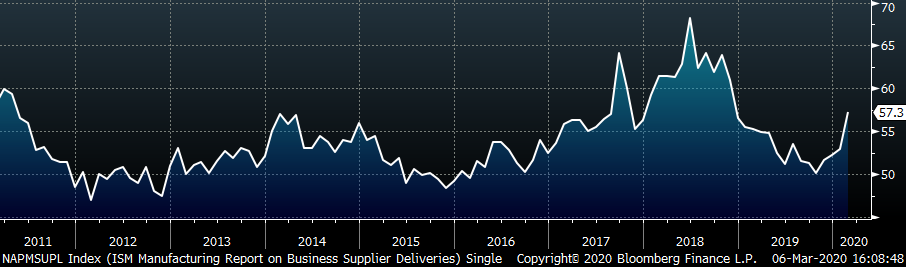
The chart below compares the ISM prices subindex with the ISM customer inventories subindex, which both decreased this month, signaling the uncertainty around the coronavirus. Commodity prices have declined and holding inventory appears risky for manufacturers. The second chart adds the new orders and backlog subindexes together, giving an indication of demand within the manufacturing sector. Weakness in new orders was more than offset by increasing backlog, but the backlog index is barely in expansionary territory. The last chart shows the supplier deliveries subindex, which moved significantly higher. Strength in this index usually indicates high demand levels from increasing activity. However, in this case the expansion is due to supply chain disruption from declining trade from China, which is falsely elevating the headline number.
Most of the subindexes were lower MoM, led by imports, prices and inventories, down 8.7, 7.4 and 2.3 points respectively.
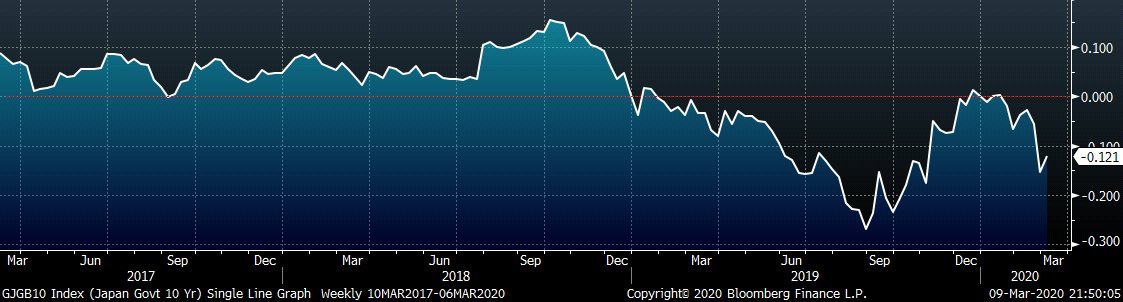
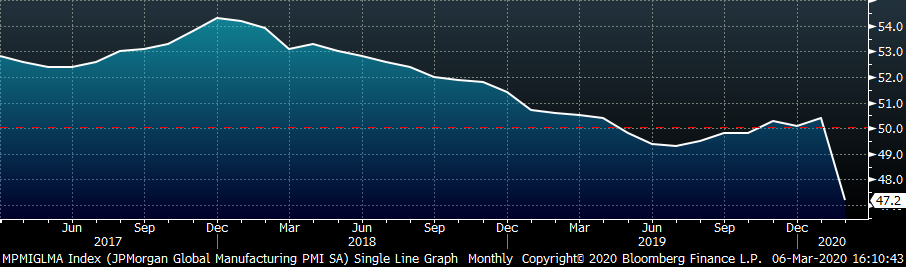
February’s global PMI printings show mixed results compared to last month, 14 of the 24 countries remain in contraction. The major (bolded) global manufacturing countries, with the exception of the U.S., are all in contraction with China moving lower significantly. Germany and the Eurozone PMIs both increased, while Japan fell further into contraction.
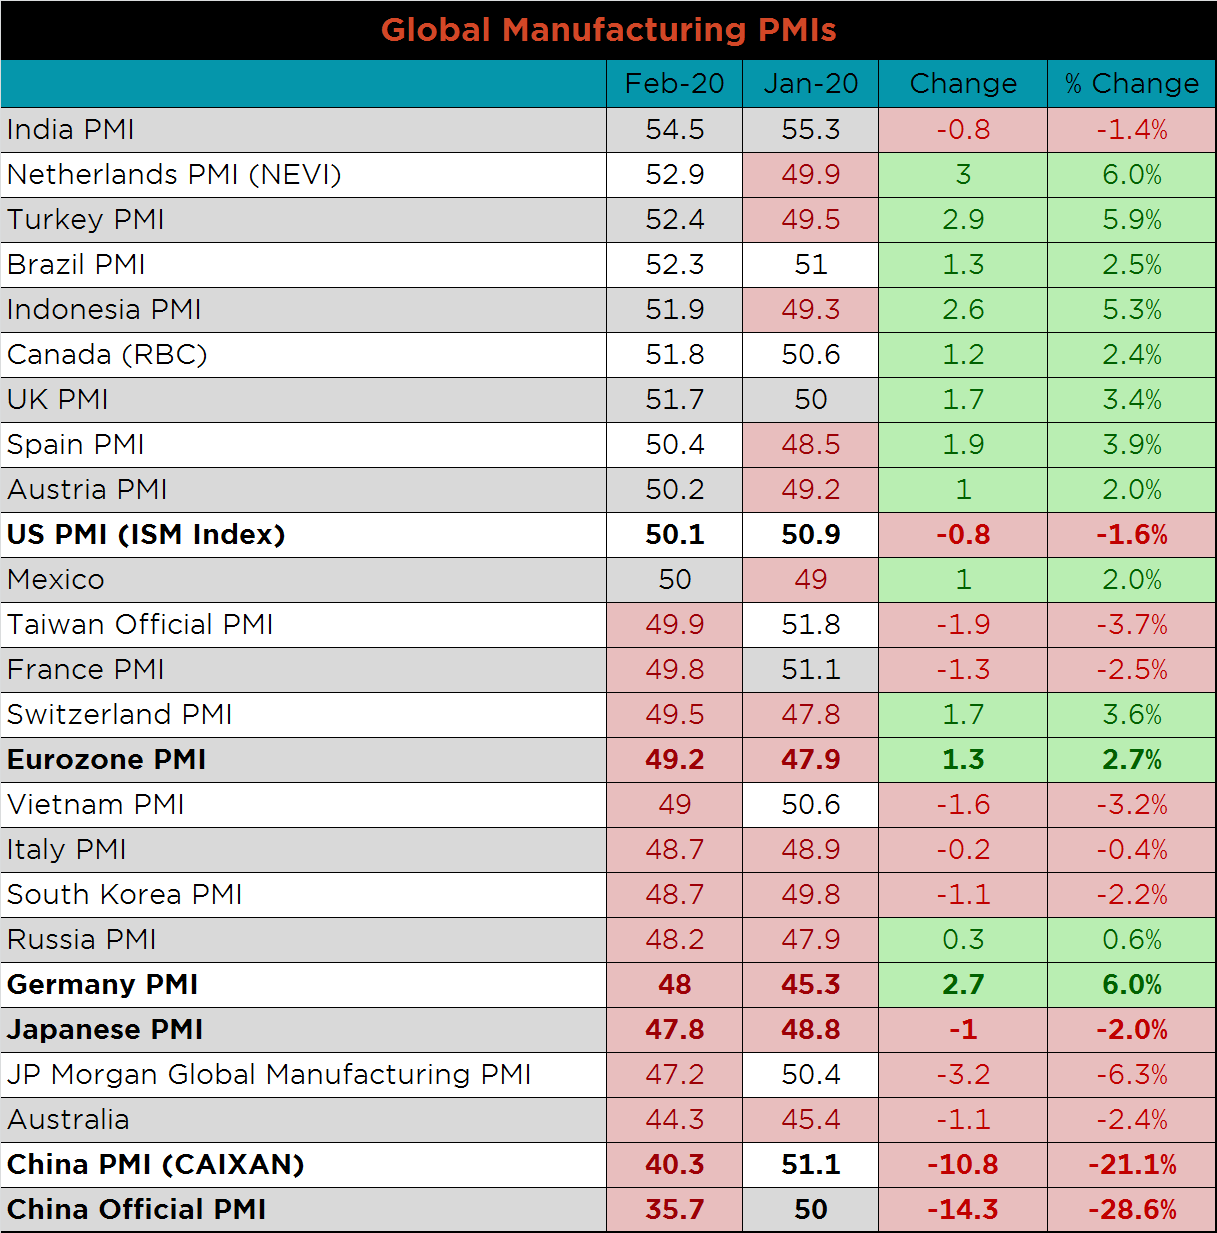
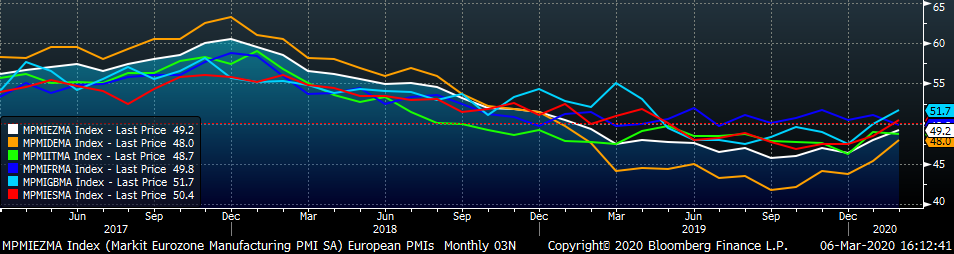
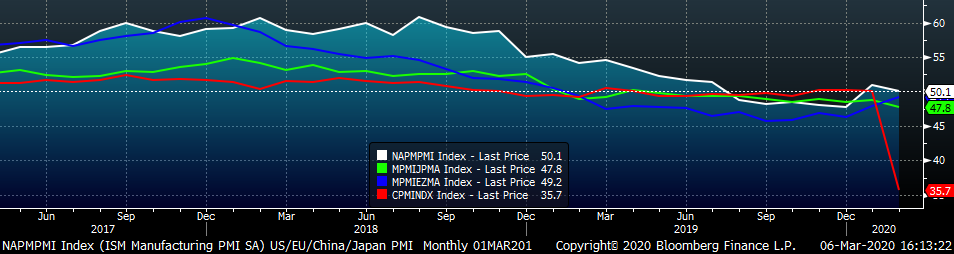
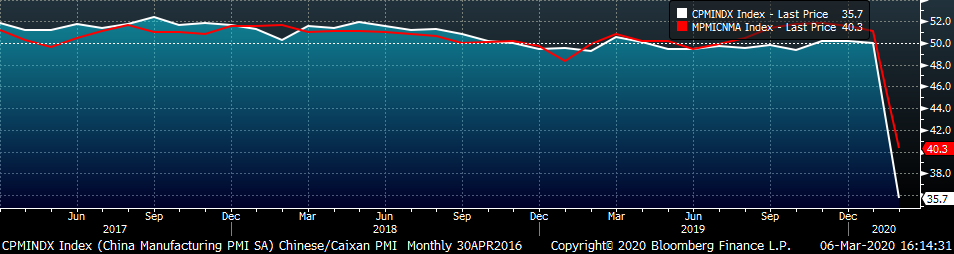
China’s official PMI printed down 14.3 points to 35.7, and the Caixan Manufacturing PMI printed down 10.8 points to 40.3.
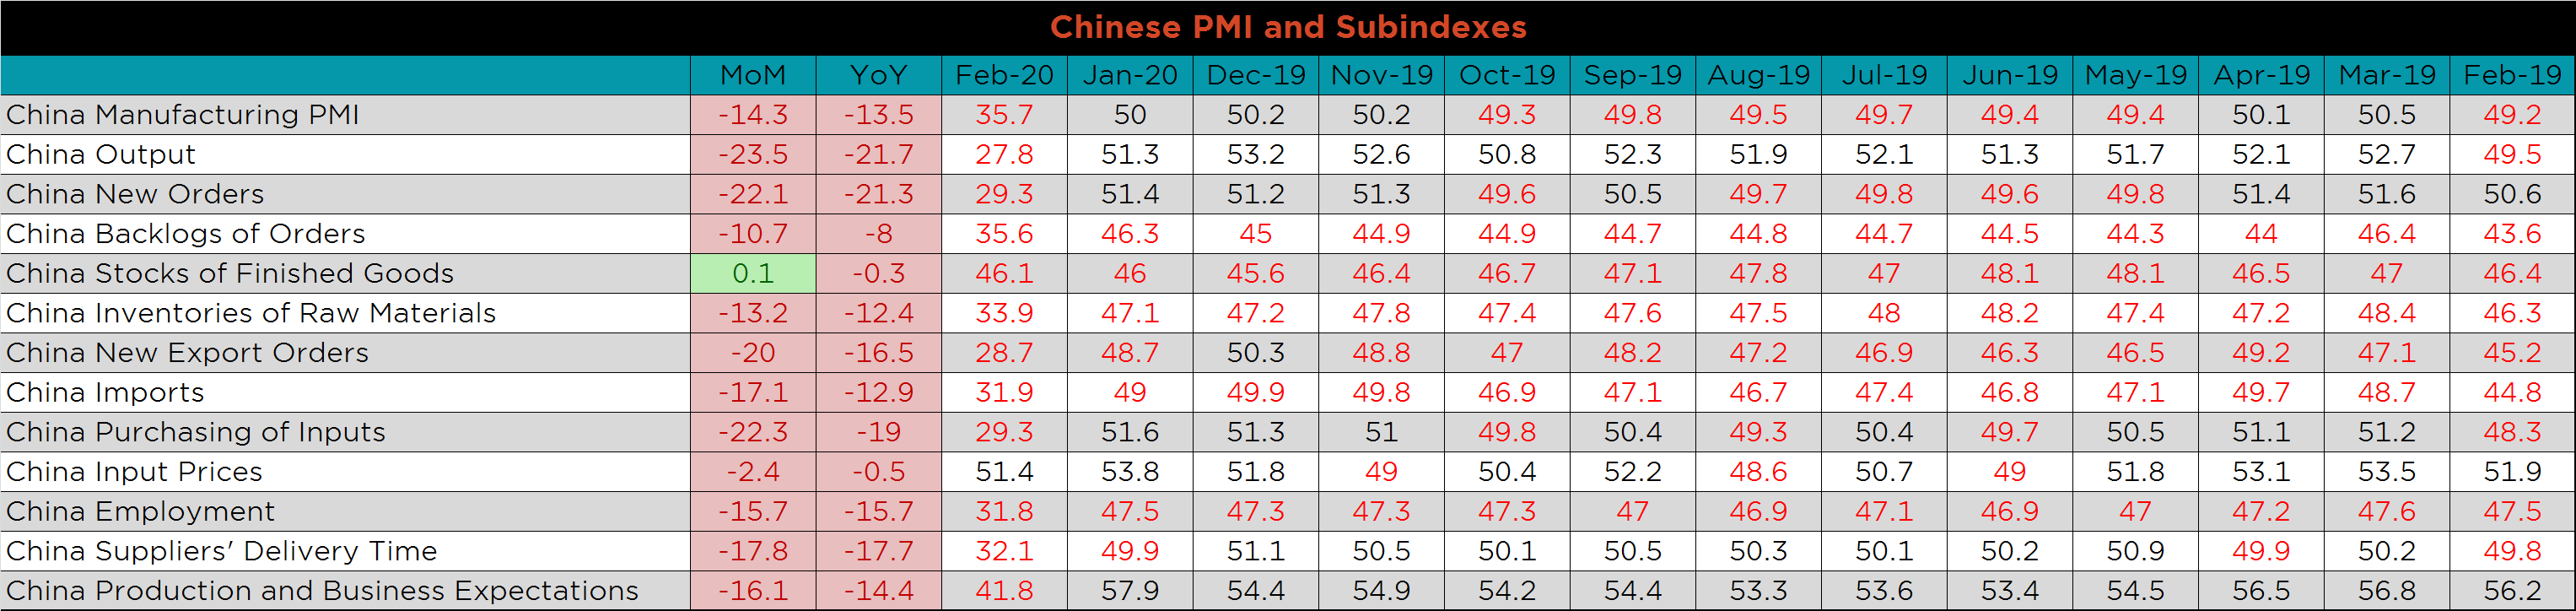
The table below breaks down China’s official manufacturing PMI subindexes. Output, new orders and purchasing of inputs were down the most MoM, while stock of finished goods was the only subindex to increase.
January seasonally adjusted U.S. construction spending was higher compared to December and very strong compared to last January. Private residential spending remains the strongest of the group, up 2.06% MoM and 8.98% YoY.
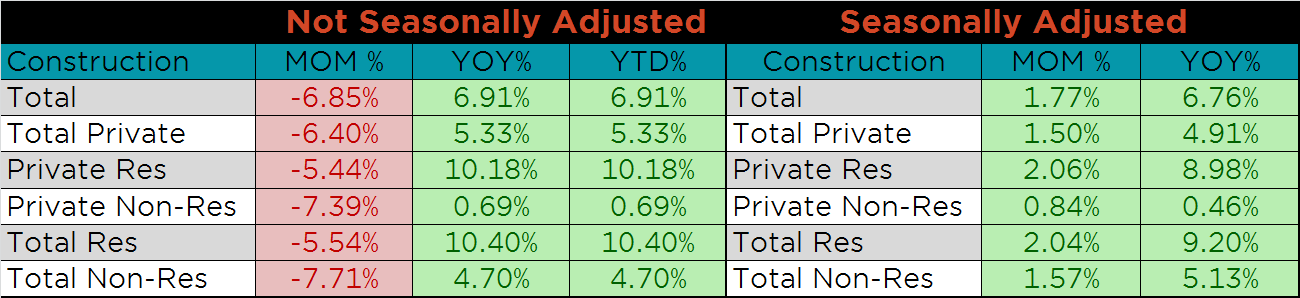
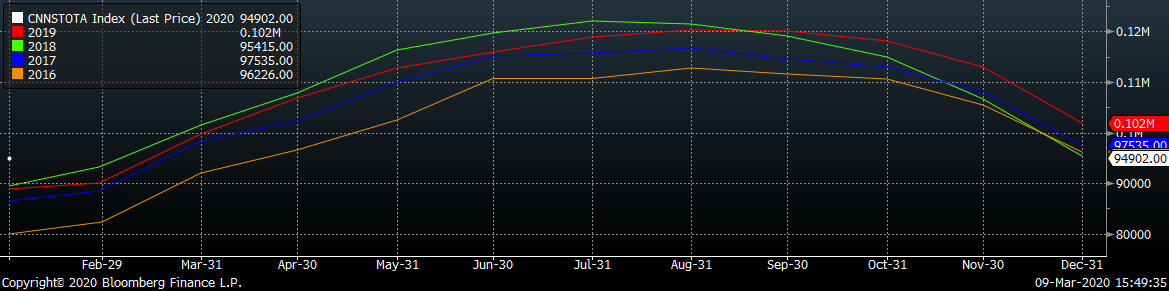
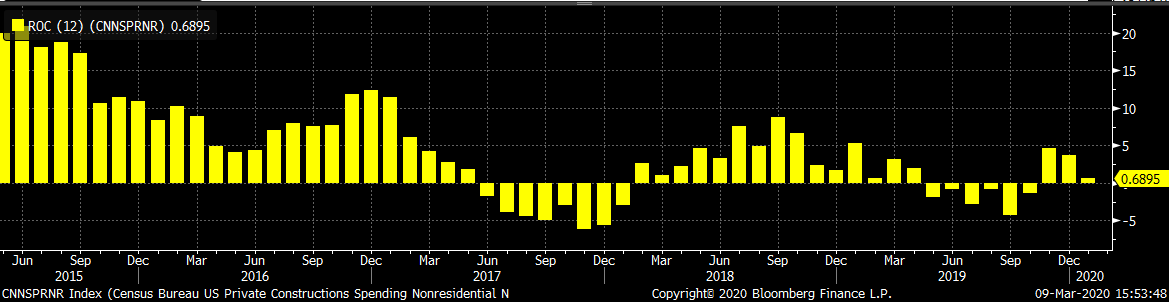
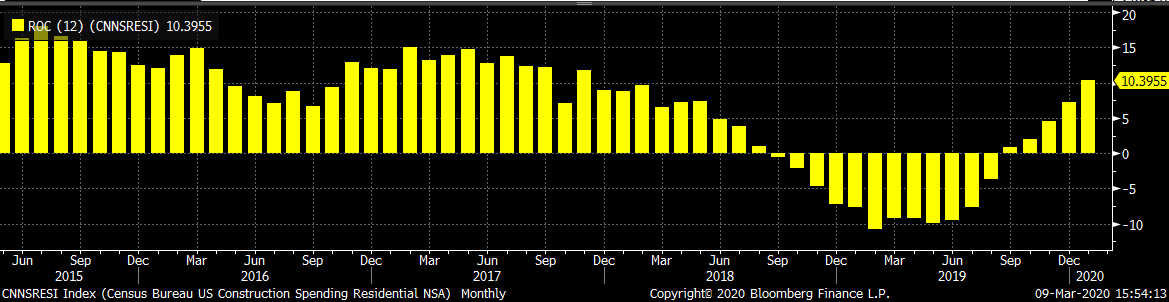
The white dot in the chart below represents construction spending in January and compares it to the spending of the previous 4 years. Year-over-year spending growth continued the strength seen in at the end of 2019. The last two charts show the YoY changes in construction spending. Private non-residential spending was revised higher in November and December and remains positive for January, while residential spending continued the strong growth trend that started in September.
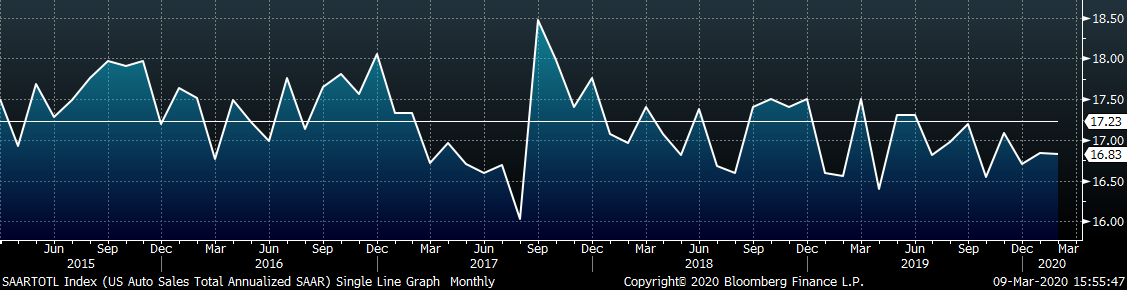
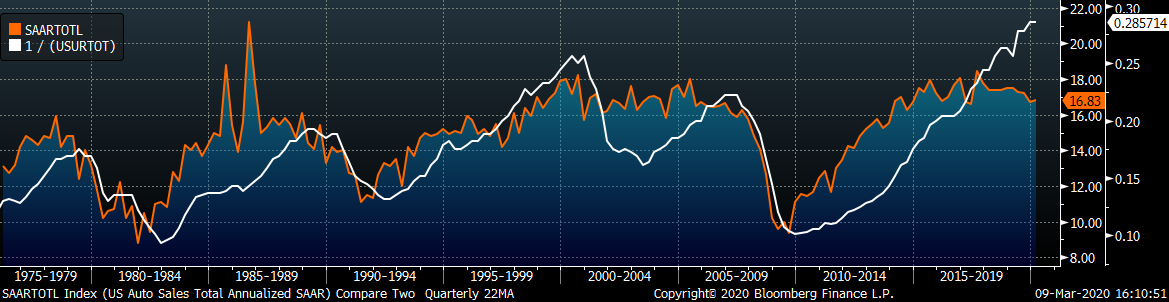
February U.S. light vehicle sales decreased slightly to a 16.83m seasonally adjusted annualized rate (S.A.A.R), but have been below their historical average of 17.23m since June. The second chart shows the relationship between the unemployment rate and auto sales. The unemployment rate is inverted to show that declining unemployment typically leads to increasing auto sales. Annualized auto sales have leveled off, while the labor market continues to improve for now.
Below are the most pertinent upside and downside price risks:
Upside Risks:
Downside Risks:
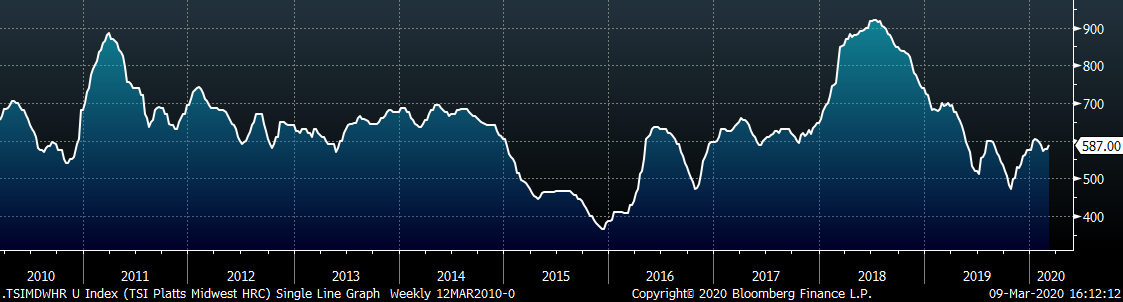
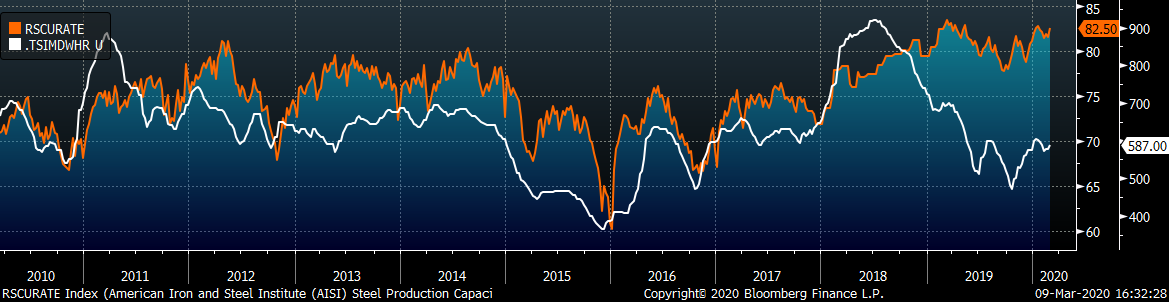
The Platts TSI Daily Midwest HRC Index was up $8.75 to $587.
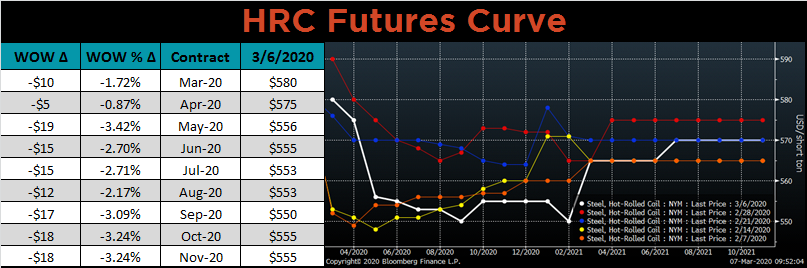
The CME Midwest HRC futures curve is below with last Friday’s settlements in white. The curve was down across all expirations, most significantly in May 2020 to March 2021.
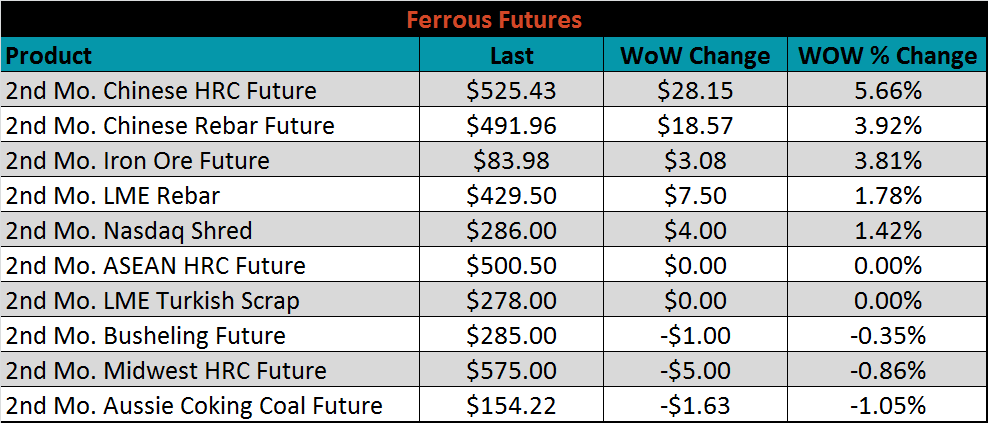
March ferrous futures were mixed. The Australian coking coal future lost 1.1%, while the Chinese HRC future gained 5.7%.
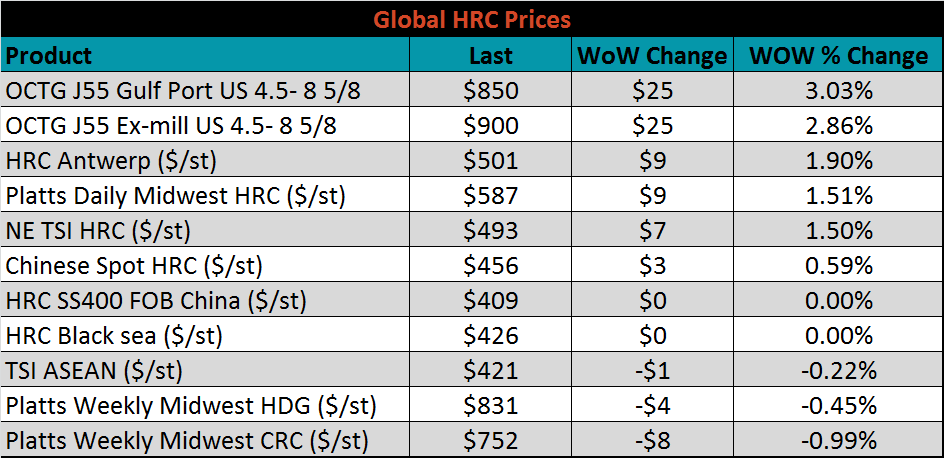
The global flat rolled indexes were mixed. Antwerp HRC was up 1.9%, while Midwest CRC was down 1%.
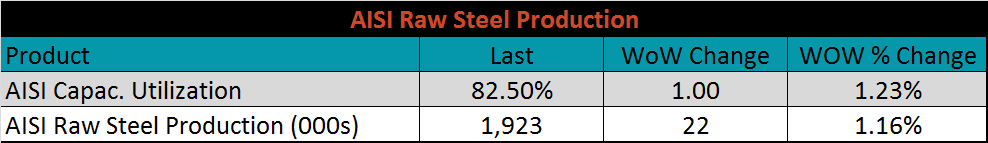
The AISI Capacity Utilization Rate was up 1% to 82.5%.
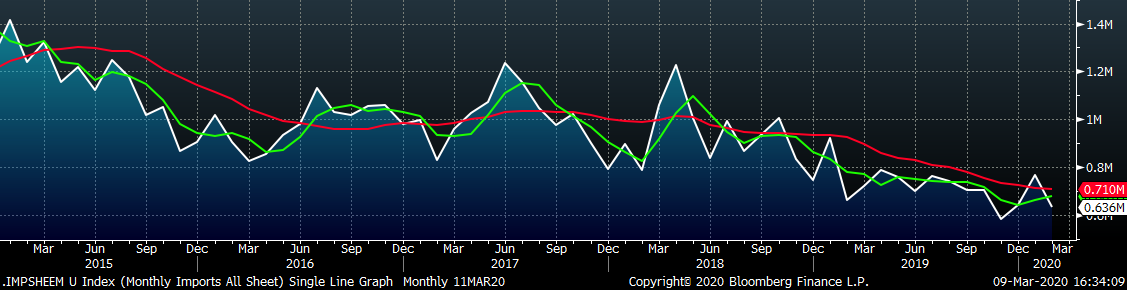
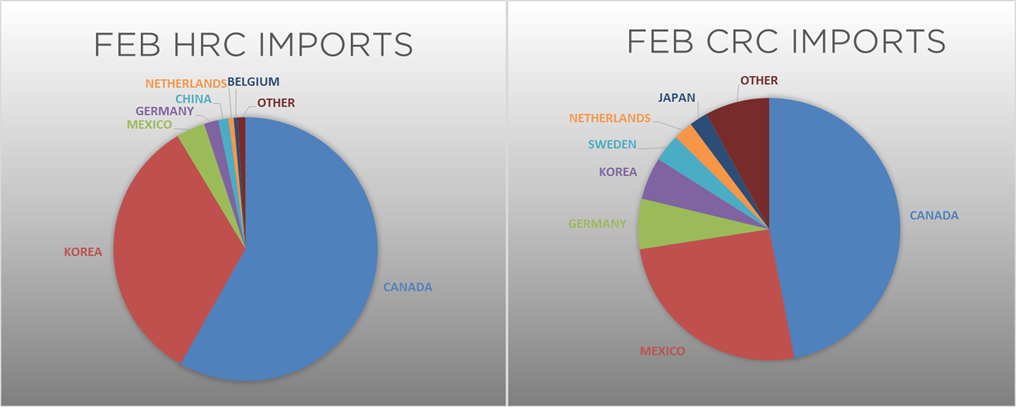
February flat rolled import license data is forecasting a decrease of 130k to 636k MoM.
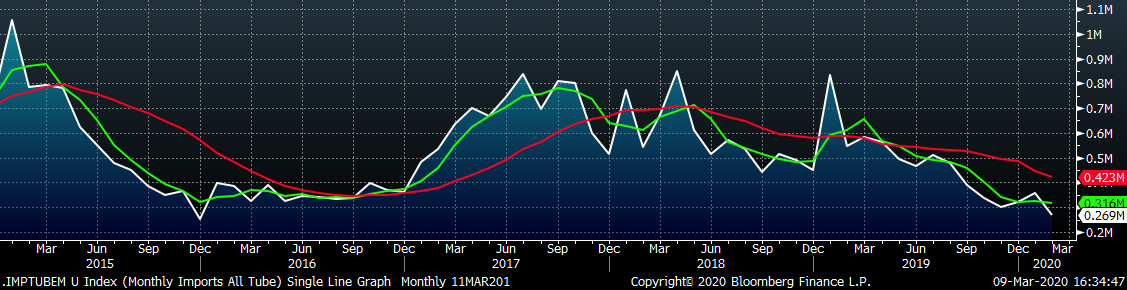
Tube imports license data is forecasting a MoM decrease of 90k to 269k tons in February.
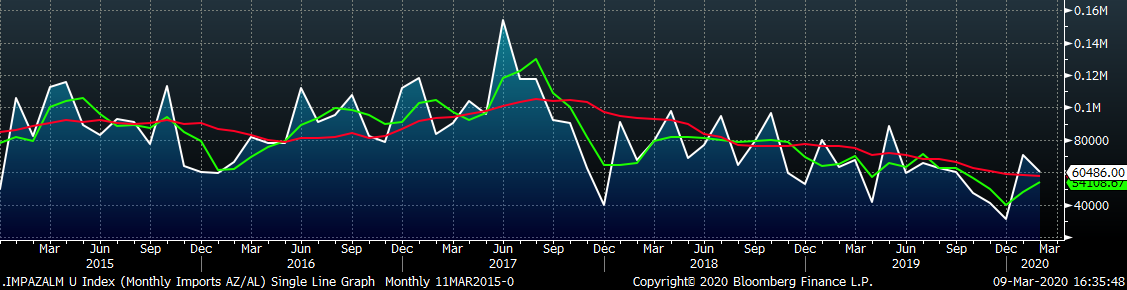
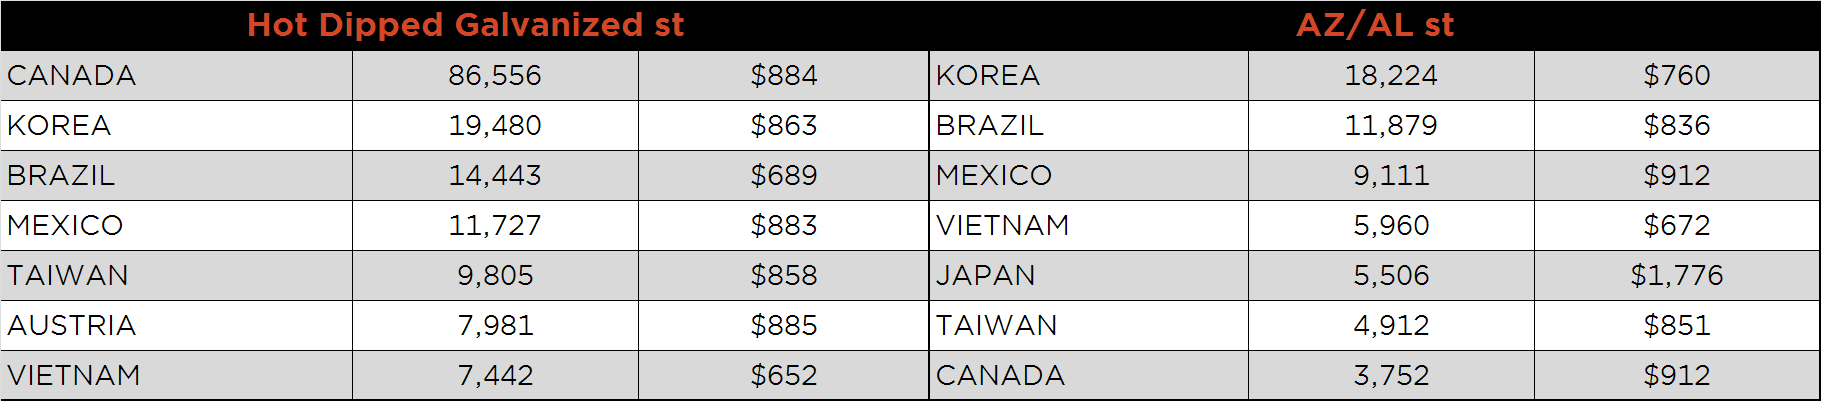
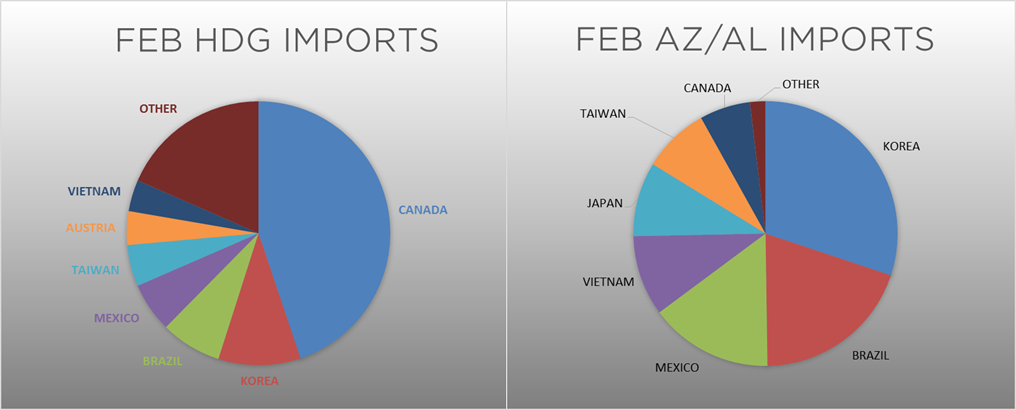
AZ/AL import license data is forecasting a decrease of 10k in February to 60k.
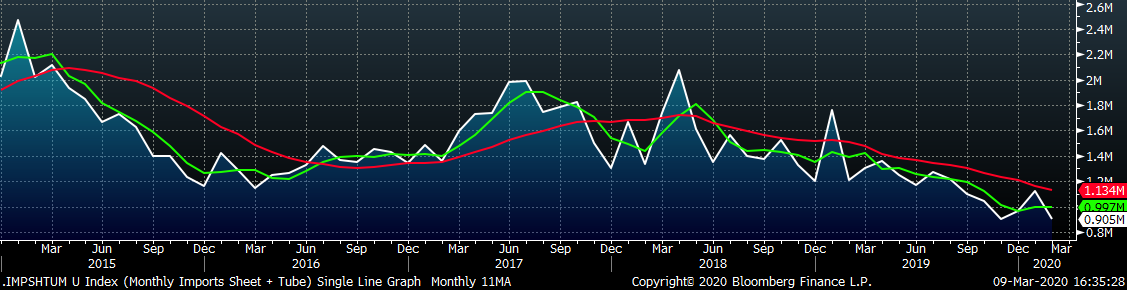
Below is February import license data through March 3, 2020.
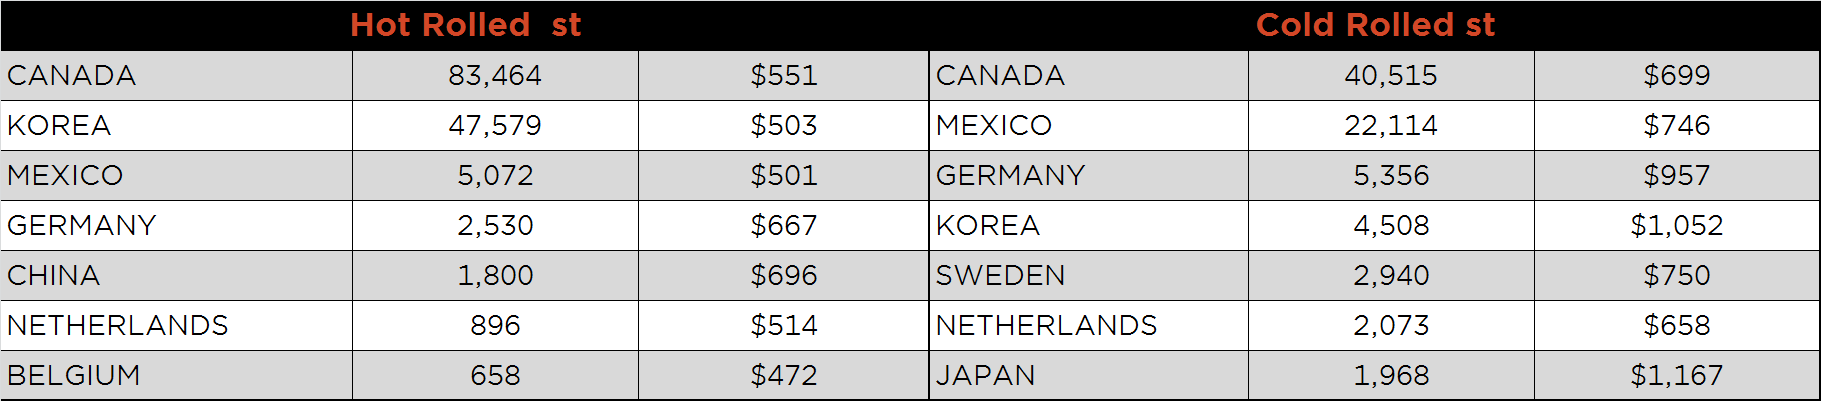
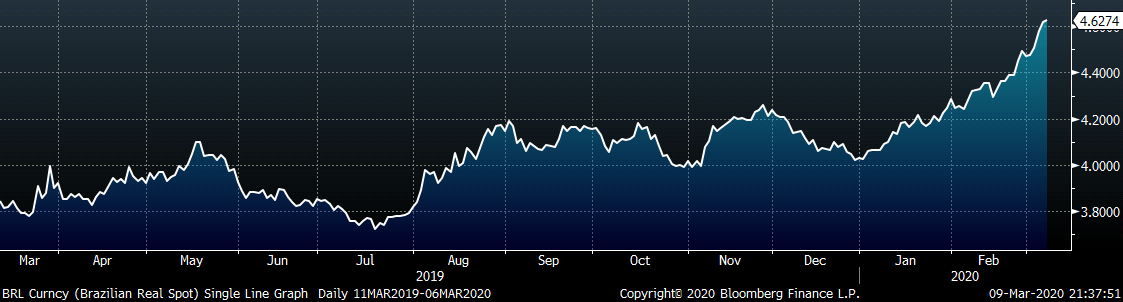
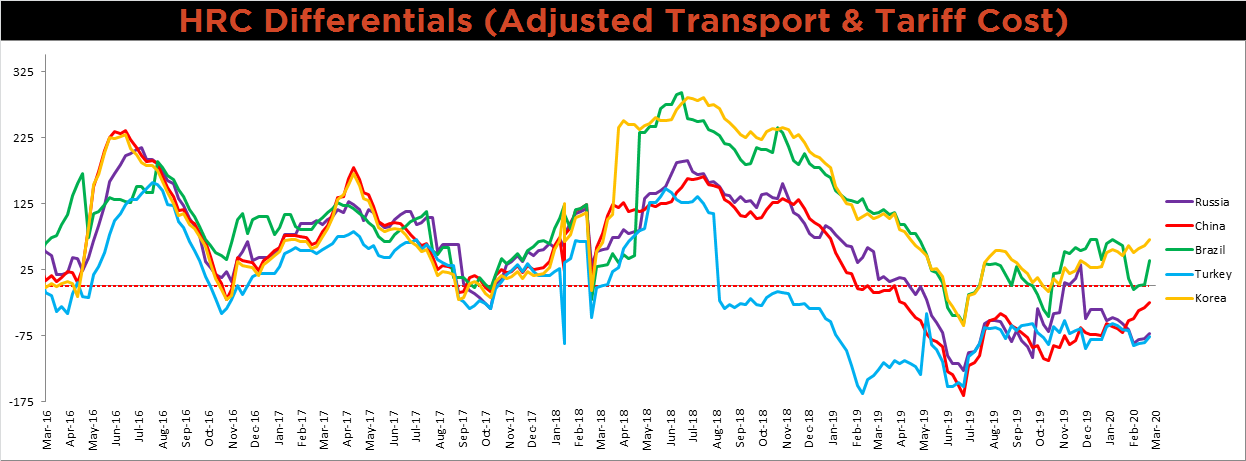
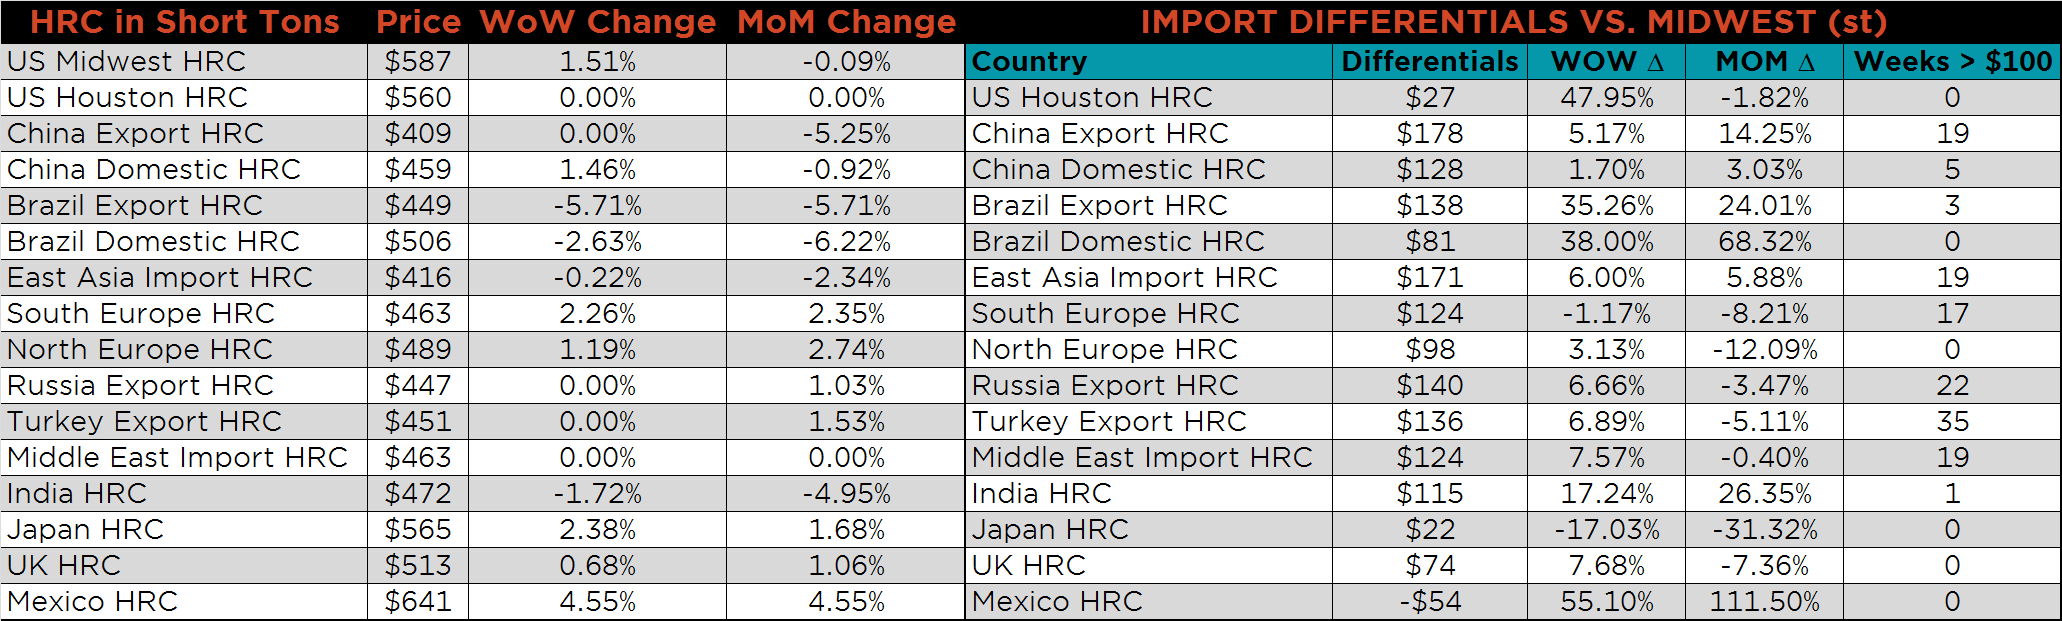
Below is the Midwest HRC price vs. each listed country’s export price using pricing from SBB Platts. We have adjusted each export price to include any tariff or transportation cost to get a comparable delivered price. All of the differentials rose, most significantly the Brazilian.
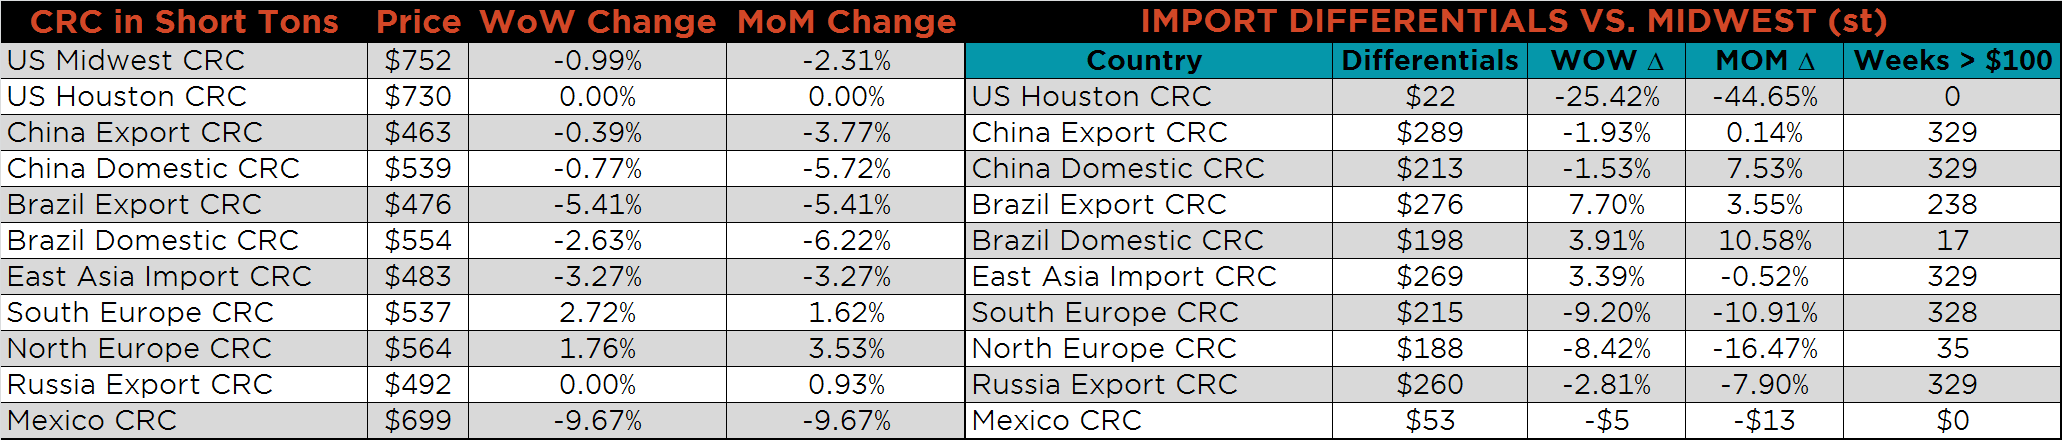
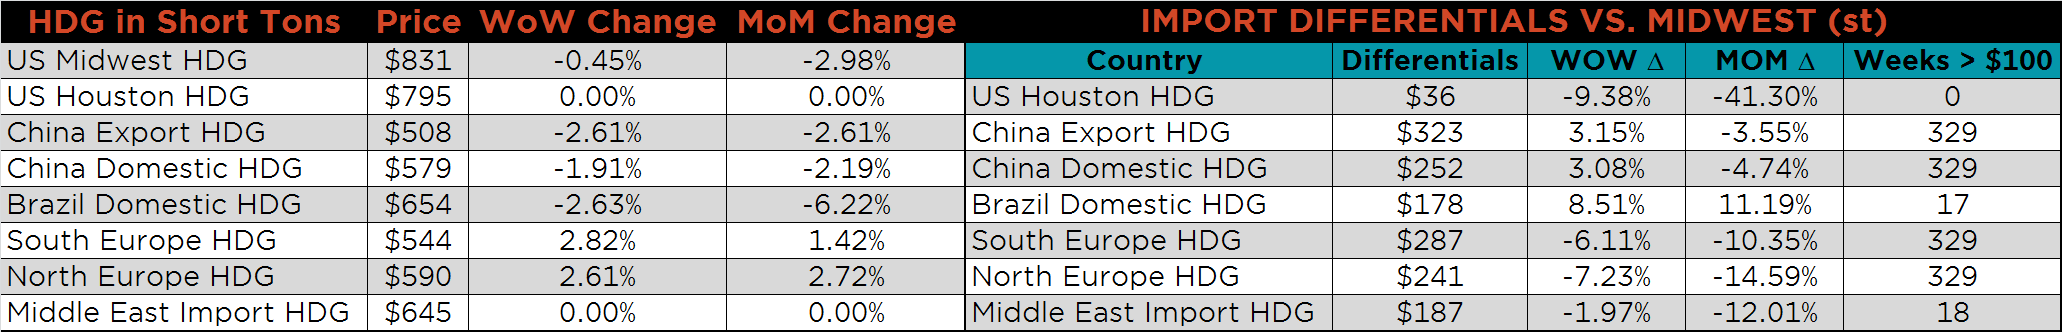
SBB Platt’s HRC, CRC and HDG pricing is below. The Midwest HRC price was up 1.5%, while CRC and HDG prices were down, 1% and 0.5%, respectively. The Brazilian HRC and CRC prices were down 5.4%.
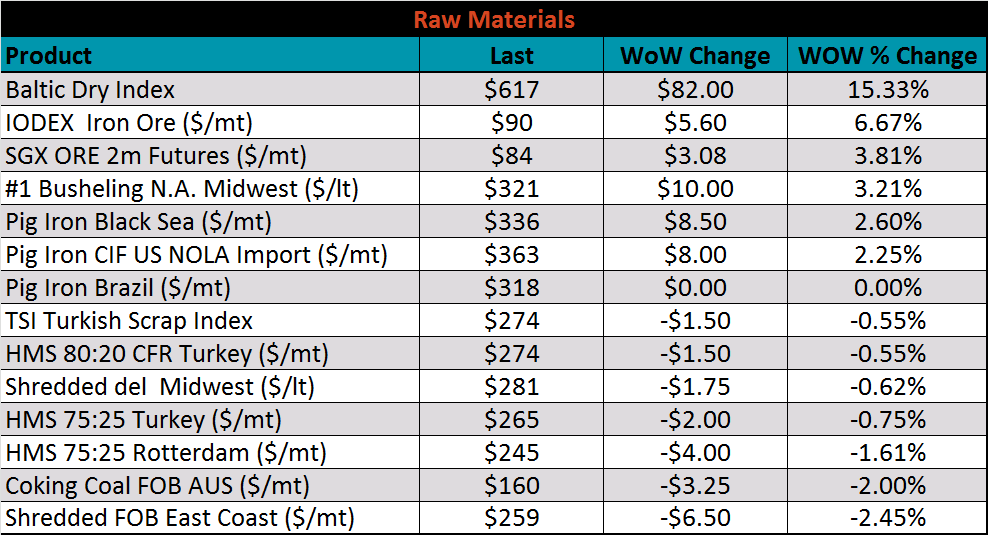
Raw material prices were mixed, the IODEX was up 6.7%, while East Coast shredded was down 2.5%.
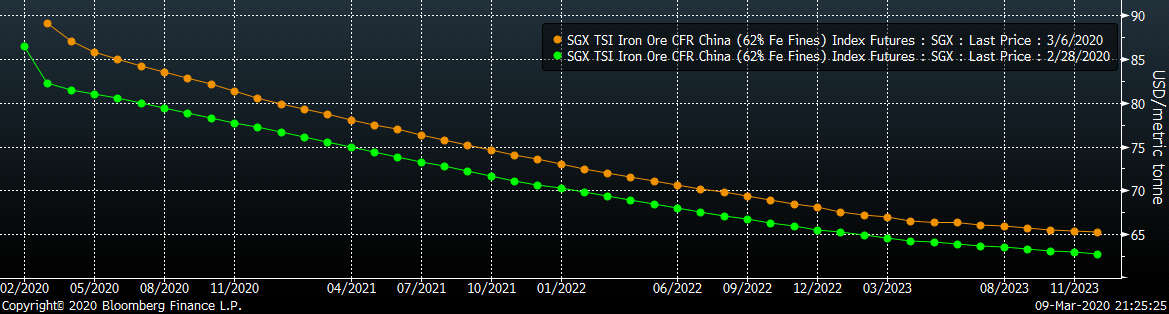
Below is the iron ore future curve with Friday’s settlments in orange, and the prior week’s settlements in green. The entire curve shifted higher, most significantly in the front.
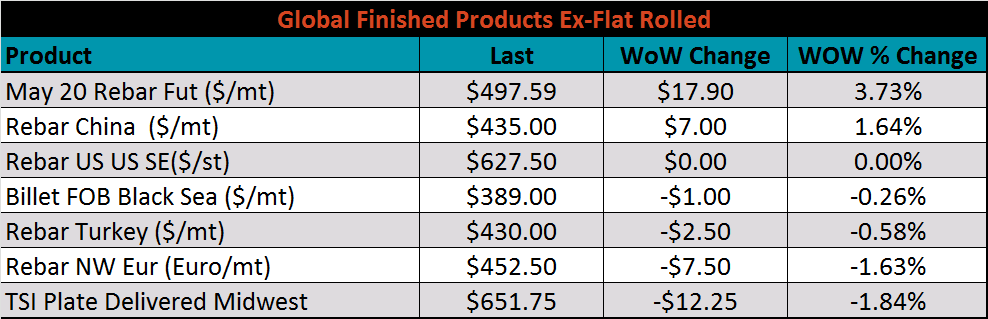
The ex-flat rolled prices are listed below.

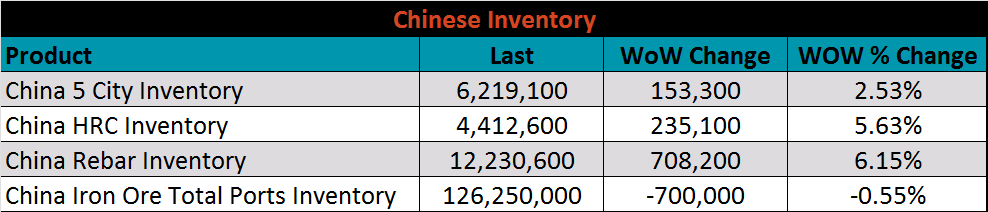
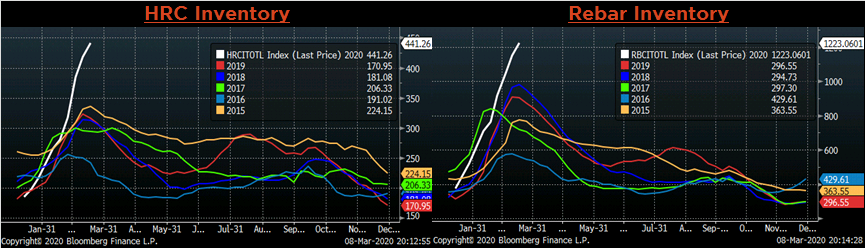
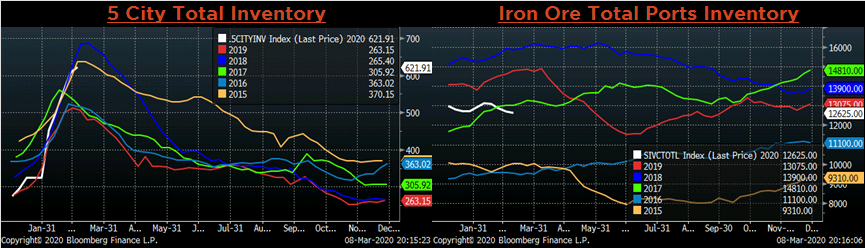
Below are inventory levels for Chinese finished steel products and iron ore. 5 City, HRC and rebar inventory levels continue to increase dramatically, while iron ore port inventory fell further. After the initial decline in Chinese spot and future prices from the coronavirus, record high inventories have not had further effects on pricing.
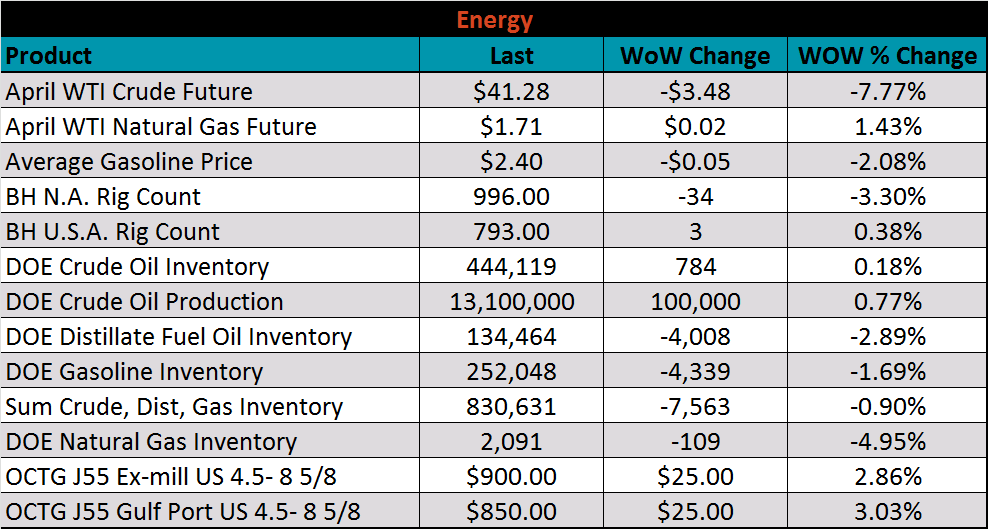
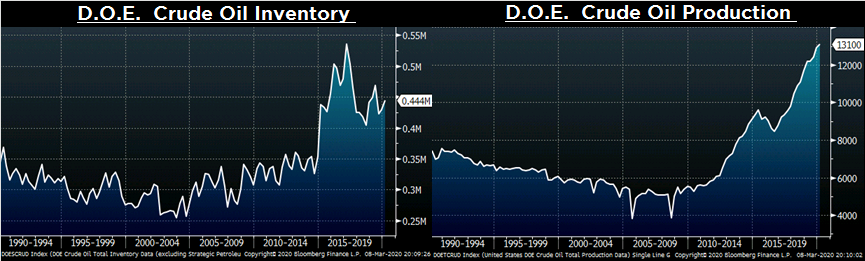
Last week, the April WTI crude oil future lost another $3.48 or 7.8% to $41.28/bbl. The aggregate inventory level was down 0.9% and crude oil production rose to 13.1m bbl/day. The Baker Hughes North American rig count was down thirty-four rigs, while the U.S. rig count was up three rigs. Inventory and rig counts are too high for this price level, and will likely decline within the next few months to help balance the market.
The list below details some upside and downside risks relevant to the steel industry. The orange ones are occurring or look to be highly likely. The upside risks look to be in control.
Upside Risks:
Downside Risks: