Content
-
Weekly Highlights
- Market Commentary
- ISM PMI
- Global PMI
- Construction Spending
- Auto Sales
- Risks


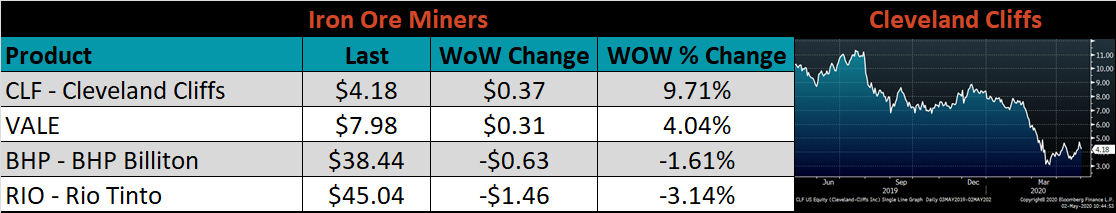
Last week mills began raising their offer prices for spot transactions, initiated by mini mills without an official announcement. However, the integrated mills quickly followed suit and issued price increase announcements, targeting HRC prices above $500/st. This is significantly higher than the spot transaction price seen over the last two weeks in the low $400s. Additionally, demand is still depressed with automotive production halted, energy prices at historic lows and manufacturing factories closed across the nation. So why do mills think that price increases will be supported in the market after a collapse in price over the last two months and amidst largescale economic shutdowns? To put it simply, there is a steel shortage. Mills believe they have curtailed production enough to reflect the current demand situation, and we do too. We will analyze where these supply cuts appeared, and why this will support prices in the future.
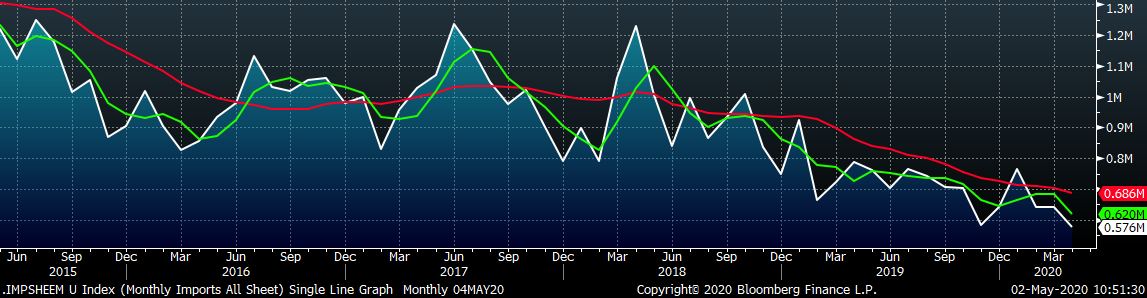
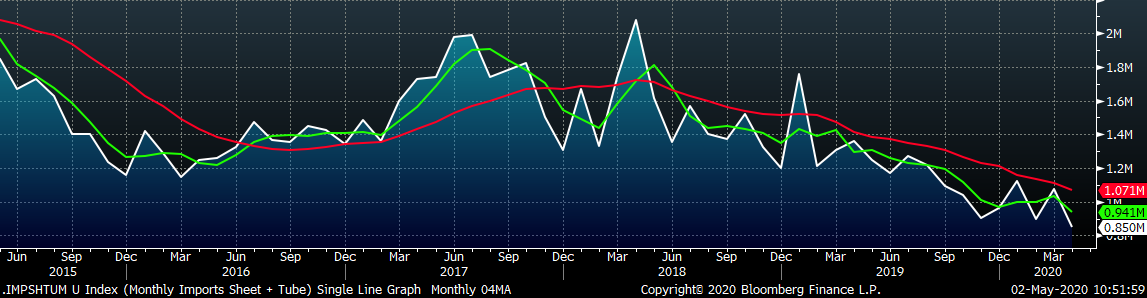
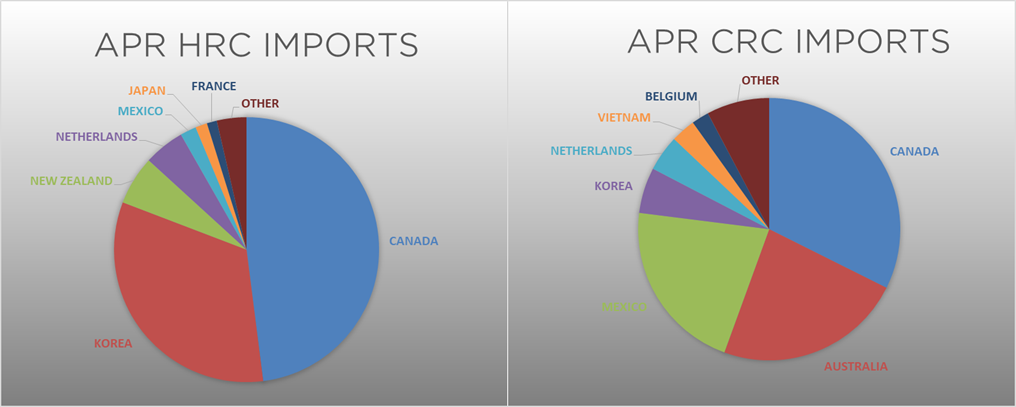
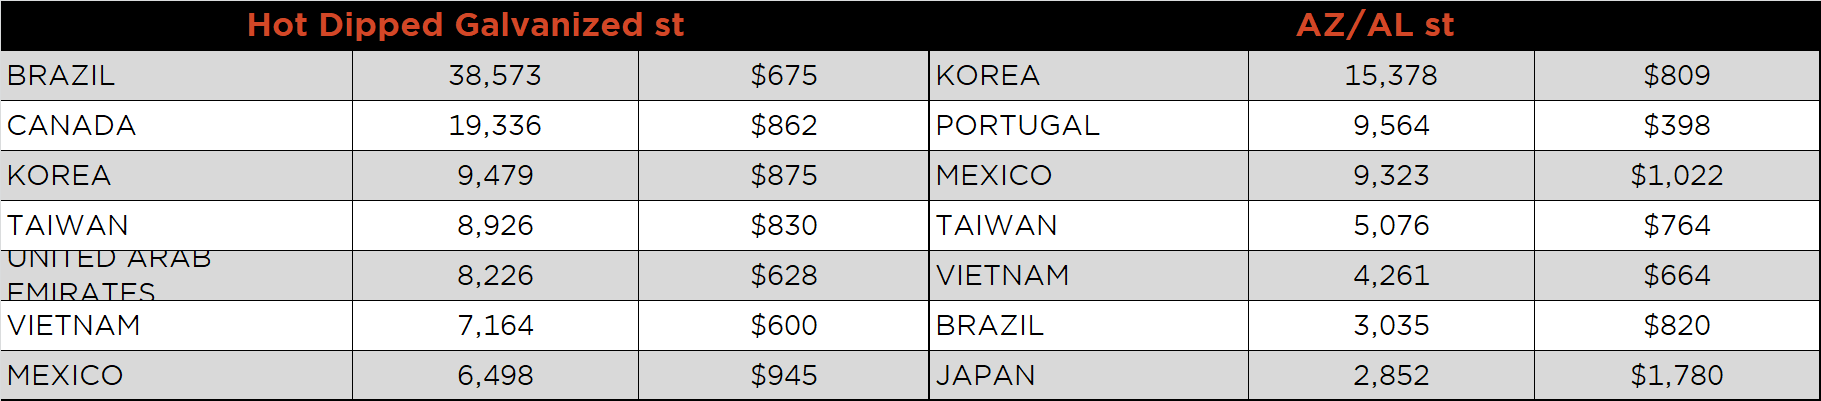
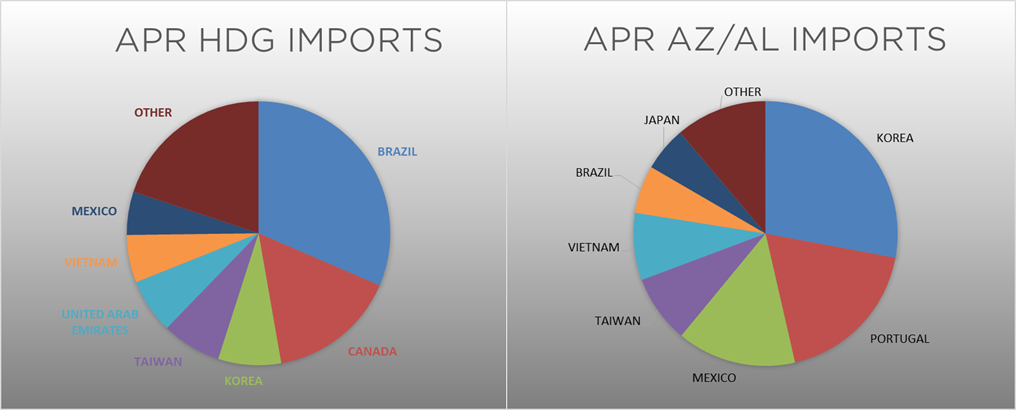
Although a small component of the domestic supply picture, imports play an important role in filling the material needs for select products not produced in the US. After all, the country is steel short, consuming more material than it produces. Imports also compete with domestically produced material on a price basis, although the Section 232 tariffs have reduced this to a degree. The below chart shows the 12 month total of net sheet imports (imports minus exports) to show an annualized impact of the decline in imports.
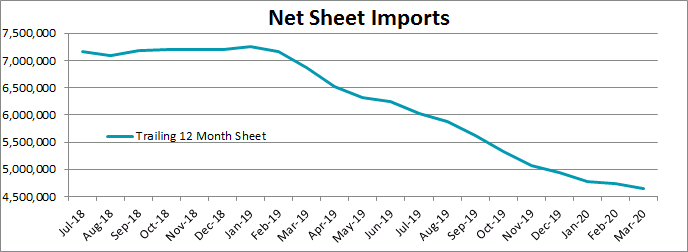
In the past 12 months, there were approximately 2.5 million fewer tons of flat rolled steel imported into the US compared to the beginning of 2019. Moreover, this amount is likely to increase as pricing differentials make imports unattractive, and supply chains adjust to the coronavirus shutdowns. This shift results in an increase in market share for domestic producers, which increases their pricing power. Therefore, the expectation for continued low levels of imports will allow price increase announcements from the mills to hold more weight.
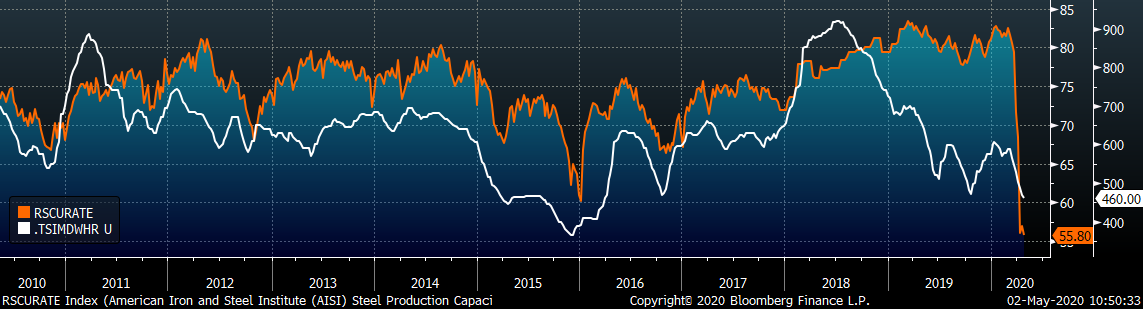
A more significant factor in the domestic supply landscape is the level of production at mills in the US. Currently, mini mills are producing near 70% of their total capacity, while integrated mills are around 30%. However, cuts in production began several weeks ago, limiting the material produced over the last month during the worst of the economic shutdown. Therefore, the collapse in demand did not produce an inventory hangover like the one we saw during the declining demand environment in the first half of 2019. This time, producers got ahead of the curve and created a short squeeze in the market for steel. Additionally, the scrap market continues to see tightness, which explains why mini mills were the first to push for higher spot HRC prices.
Over the next few weeks, demand returning as the economy slowly restarts will encourage mills to push prices even higher. However, uncertainty is abundant throughout the economy, and a bumpy road ahead is likely in the steel market. A balanced hedging program will remove this volatility, and provide opportunities to advantageously lock in or exit hedges for those who are prepared.
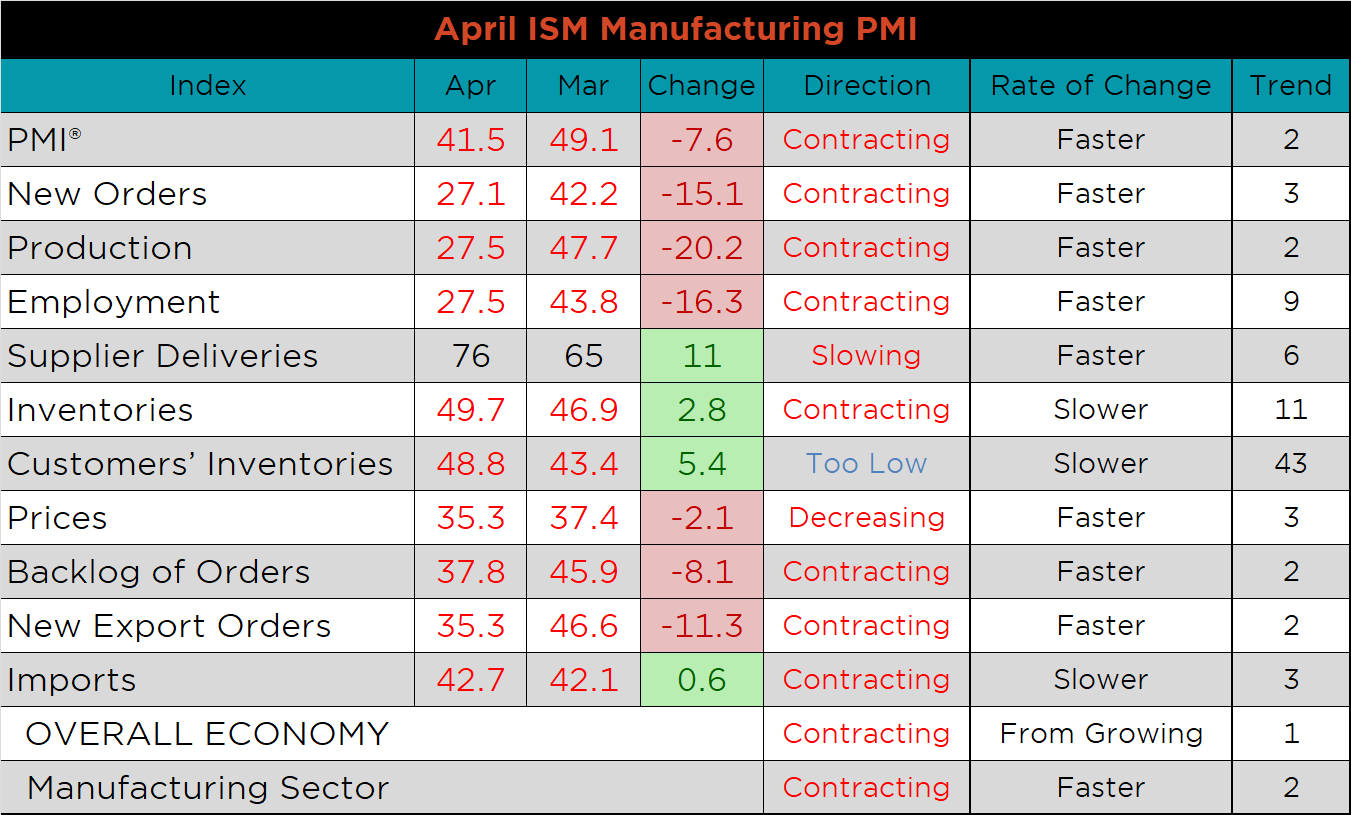
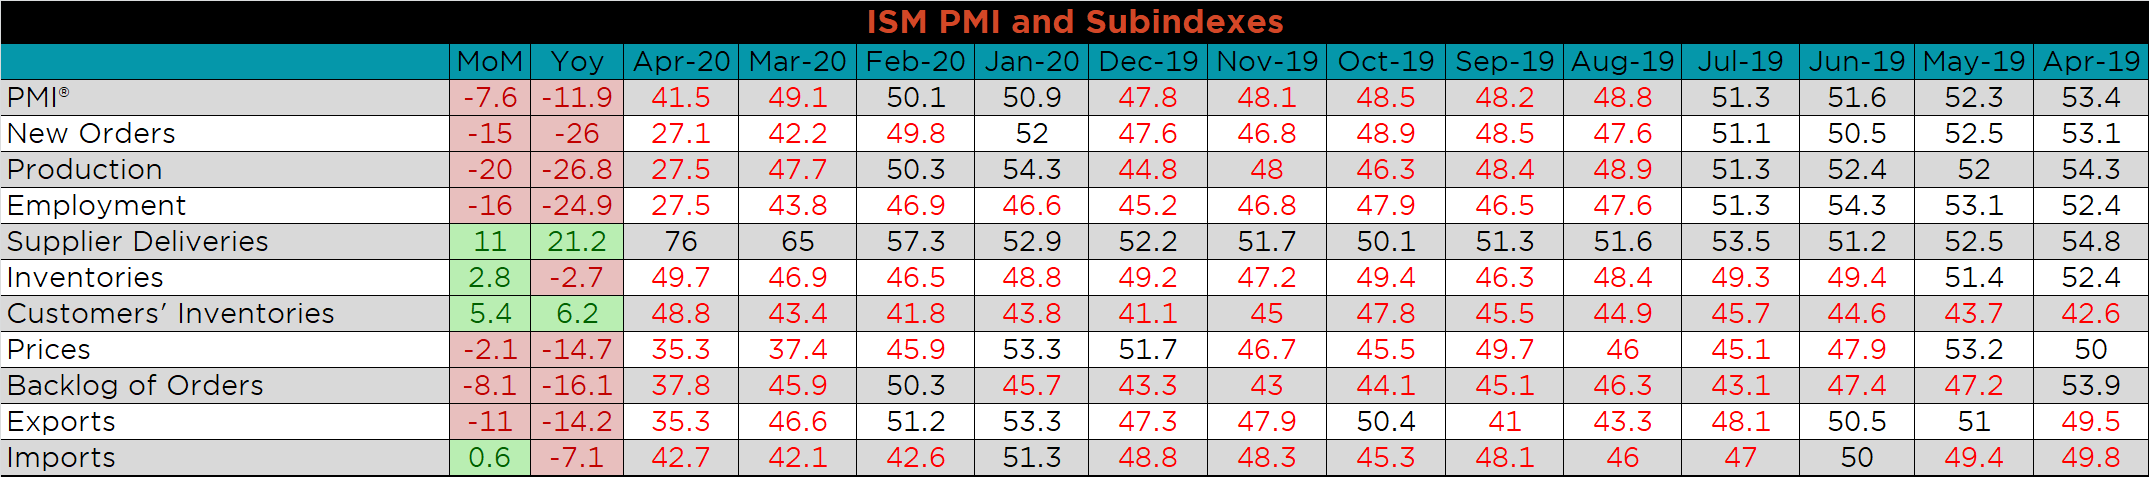
The April ISM Manufacturing PMI and subindexes are below. The topline PMI number was down to 41.5 and fell further into contraction.
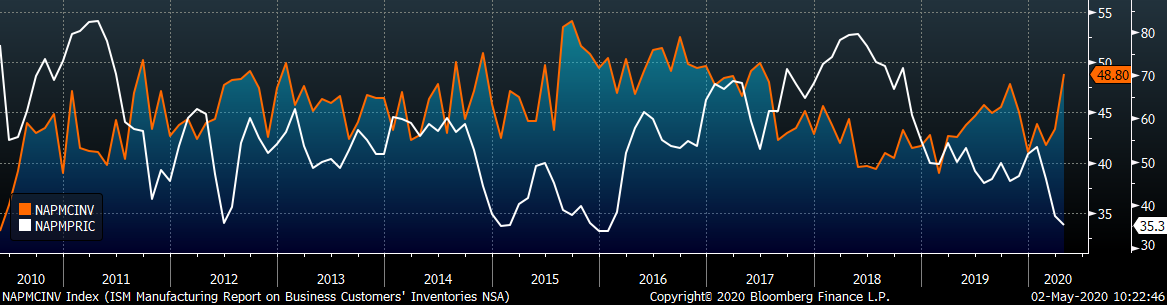
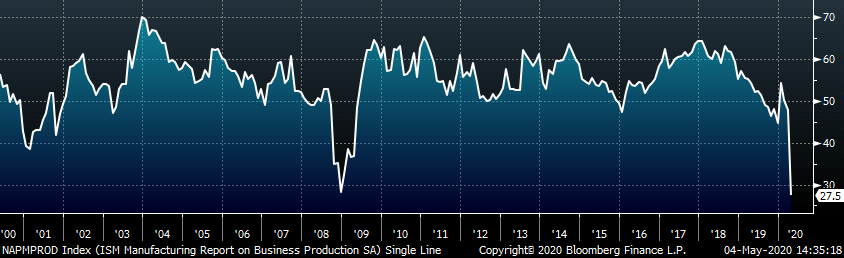
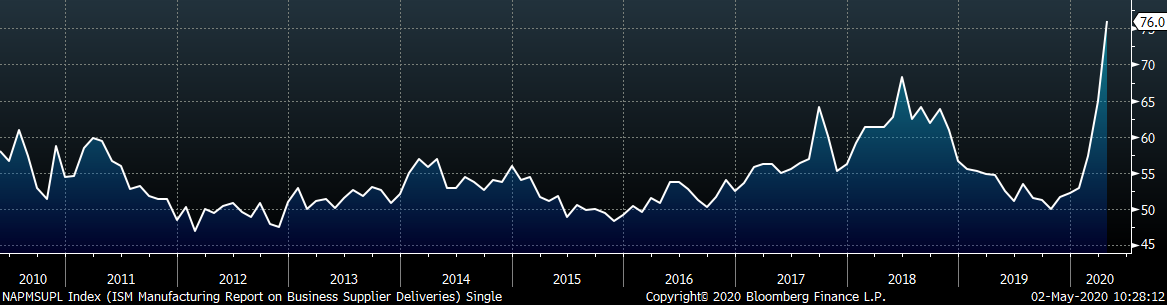
The chart below compares the ISM prices subindex with the ISM customer inventories subindex. For manufacturers, low prices and high inventories is a current risk in terms of generating cash, and headwind in terms of margins when economic activity starts back up. The second chart shows the production subindex declining below the 2008 low. The last chart shows the supplier deliveries subindex, which moved significantly higher for the second straight month. As mentioned last month, the function of this subindex typically represents tightening supply chains due to increased demand. In this case, it merely inflates the topline number because of government mandated disruption.
Much like last month, most subindexes were lower MoM, and YoY. Supplier deliveries, inventories and customer inventories moved higher again this month, joined by imports, up slightly off recent lows.
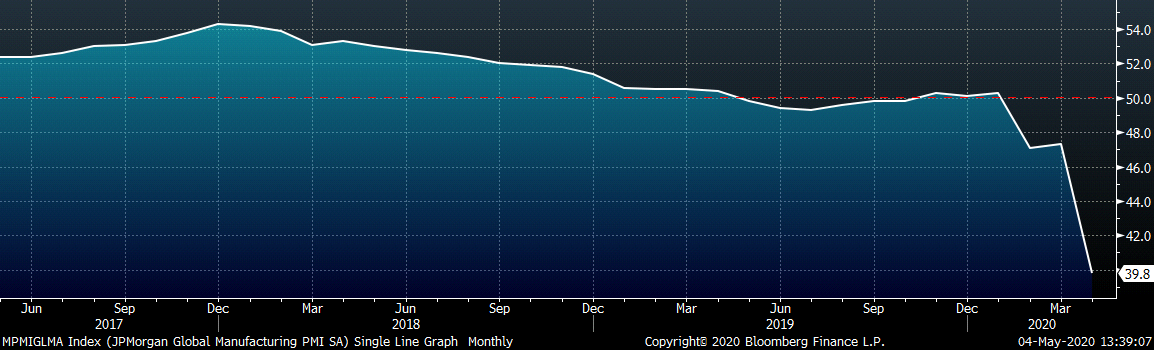
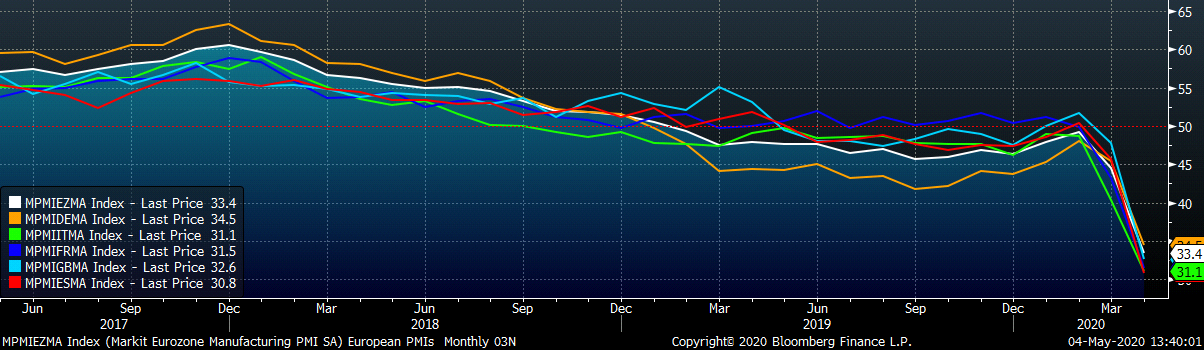
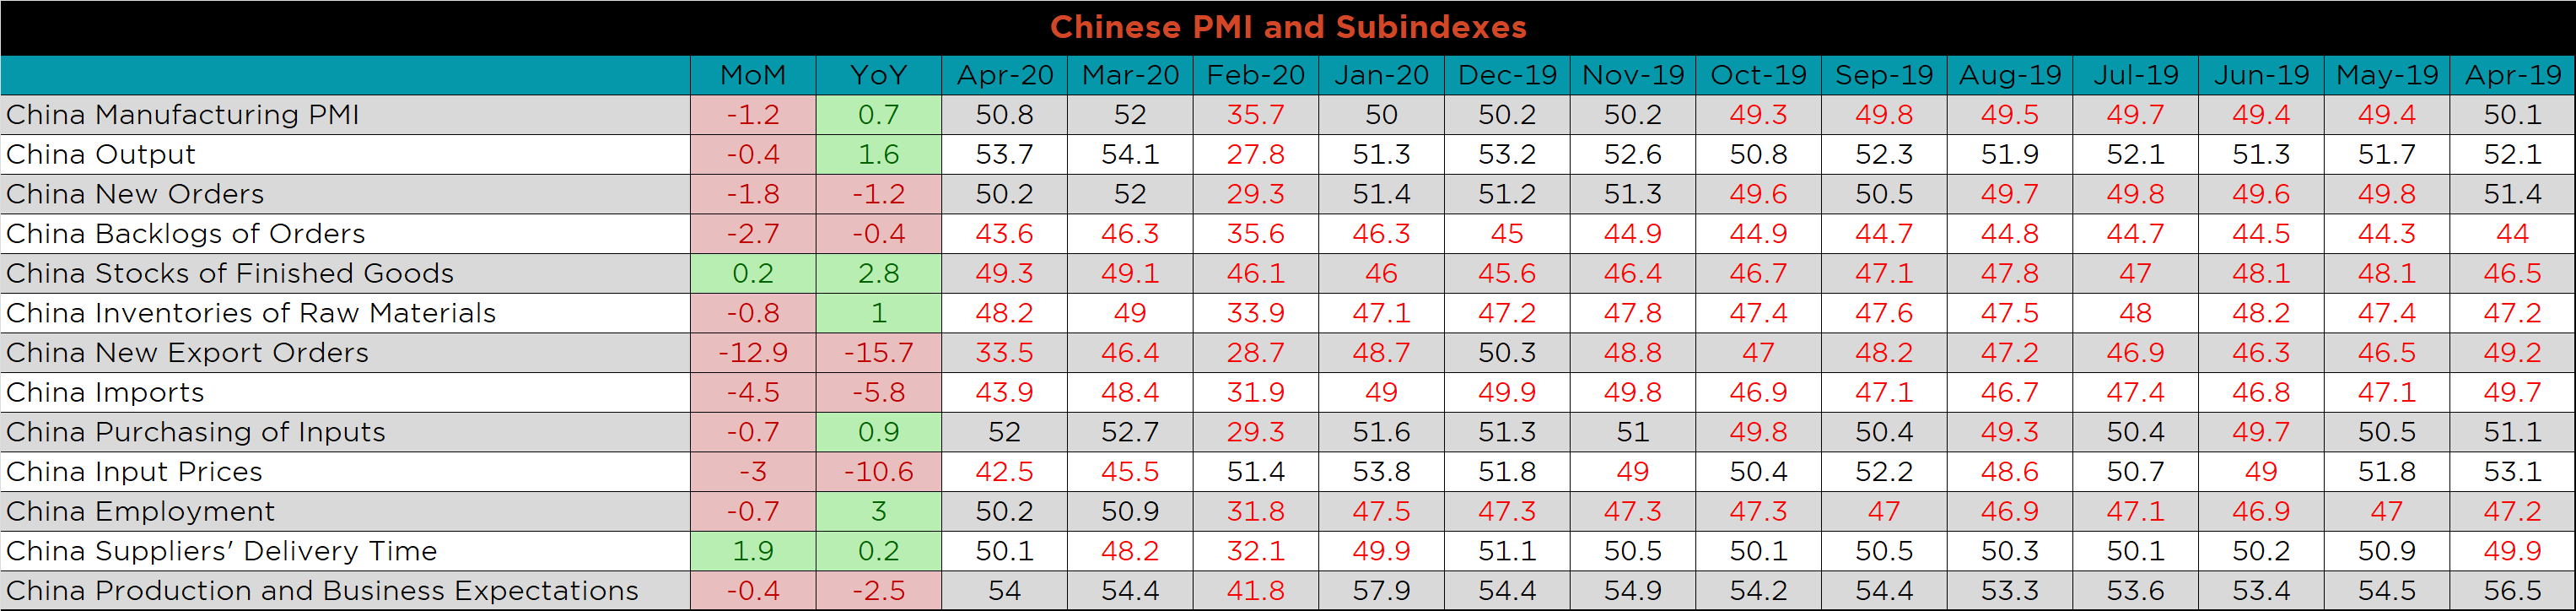
April’s global PMI printings show significant declines as every PMI moved lower MoM, and is showing contraction across the board, except China’s government published index.
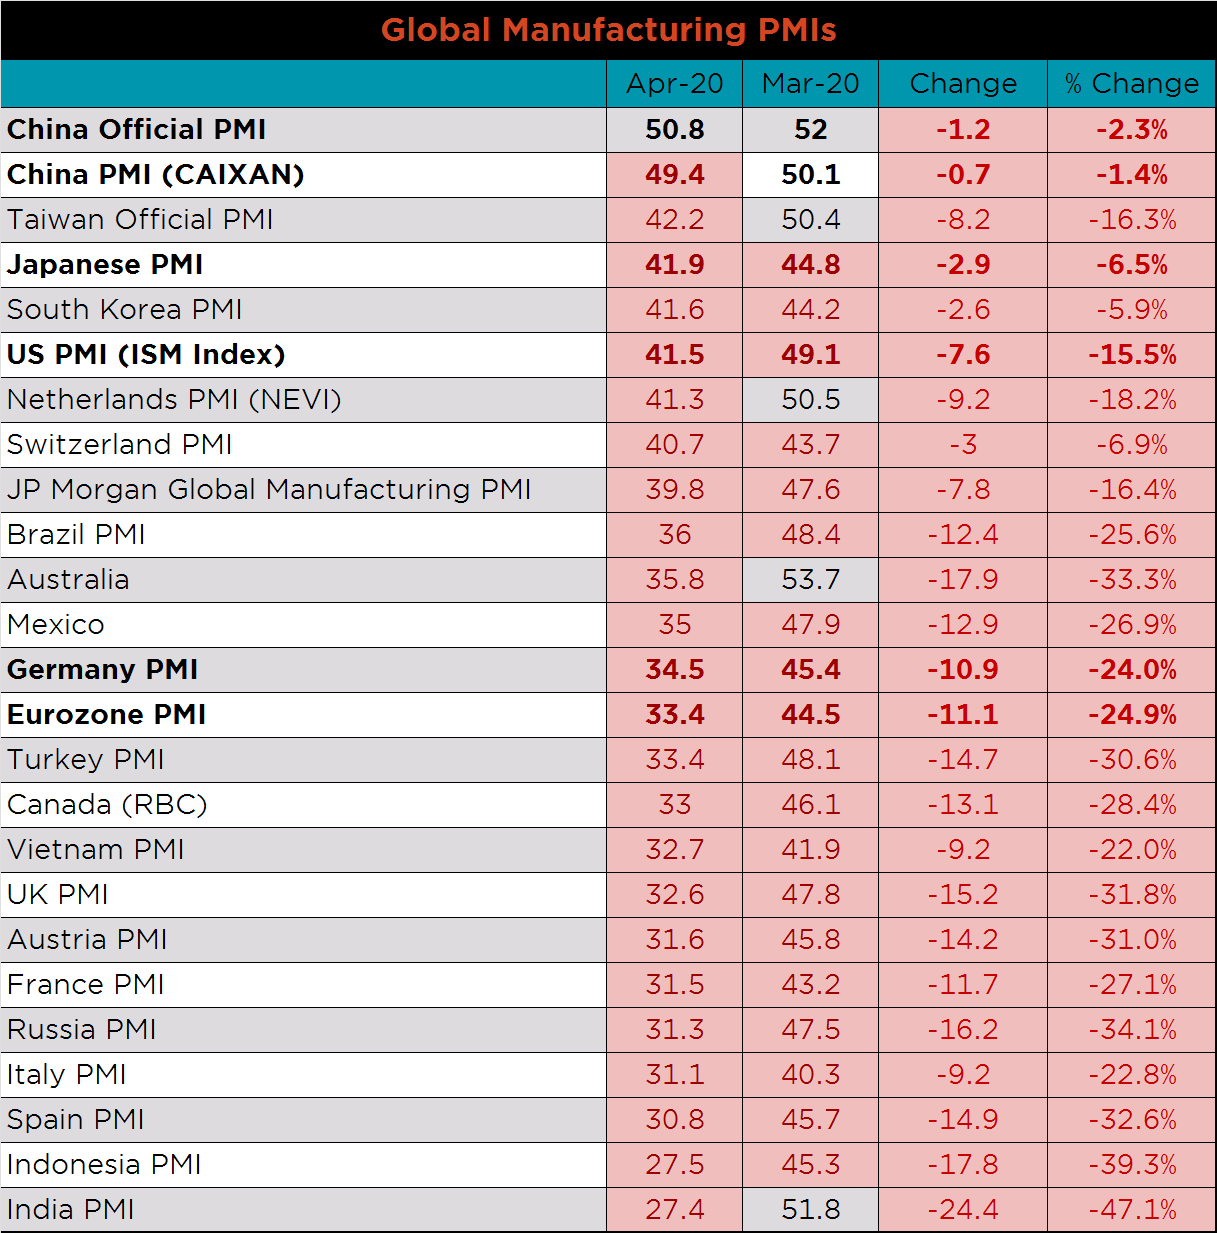
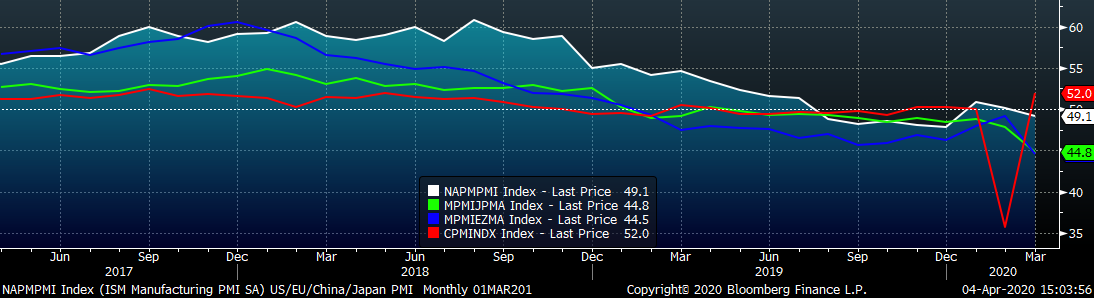
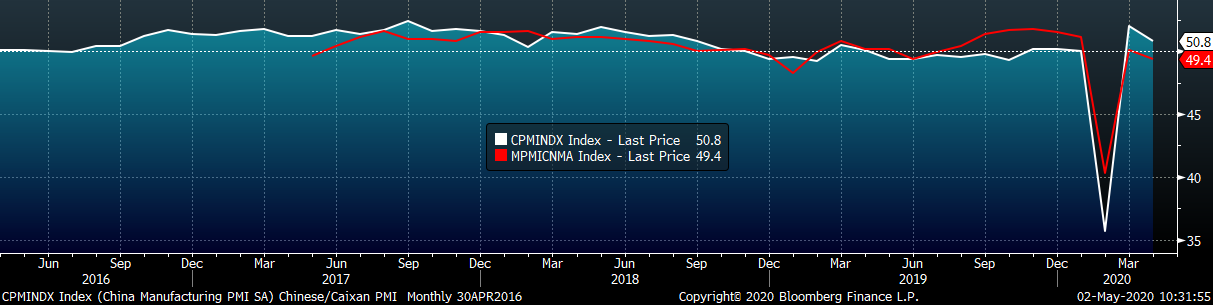
Both China’s official PMI and the Caixan Manufacturing PMI printed slightly lower after last month’s record rebound. As mentioned previously, reports show that China is by and large back to work, but the country is now faced with depressed global demand and fractured supply chains as trading partners start taking steps towards reopening.
The table below breaks down China’s official manufacturing PMI subindexes. Compared to last month, the only subindexes that increased were stocks of finished goods and delivery times. New export orders were down most significantly but remain above February’s record low levels.
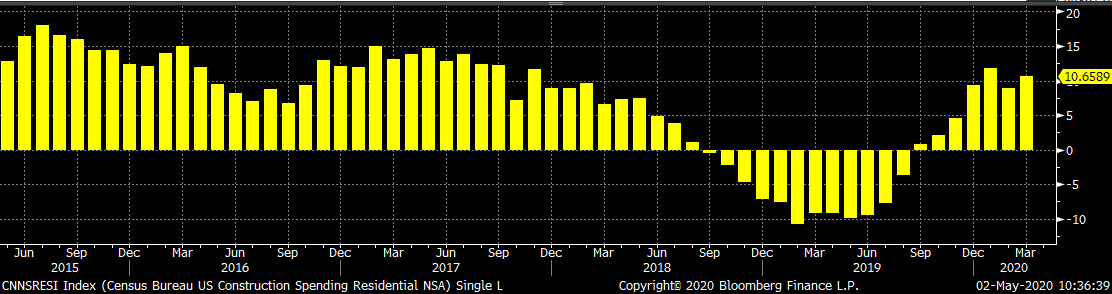
March seasonally adjusted U.S. construction spending was up 0.9% compared to February and up 4.7% compared to last February. Residential Spending was revised higher in January and February, while Non-Residential spending was revised lower over the same period.
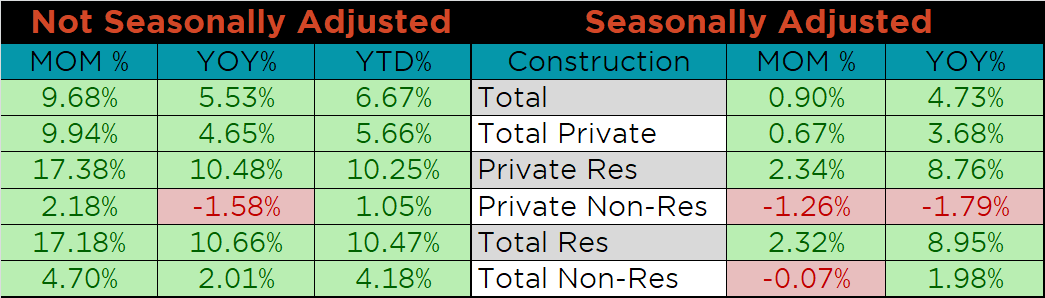
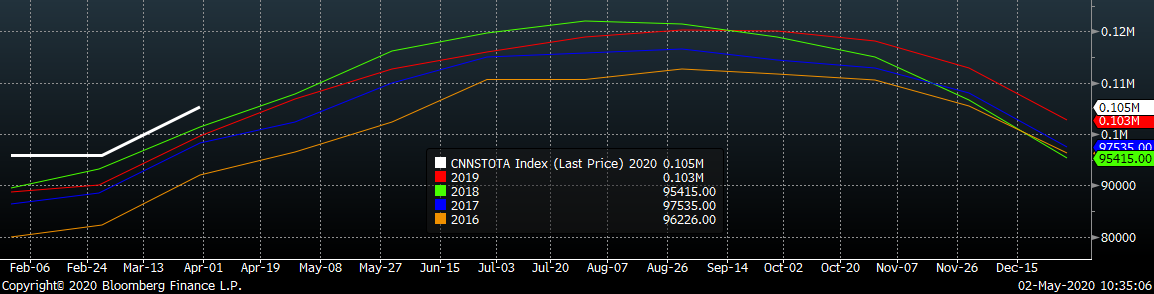
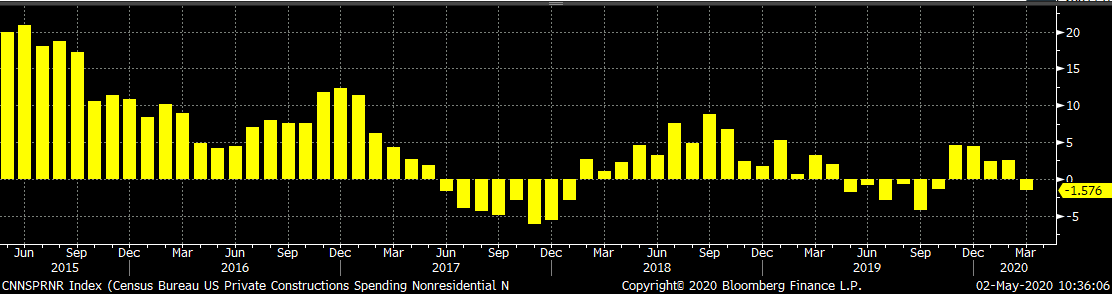
The white line in the chart below represents construction spending in 2020 and compares it to the spending of the previous 4 years. The last two charts show the YoY changes in construction spending. Private non-residential spending turned negative in March, while residential spending remains high compared to last year.
Below are the most pertinent upside and downside price risks:
Upside Risks:
Downside Risks:
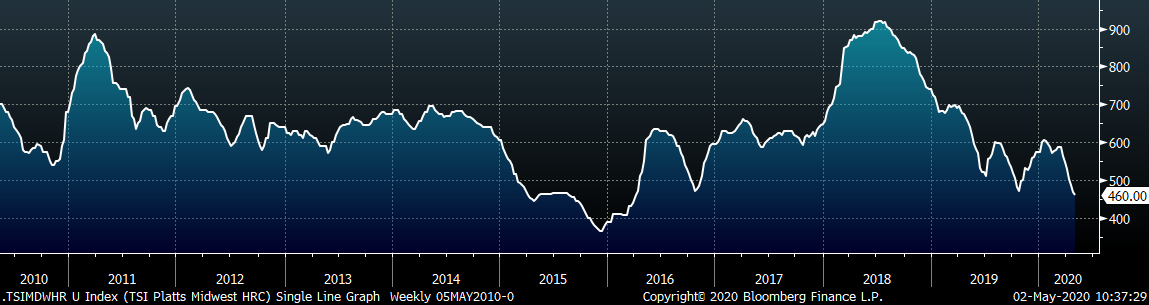
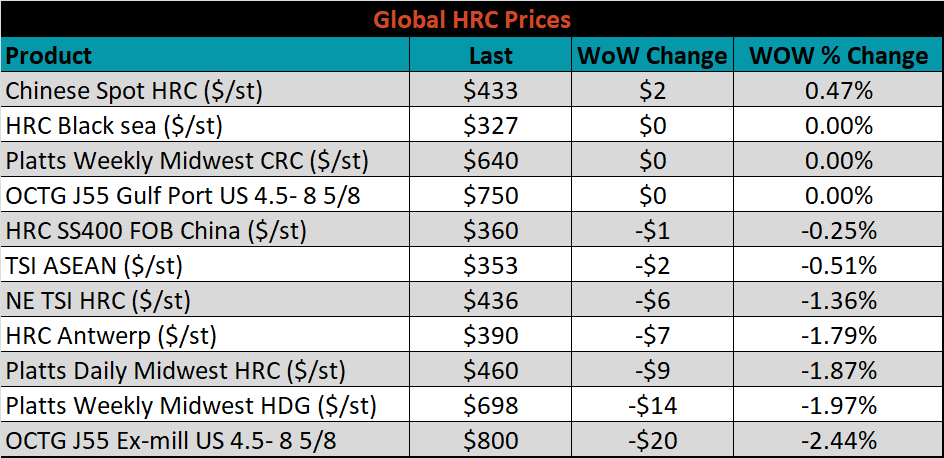
The Platts TSI Daily Midwest HRC Index was down another $8.75 to $460.
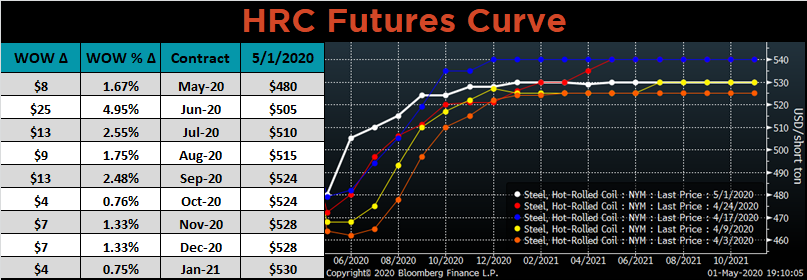
The CME Midwest HRC futures curve is below with last Friday’s settlements in white. The front of the curve shifted higher, while the back was relatively flat.
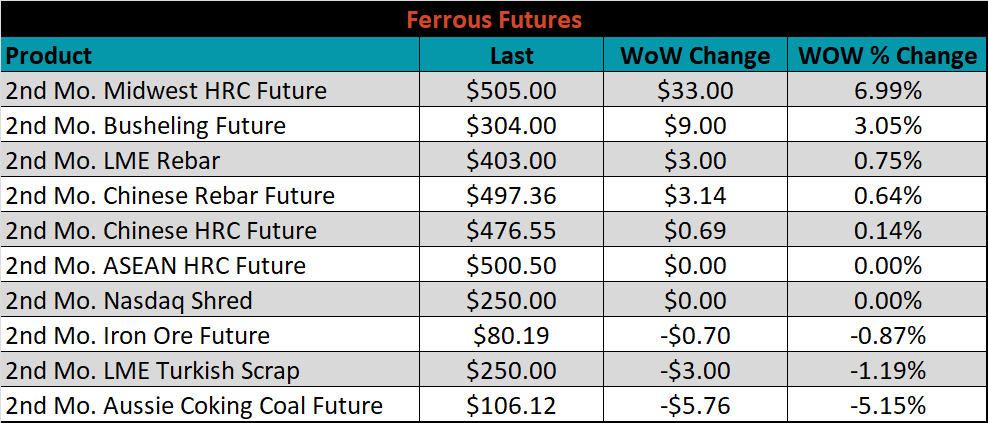
June ferrous futures were mixed. Midwest HRC gained 7%, while Aussie coking coal lost another 5.2%.
The global flat rolled indexes were mixed. The Chinese spot HRC price was up 0.5%, while Platts Midwest HDG was down 2%.
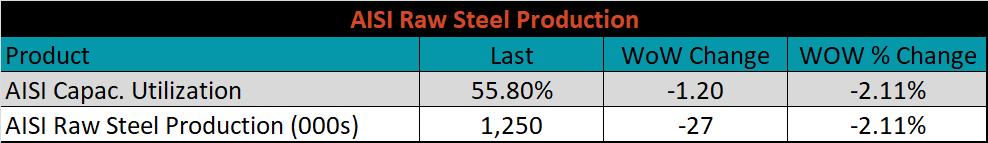
The AISI Capacity Utilization Rate was down 1.2% to 55.8%.
April flat rolled import license data is forecasting a decrease of 65k to 576k MoM.
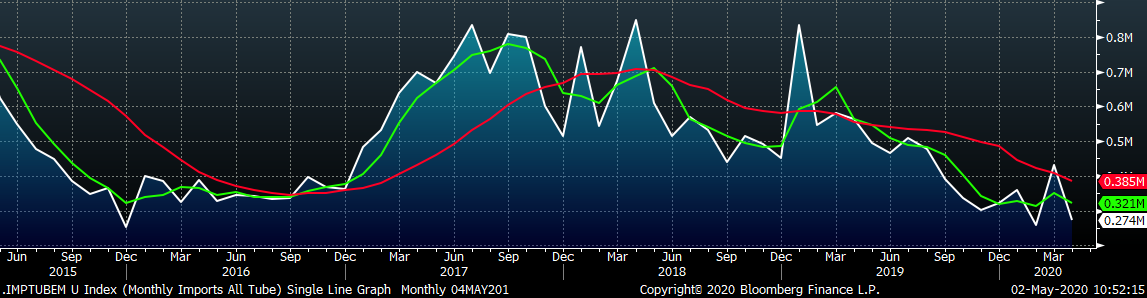
Tube imports license data is forecasting a MoM decrease of 158k to 274k tons in April.
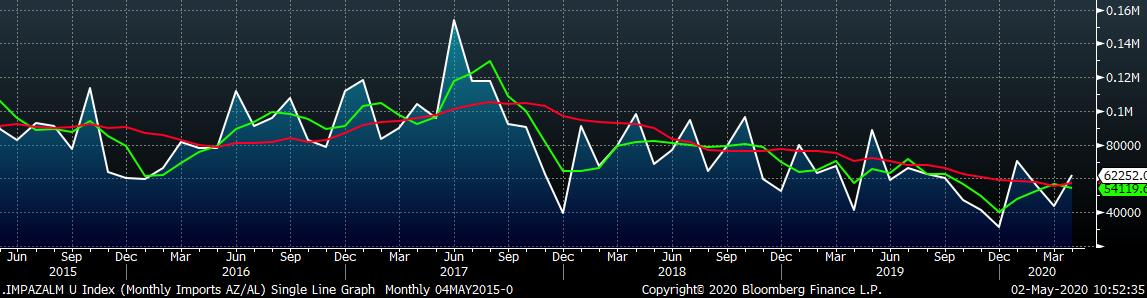
AZ/AL import license data is forecasting an increase of 18k in April to 62k.
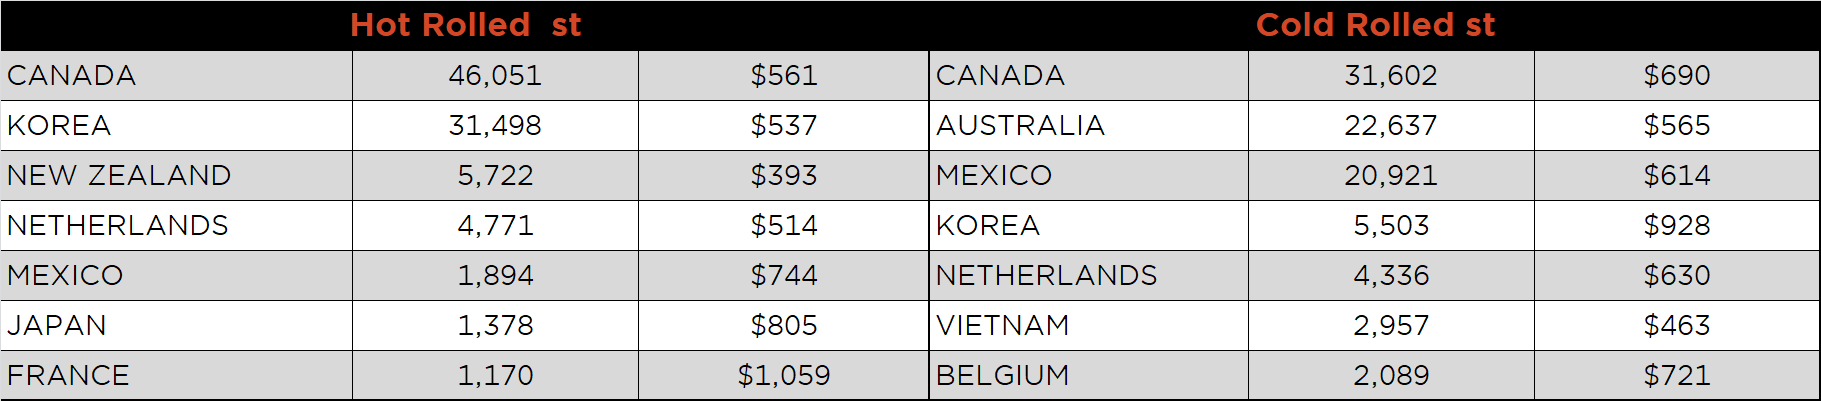
Below is April import license data through April 28, 2020.
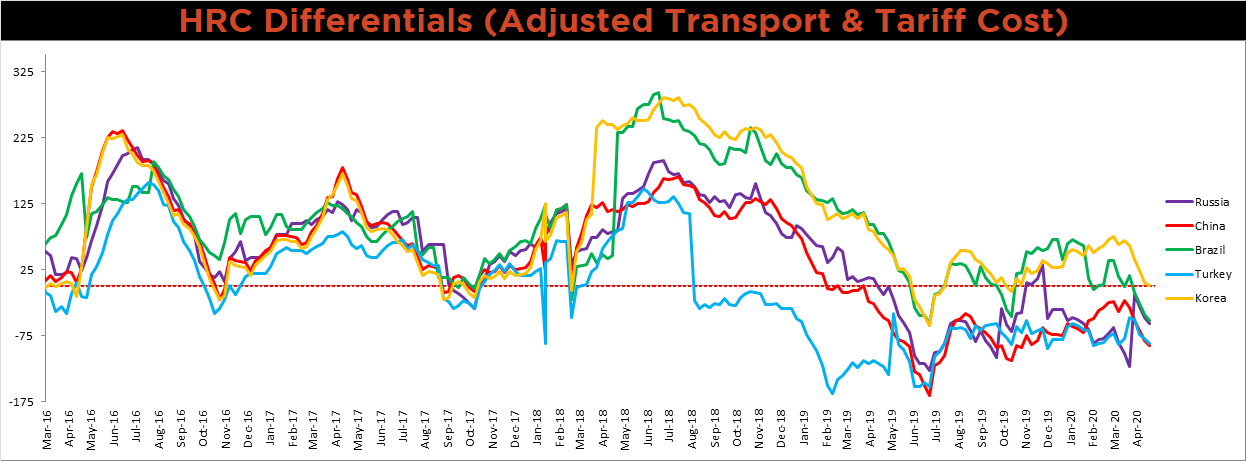
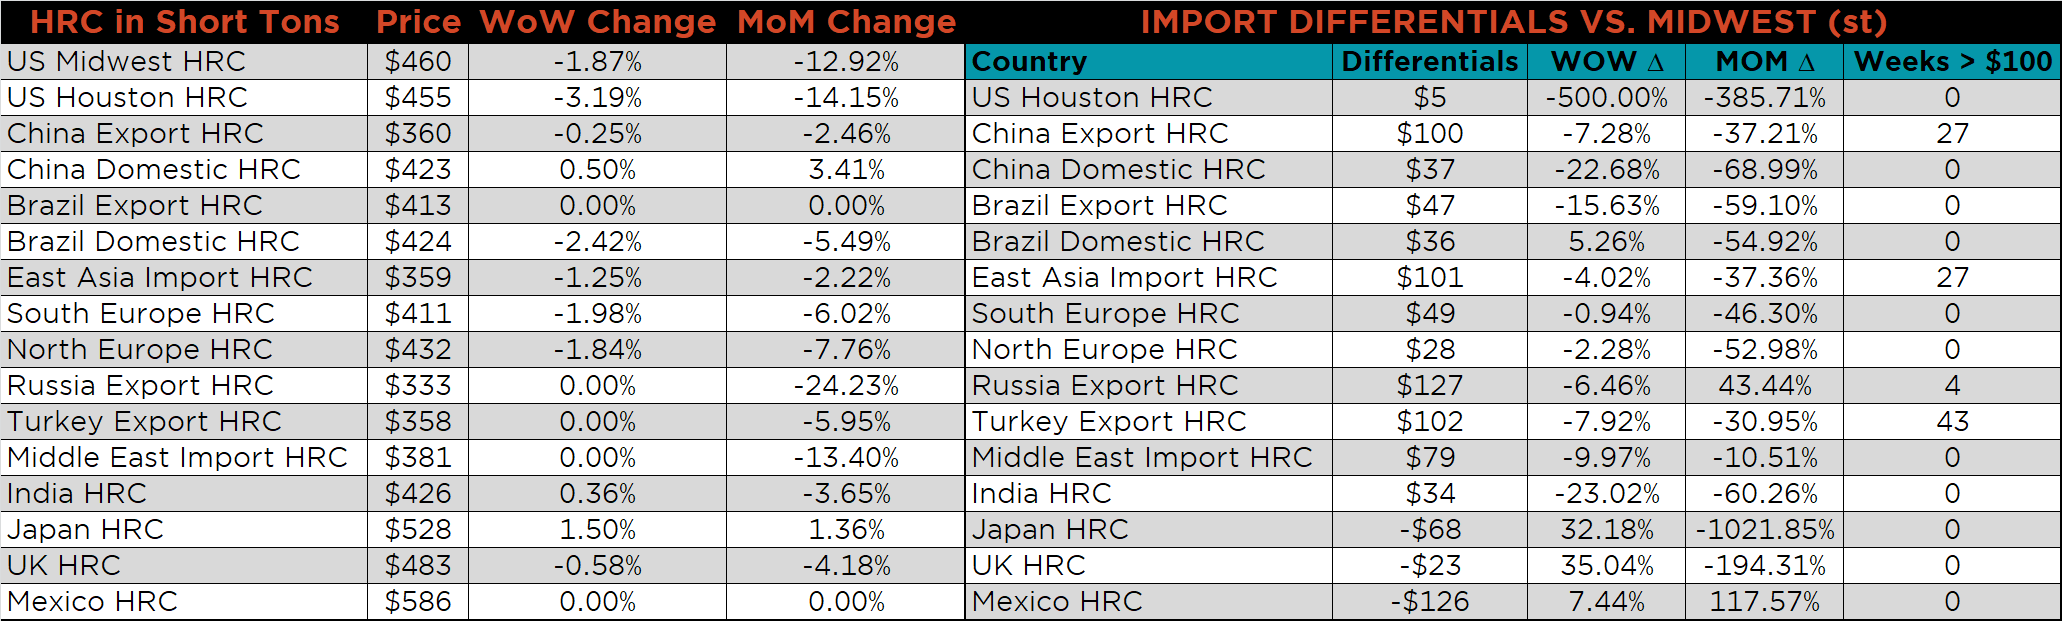
Below is the Midwest HRC price vs. each listed country’s export price using pricing from SBB Platts. We have adjusted each export price to include any tariff or transportation cost to get a comparable delivered price. All five countries differentials decreased again for the fourth week in a row as the U.S. domestic price continues to fall.
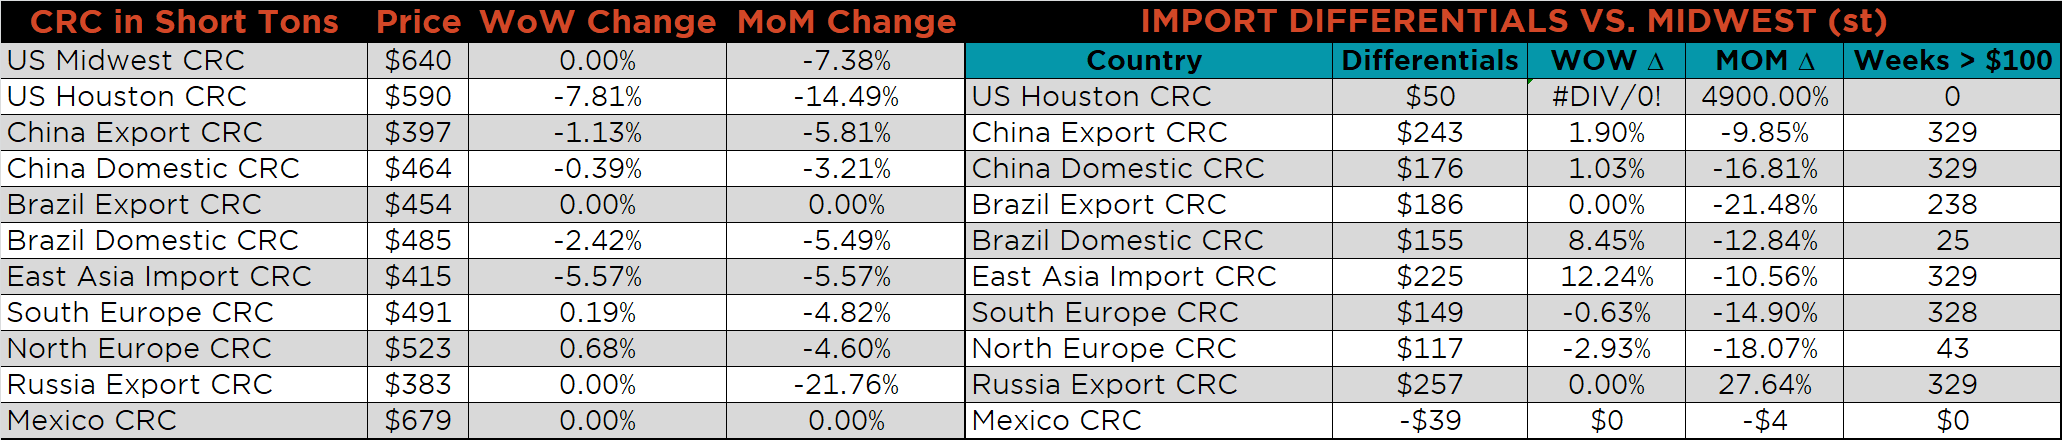
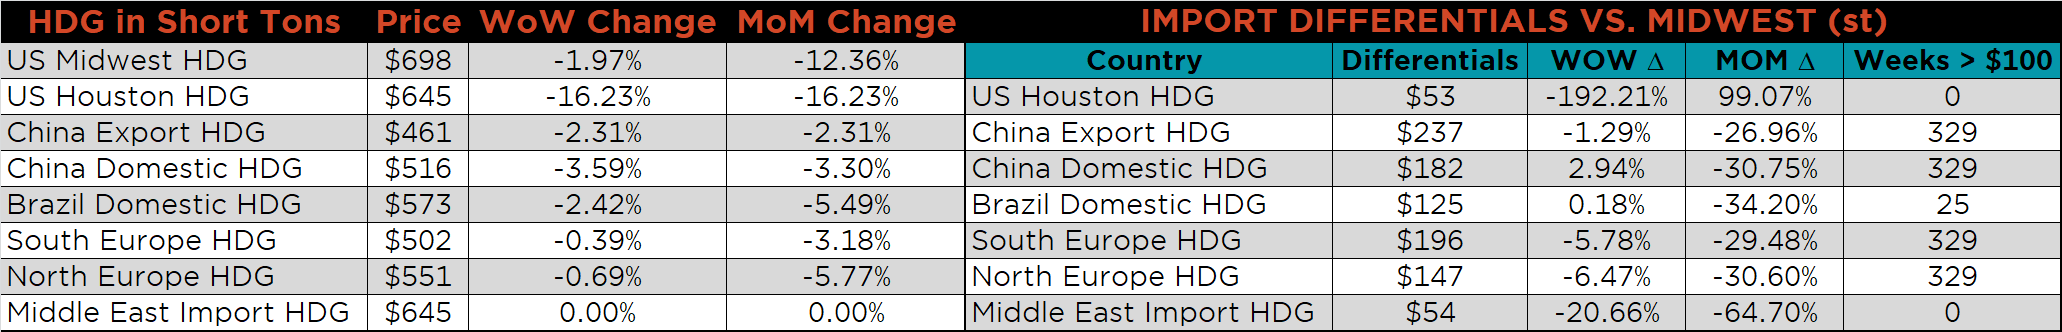
SBB Platt’s HRC, CRC and HDG pricing is below. The Midwest HDG and HRC prices were down 2% and 1.9%, respectively, while the CRC price was unchanged. Globally, the Chinese export HDG and CRC prices were down 2.3% and 1.1%, respectively.
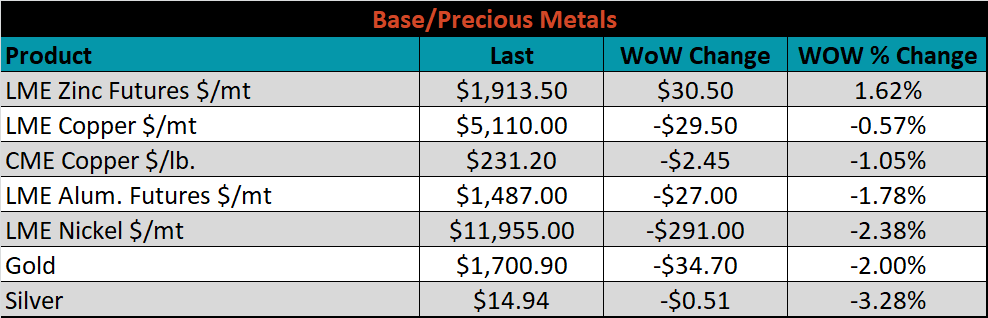
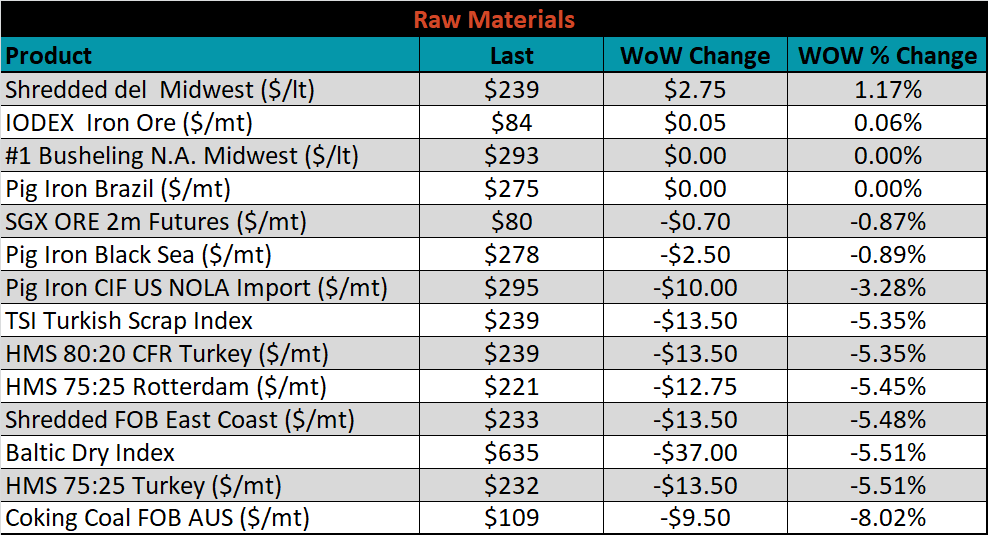
Raw material prices were mixed. Midwest shredded was up 1.2%, while Australian coking coal was down 8%.
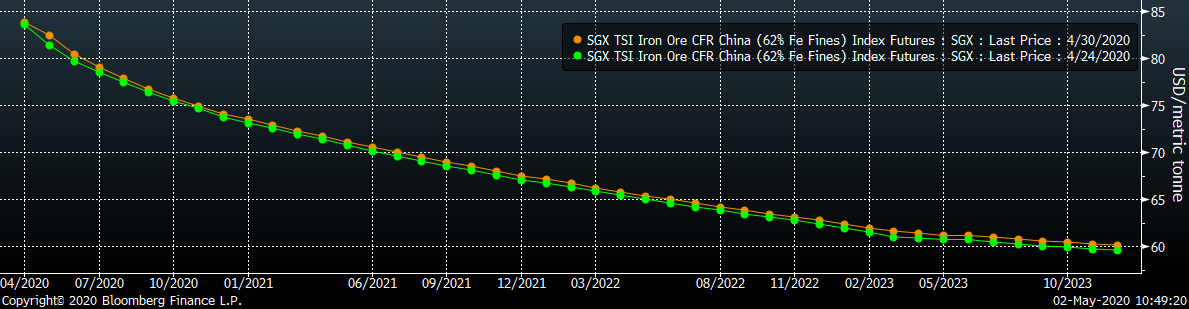
Below is the iron ore future curve with Friday’s settlments in orange, and the prior week’s settlements in green. The curve was relatively flat, but slightly higher in the front.
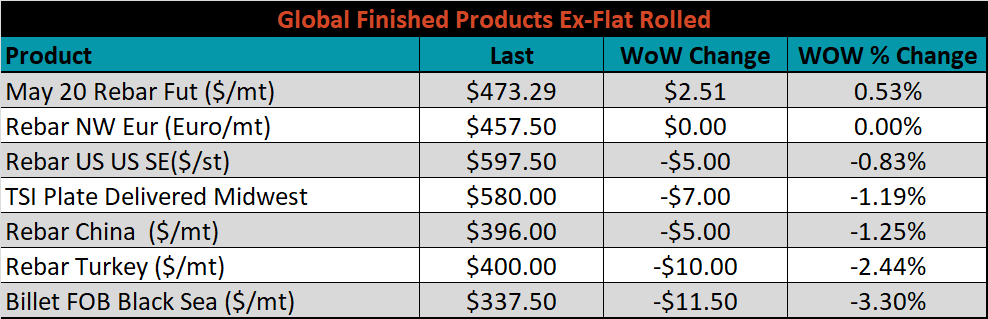
The ex-flat rolled prices are listed below.

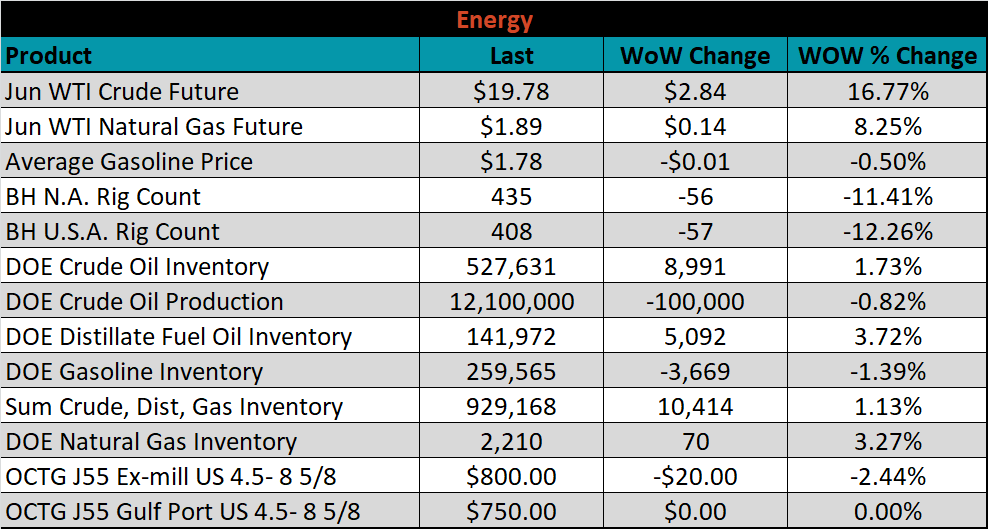
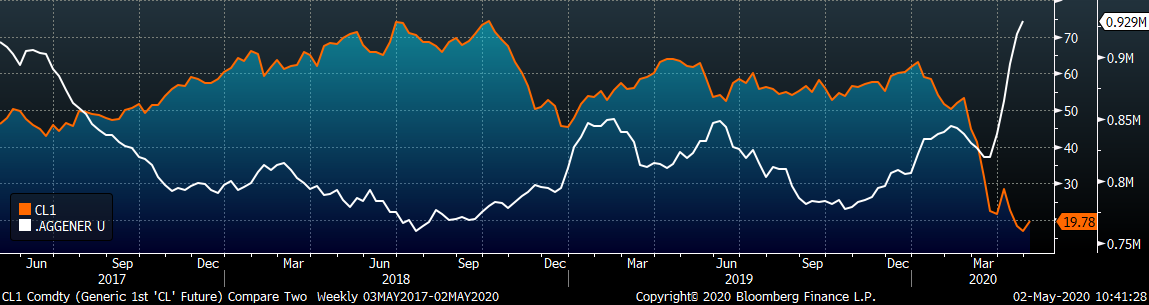
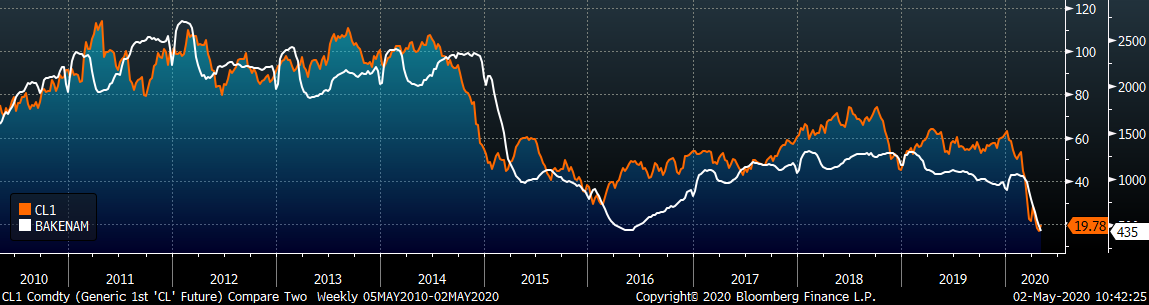
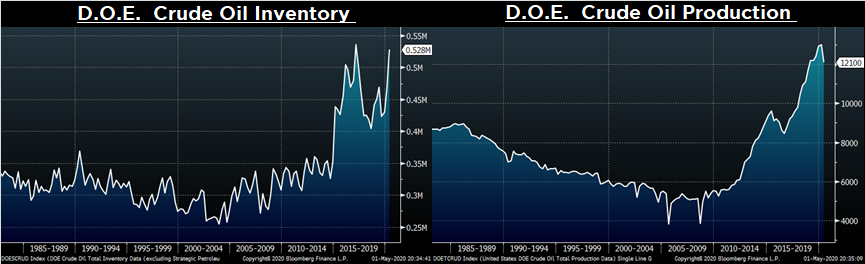
Last week, the June WTI crude oil future gained $2.84 or 16.8% to $19.78/bbl. The aggregate inventory level was up 1.1% and crude oil production was down to 12.1m bbl/day. The Baker Hughes North American rig count was down another 56 rigs and the U.S. rig count was down 57 rigs.
The list below details some upside and downside risks relevant to the steel industry. The orange ones are occurring or look to be highly likely. The upside risks look to be in control.
Upside Risks:
Downside Risks: