Content
-
Weekly Highlights
- Market Commentary
- Durable Goods
- Risks


Last week’s report began to look at where the current price downtrend might find a bottom. While we do not believe prices have reached the bottom yet, we will continue to look for indicators in the market that signal where it may be. One indicator that we track and have been focused on recently is the China export price differential. Each week we include a section in this report (below) analyzing the Midwest price differential vs. export prices from around the world. This week in that section, we have updated the analysis to include tariff and transportation costs in the export price to better compare to the domestic price.
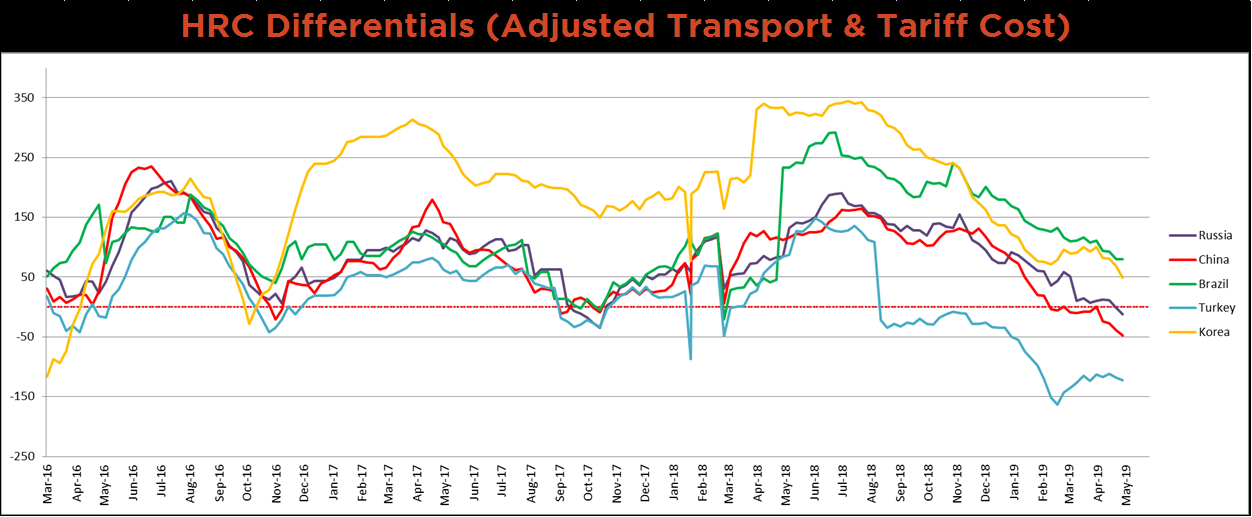
The chart below shows the Platts TSI Daily Midwest HRC Index minus the Platts China export price, adjusted for transportation costs but not tariff costs. One downside risk to domestic pricing (although not presently likely) is the removal of Section 232 tariffs, so not including tariff costs in the delivered price accounts for this risk and allows for a more accurate historical relative comparison. The current price differential is just under $100/st. The orange shaded region on the right side of the chart is a one month forward price projection, assuming the China export price remains the same, and the Midwest price falls to $580.
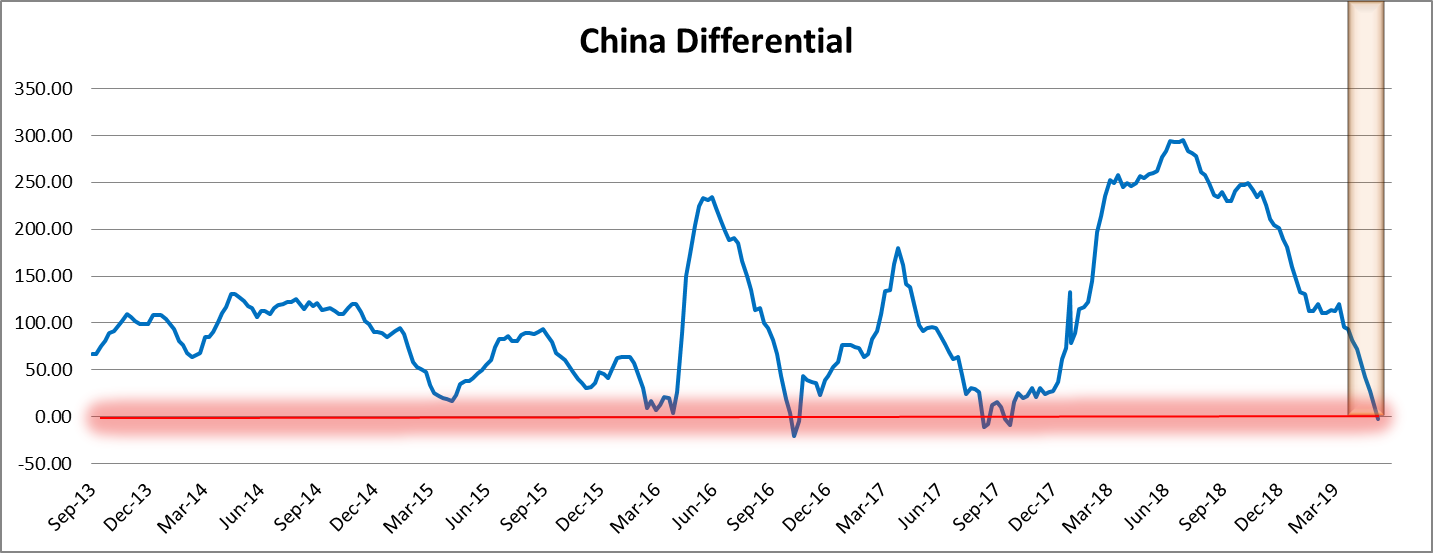
A Midwest price near $580 is at parity with the delivered China export price, signaled by the “zero level” in red above. Historically, this level has acted as a low point for the differential between the two prices. The chart below highlights when this “zero level” had been reached in the past, as well as the subsequent domestic price rally.
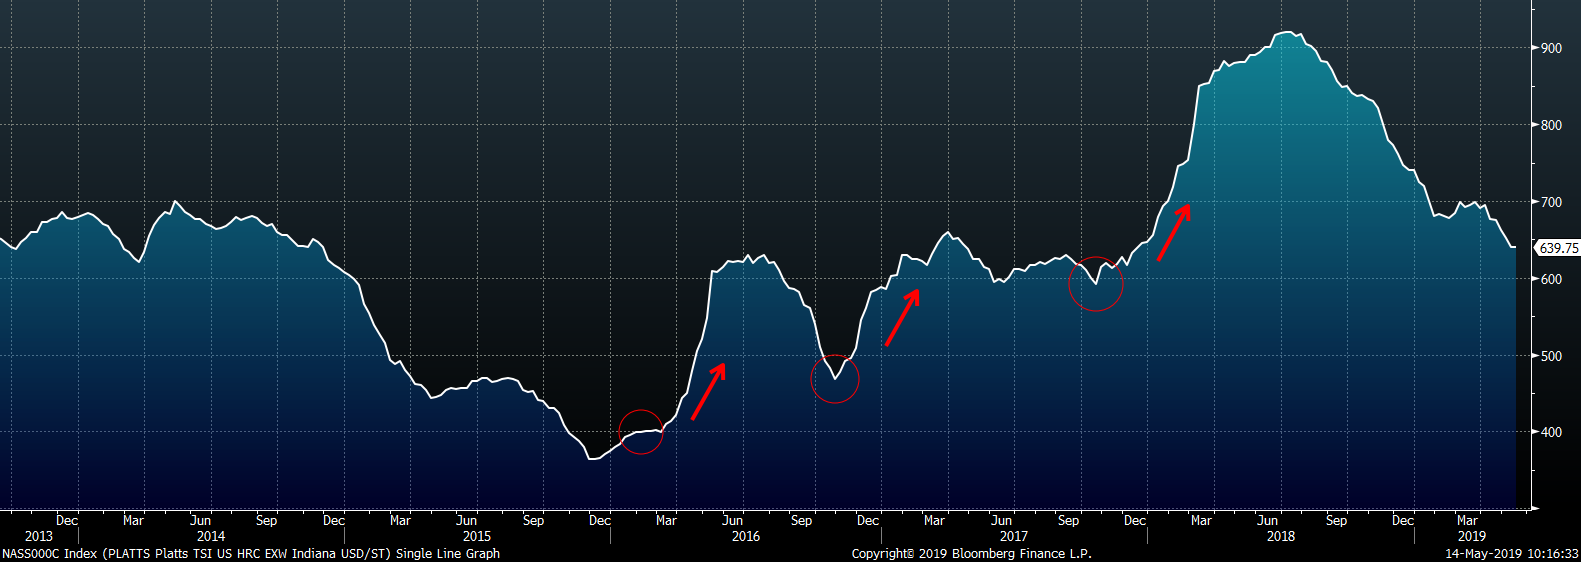
Therefore, a $580 domestic HRC price could act as a bottom based on the current China export price differential. However, a move lower in the China or world pricing would imply that this bottom is lower. Steel buyers need to be prepared in order to take advantage of likely lower prices ahead. Now is the time to start thinking about attractive price levels to lock in for an extended period because the price bottom may not last long enough to secure all of the desired tonnage.
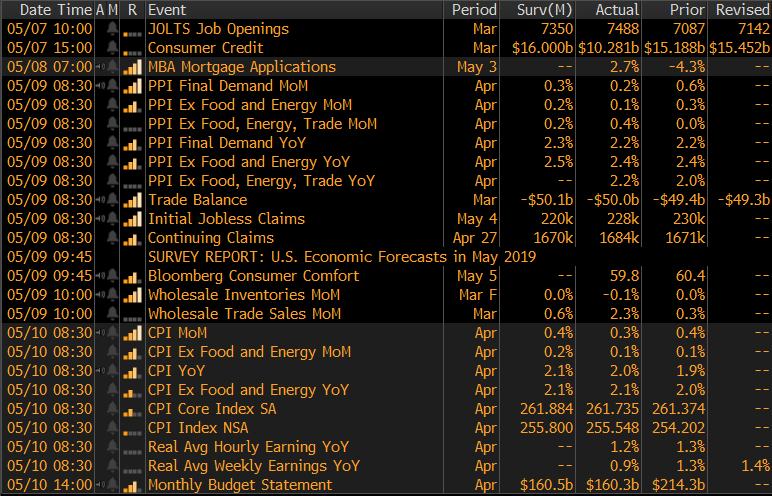
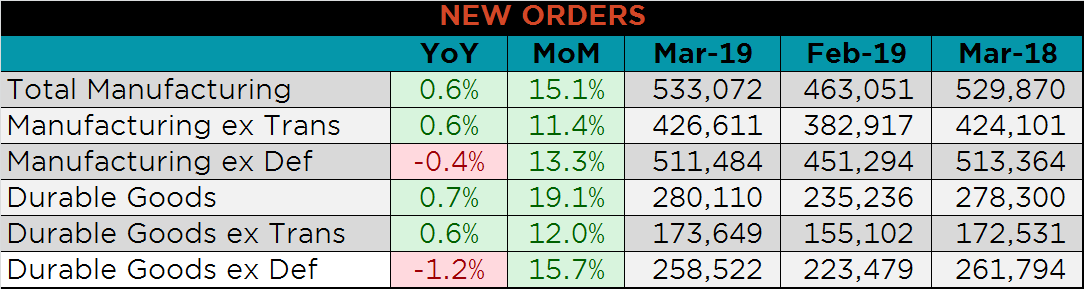
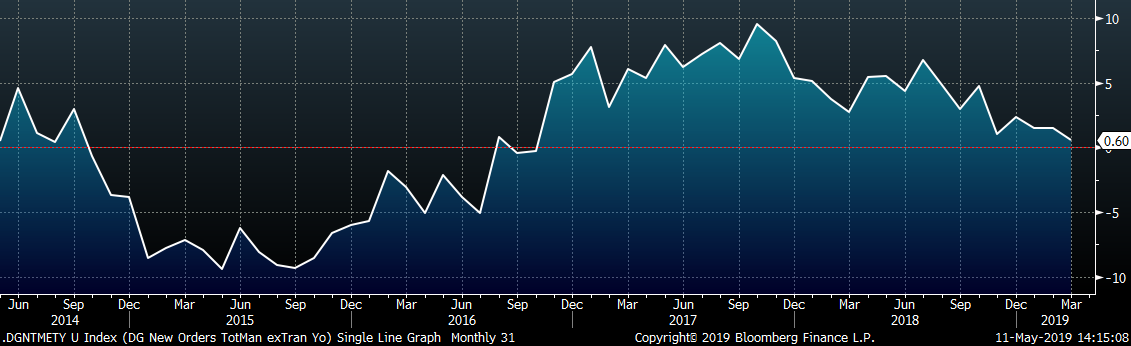
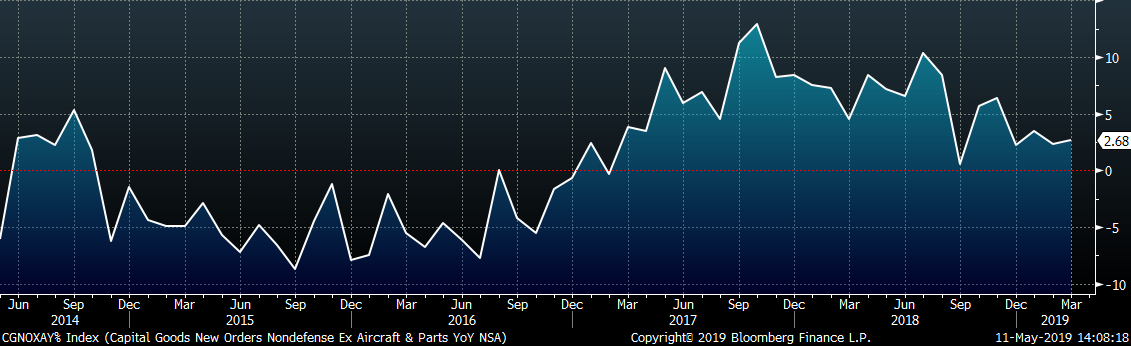
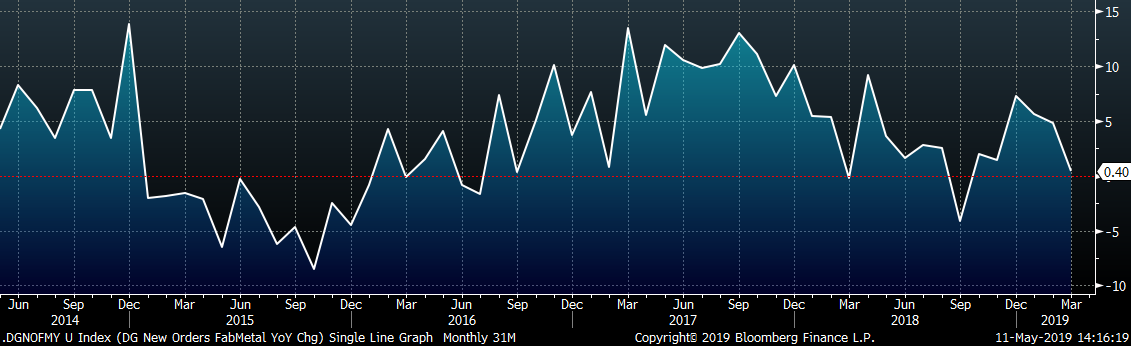
Below are final March new orders from the Durable Goods report. New orders grew YoY in most categories, excluding defense, reflecting stable growth on top of last year’s high levels. The demand destruction that many projected at the end of 2018 is not surfacing in the data.
Below are the most pertinent upside and downside price risks:
Upside Risks:
Downside Risks:
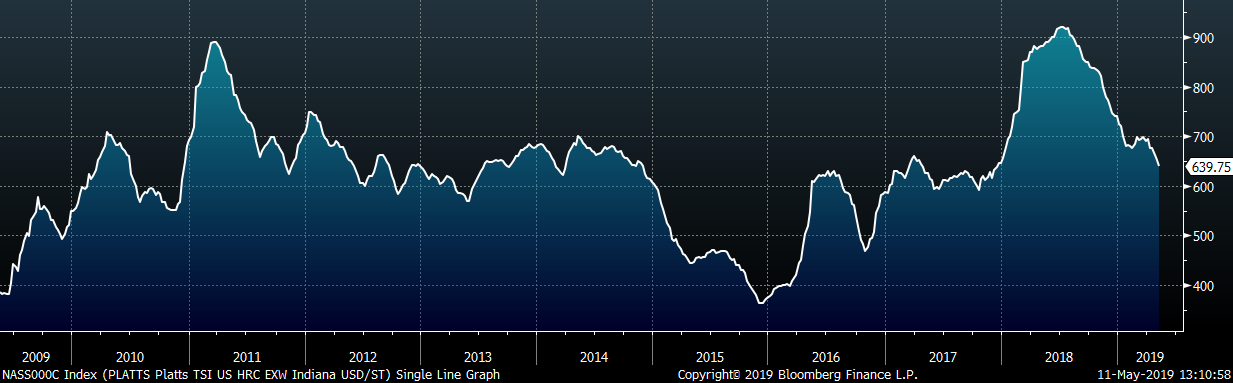
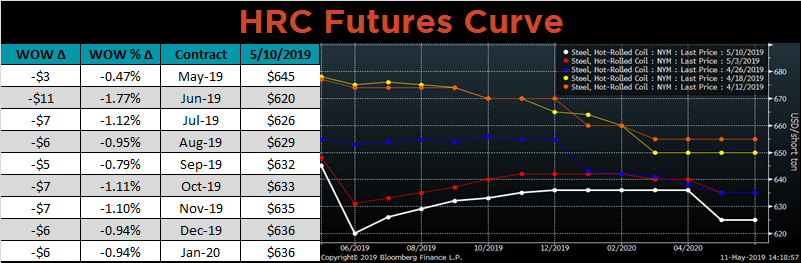
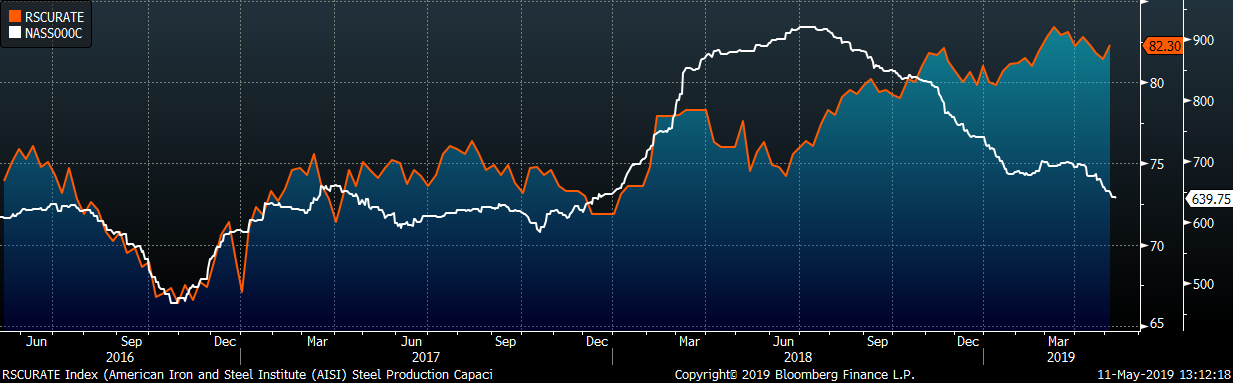
The Platts TSI Daily Midwest HRC Index was down $12.25 to $639.75.
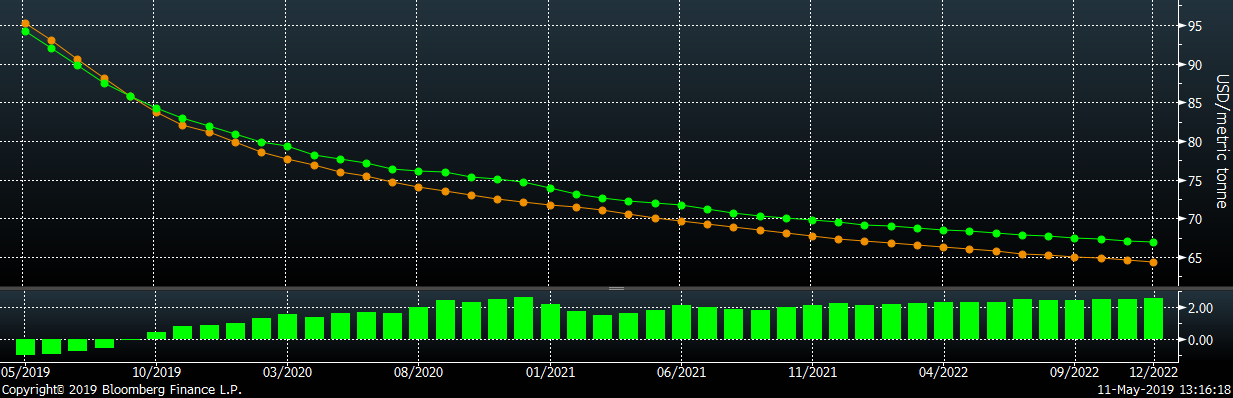
The CME Midwest HRC futures curve is shown below with last Friday’s settlements in white. The entire curve shifted lower, and moved further into contango.
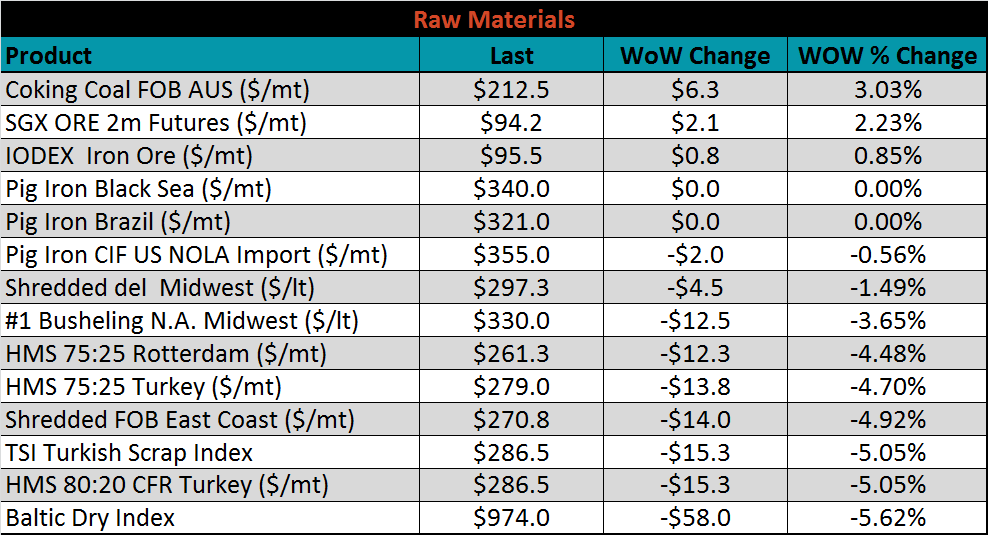
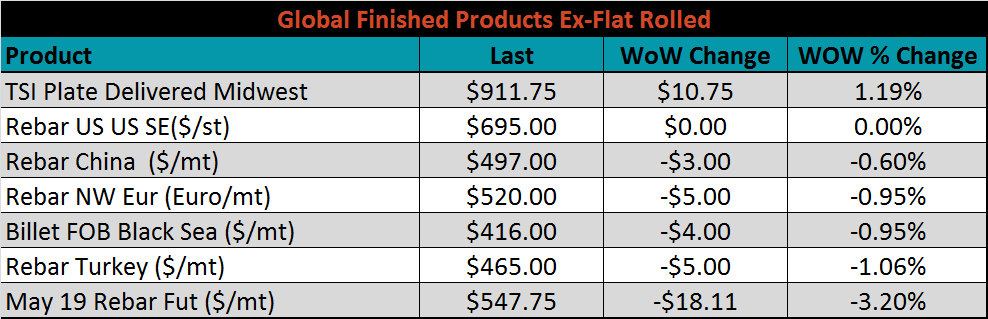
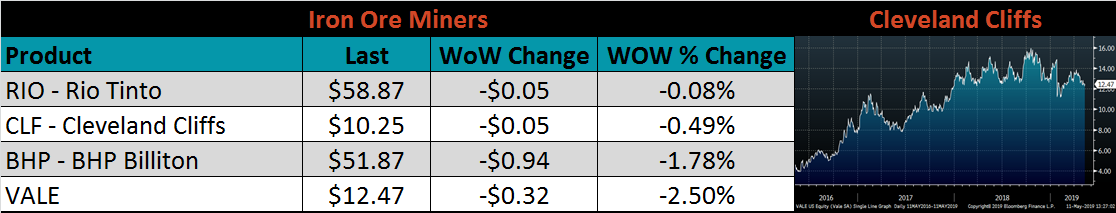
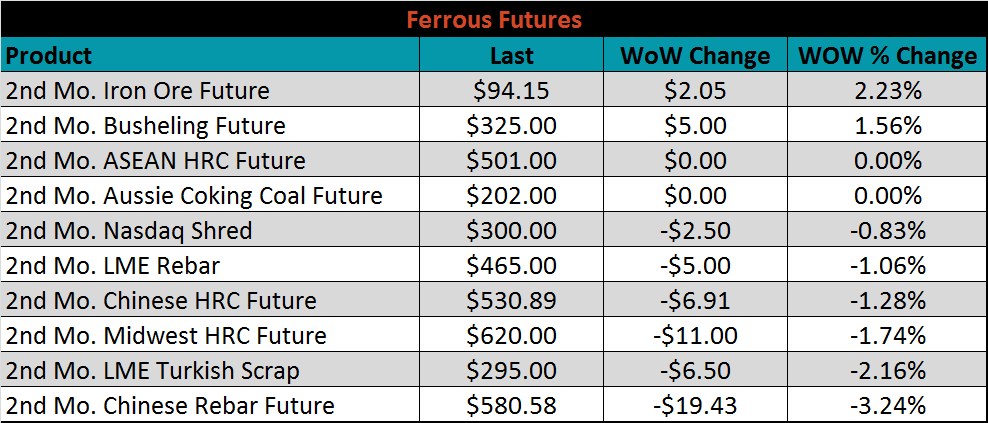
June ferrous futures were mostly lower. The Chinese rebar future lost 3.2%, while the iron ore future gained 2.2%.
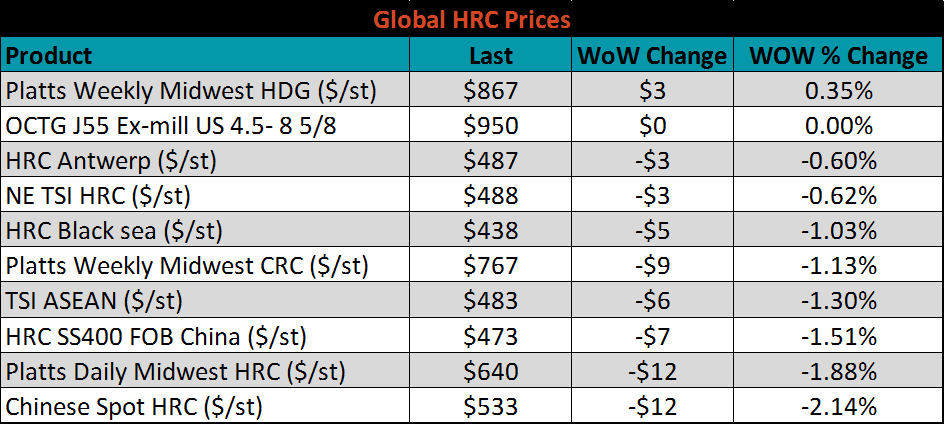
The global flat rolled indexes were mostly lower. Platts Midwest HDG was up slightly 0.4%, while Chinese spot fell 2.1%.
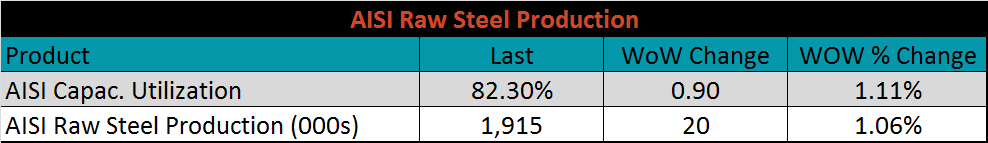
The AISI Capacity Utilization Rate was up 0.9 points to 82.3%. The Trump administration’s goal of 80% Capacity Utilization Rate has held since October 2018, but could be in jeopardy from reduced production at lower prices.
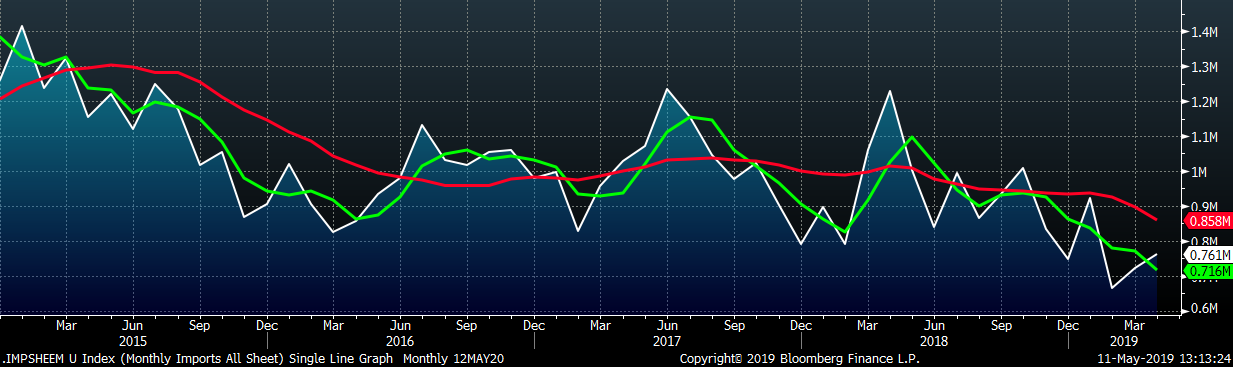
April flat rolled import license data is forecasting an increase to 761k, up 39k MoM.
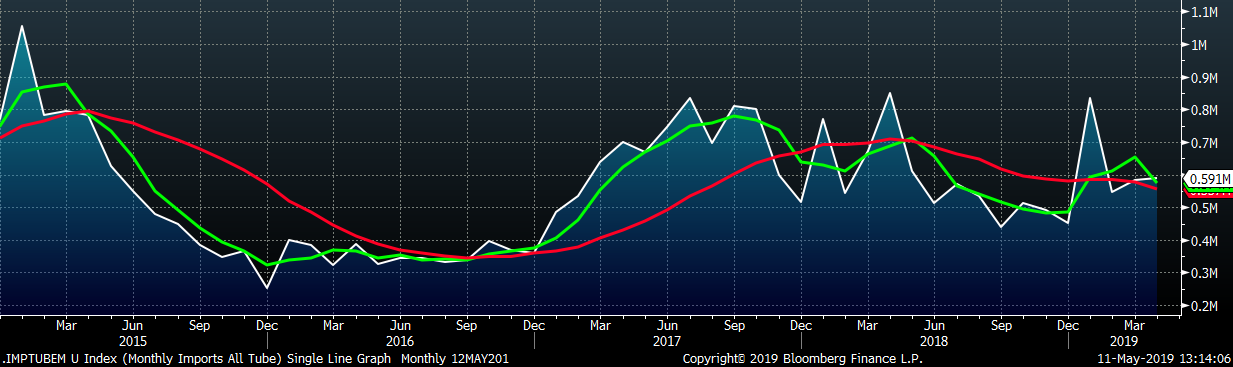
April tube import license data is forecasting a MoM increase of 8k to 591k tons.
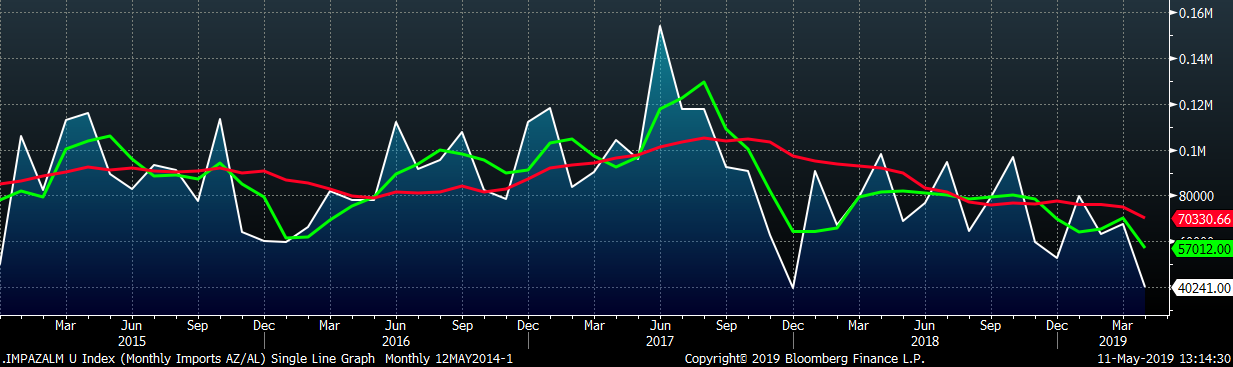
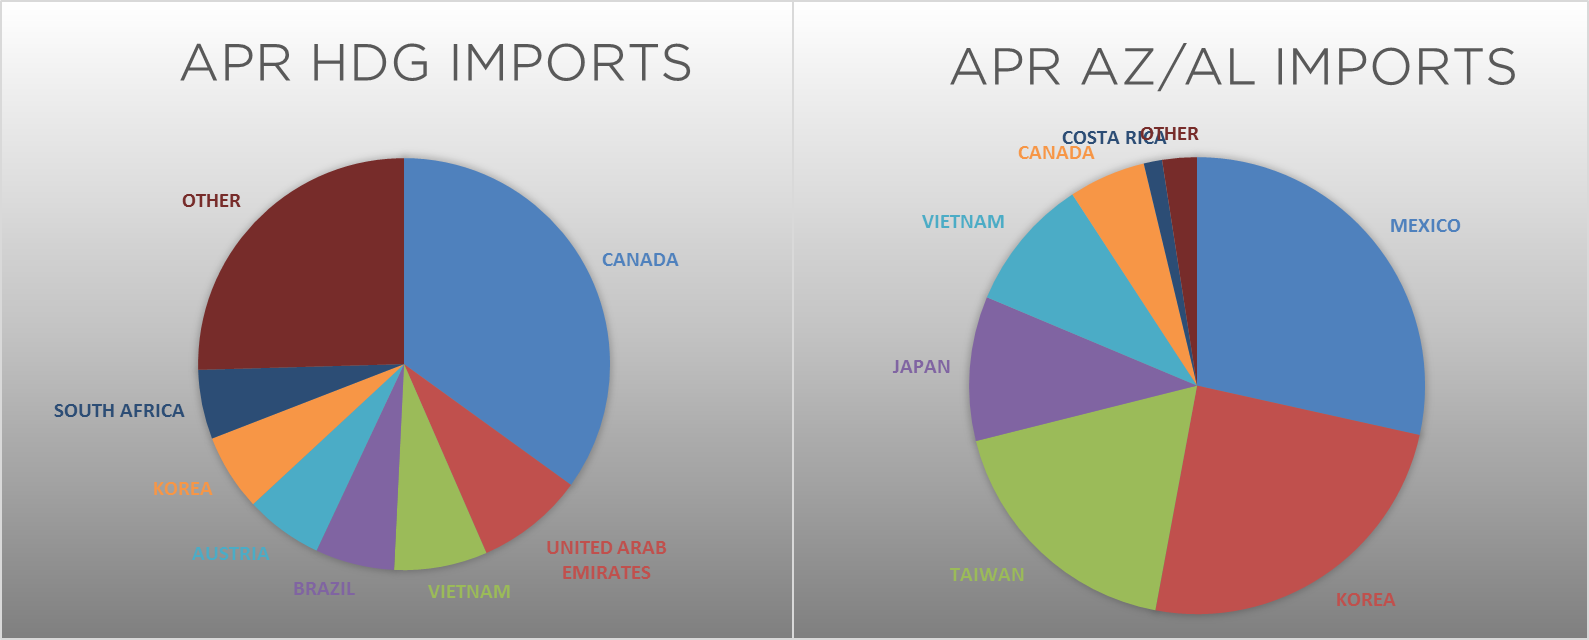
AZ/AL import licenses forecast a decrease of 27k MoM to 40k in April, the lowest monthly level since December 2017.
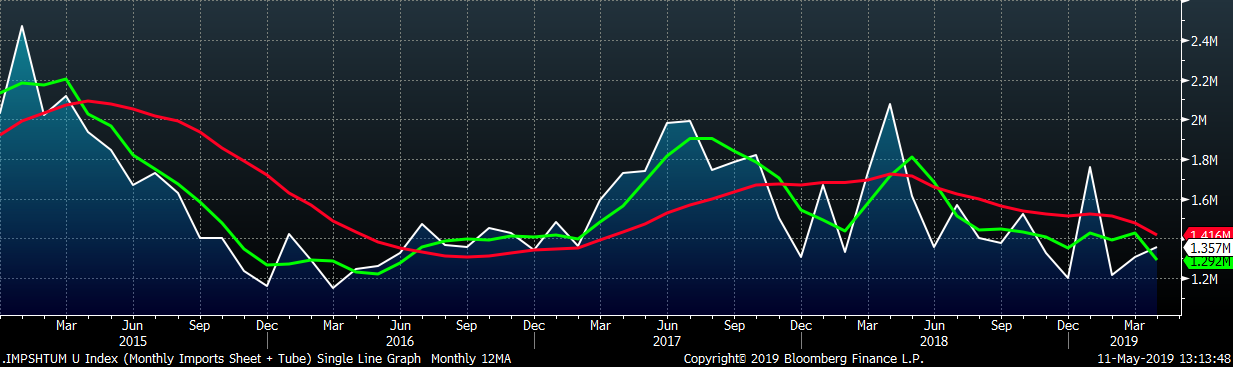
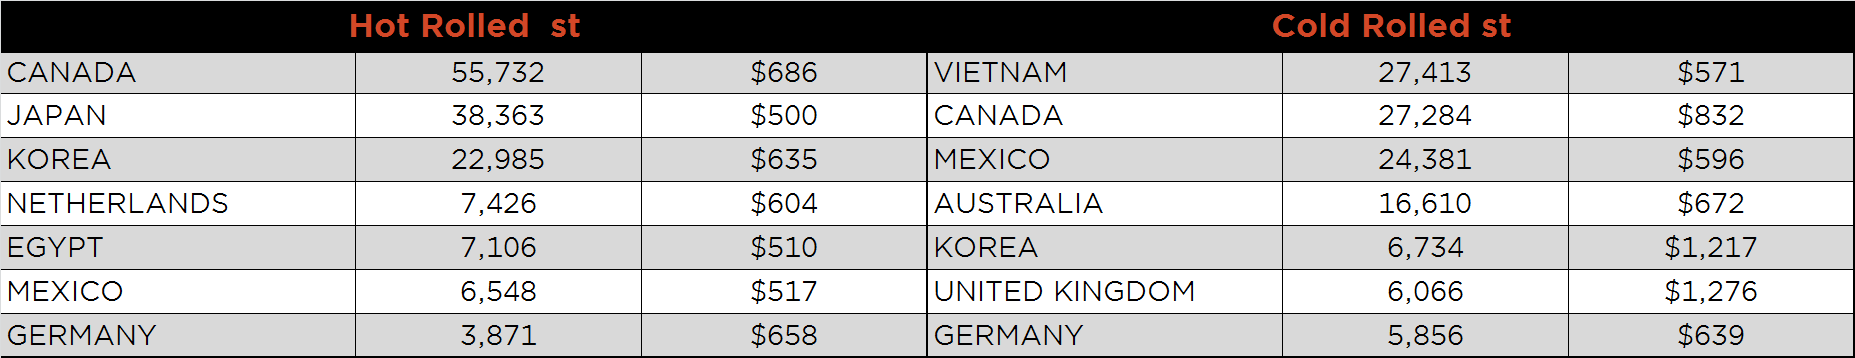
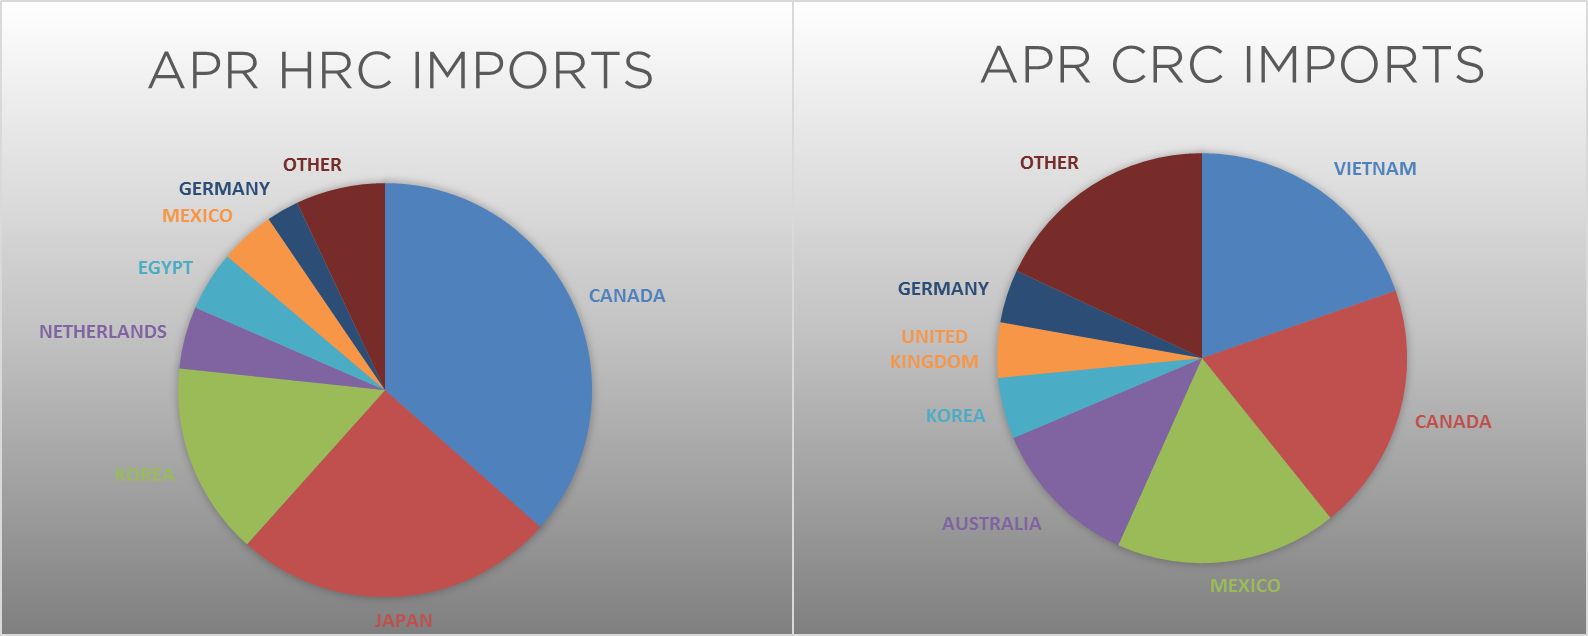
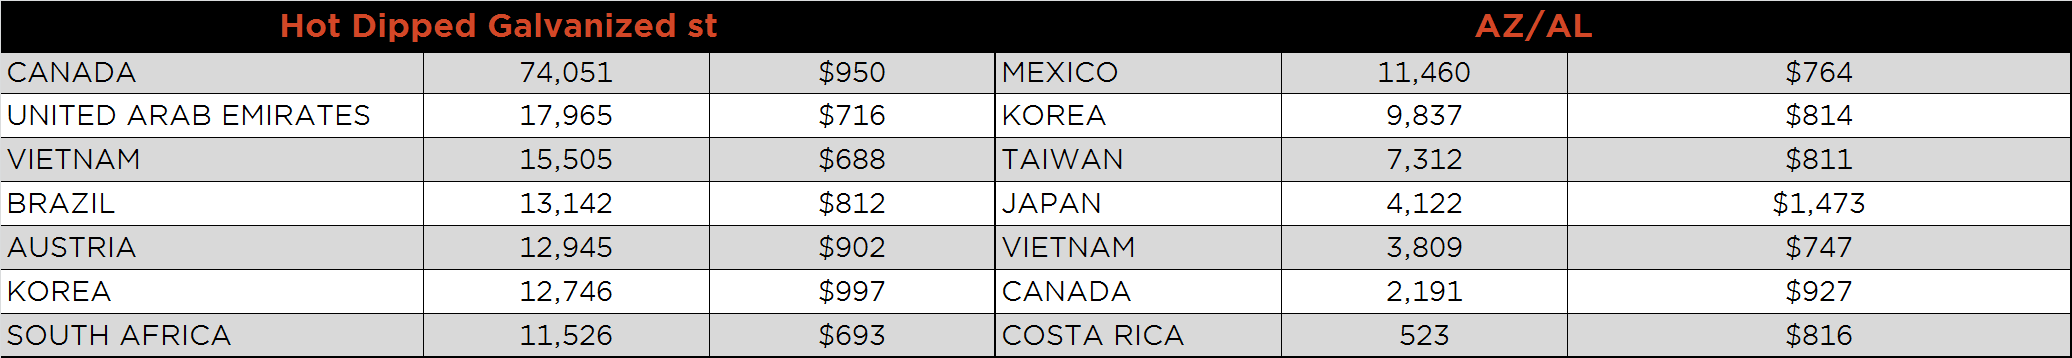
Below is April import license data through May 7, 2019.
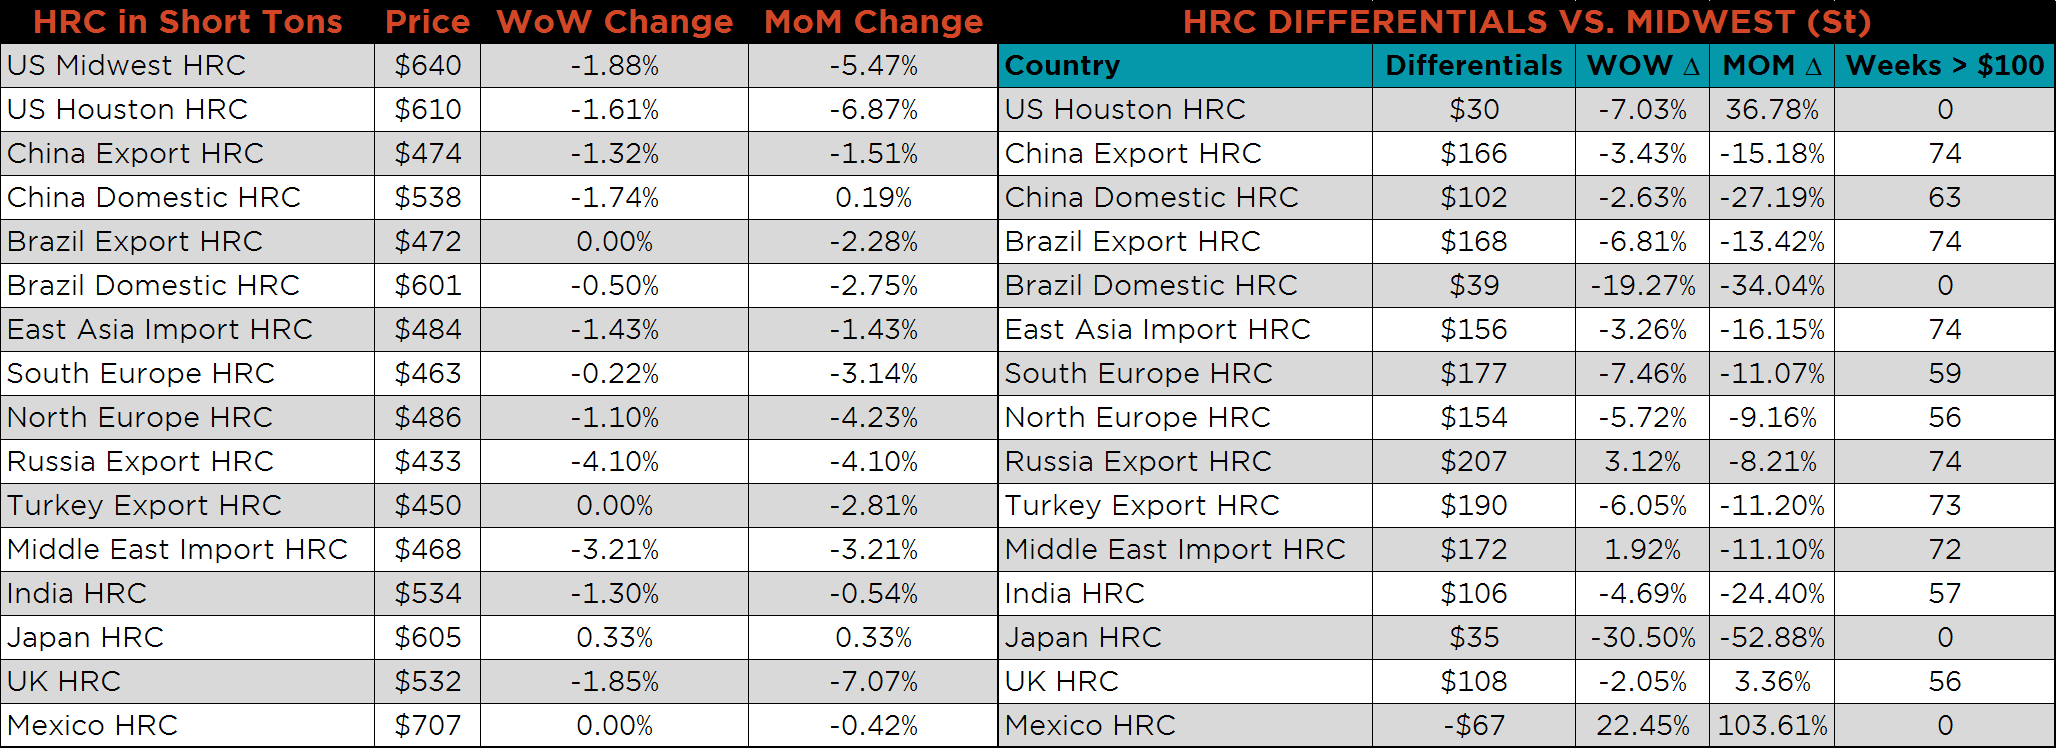
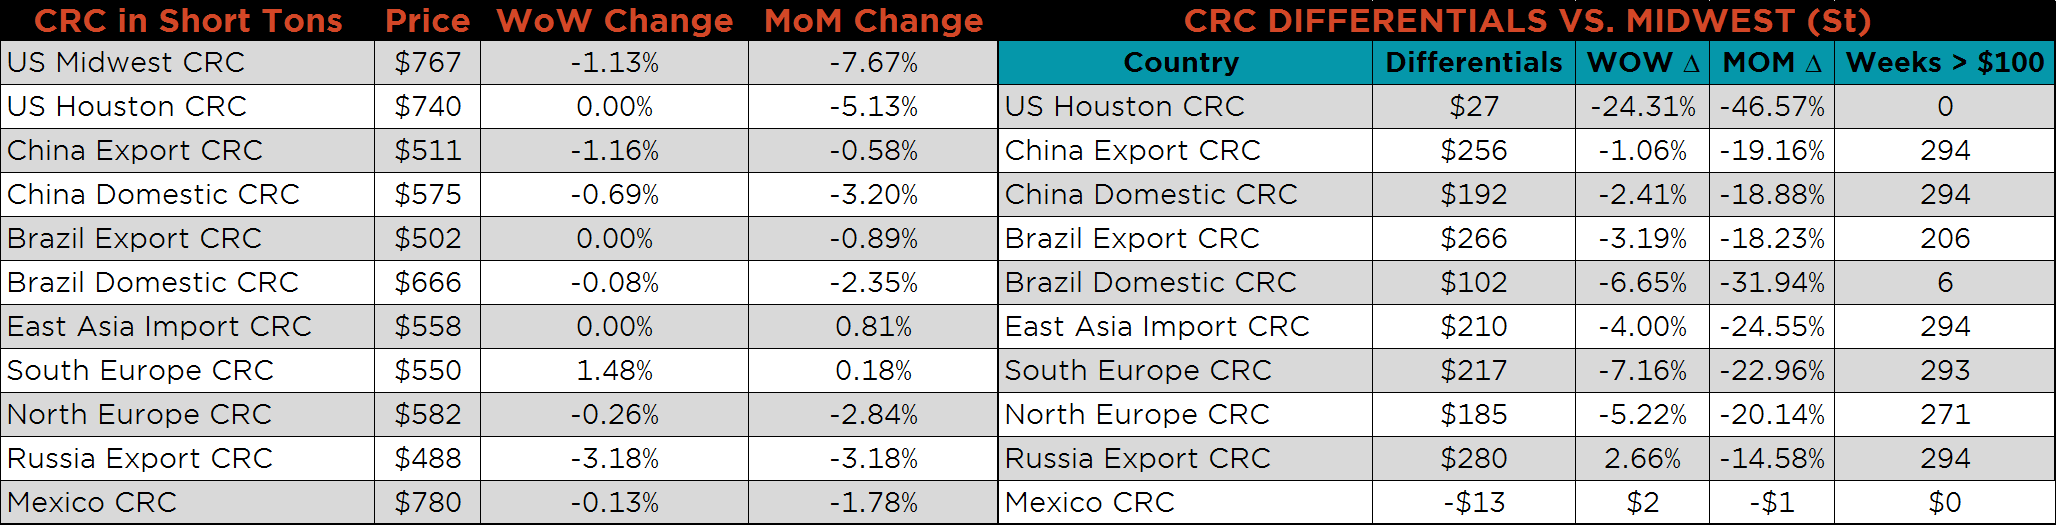
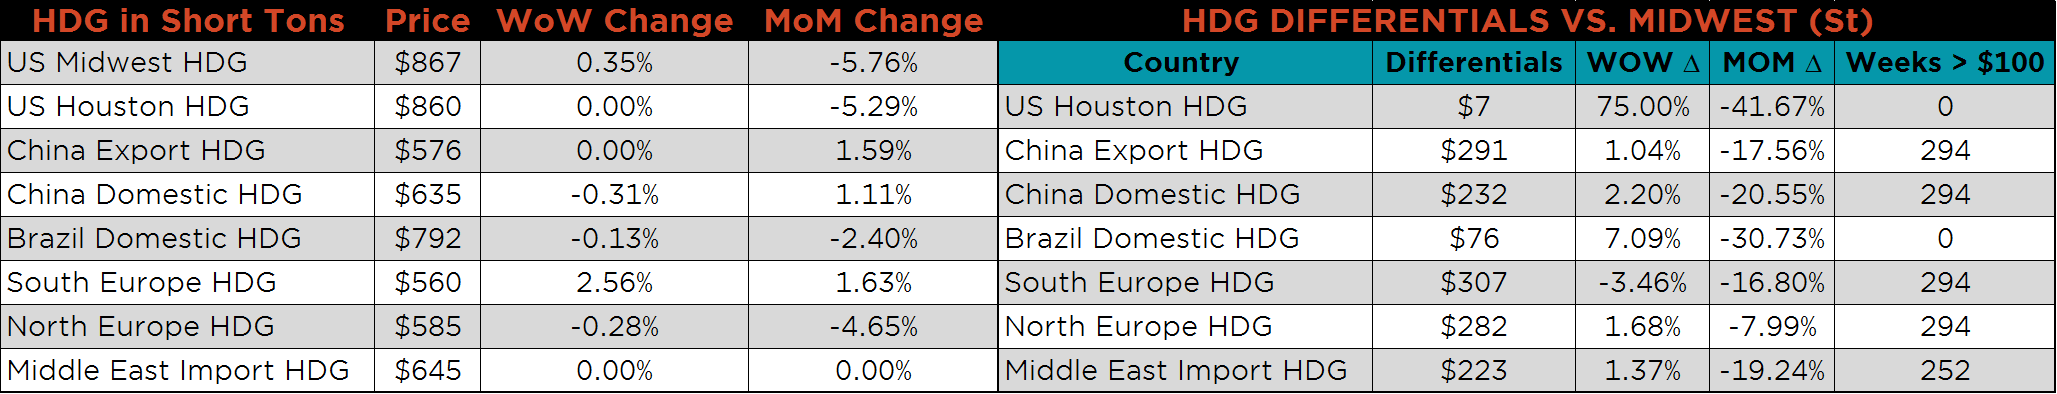
Below is HRC Midwest vs. each listed country’s export price differential using pricing from SBB Platts. We have adjusted each export price to include any tariff or transportation cost to get a comparable delivered price. All of the differentials continued to move lower, and they are approaching a zero differential level that has historically been the bottom for both differentials and domestic prices.
SBB Platt’s HRC, CRC and HDG pricing is below. Midwest HRC and CRC prices were lower on the week, 1.9% and 1.3%, respectively, while the HDG price was slightly higher. The Russian CRC and HRC were both down 4.1% and 3.2%, respectively while Middle East HRC Import price was down 3.2%.

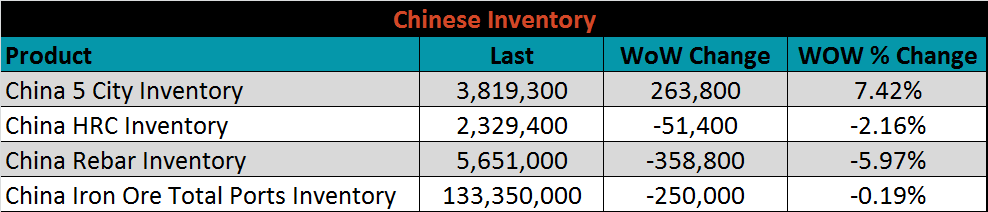
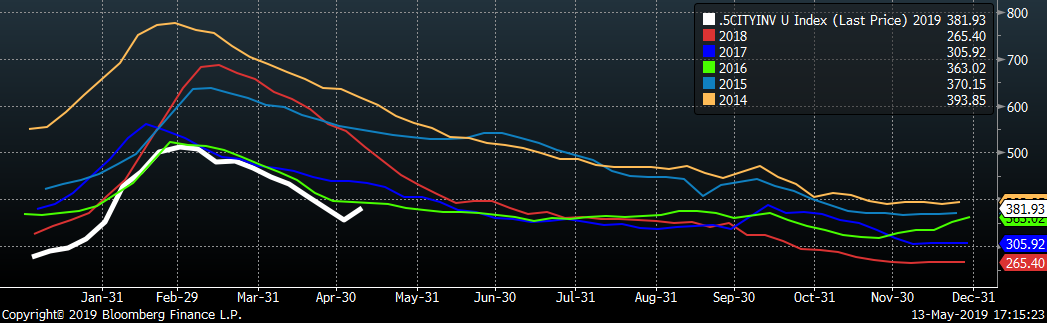
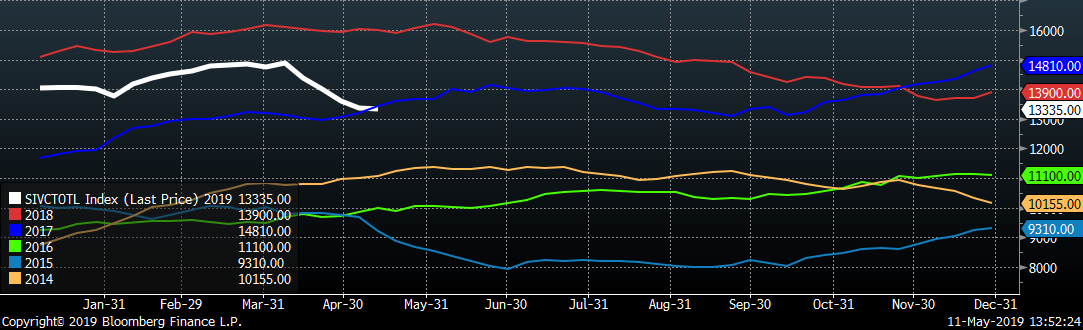
Below are inventory levels for Chinese finished steel products and iron ore. Elevated spot iron ore prices have led to the recent trend in lower total ports inventory, as steel producers look to diminish existing inventory before paying the higher prices. The 5 City inventory rose 7.4% last week, but remains at the lowest level over the past 5 years.
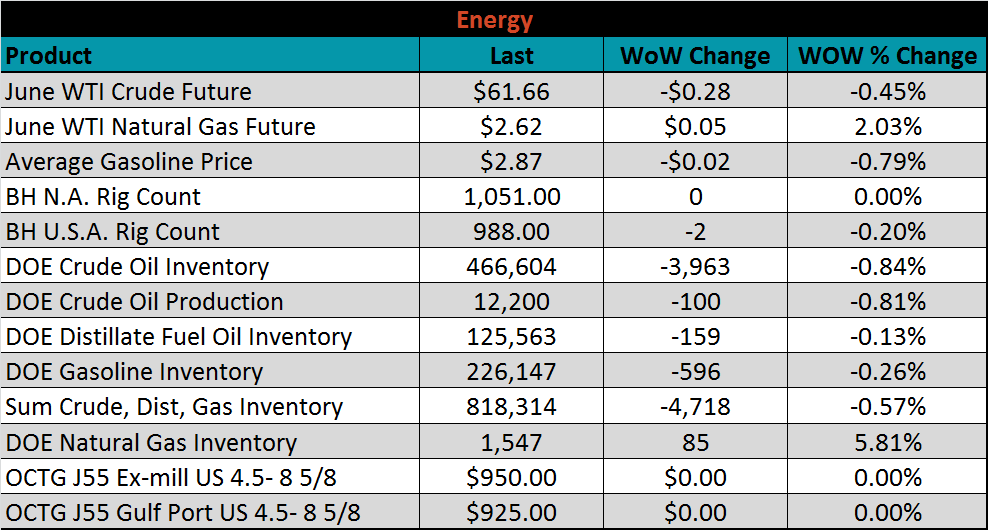
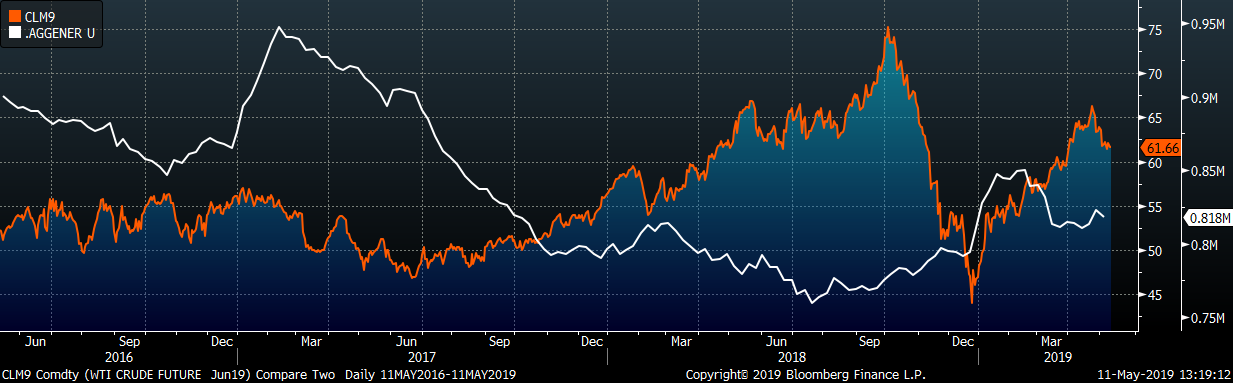
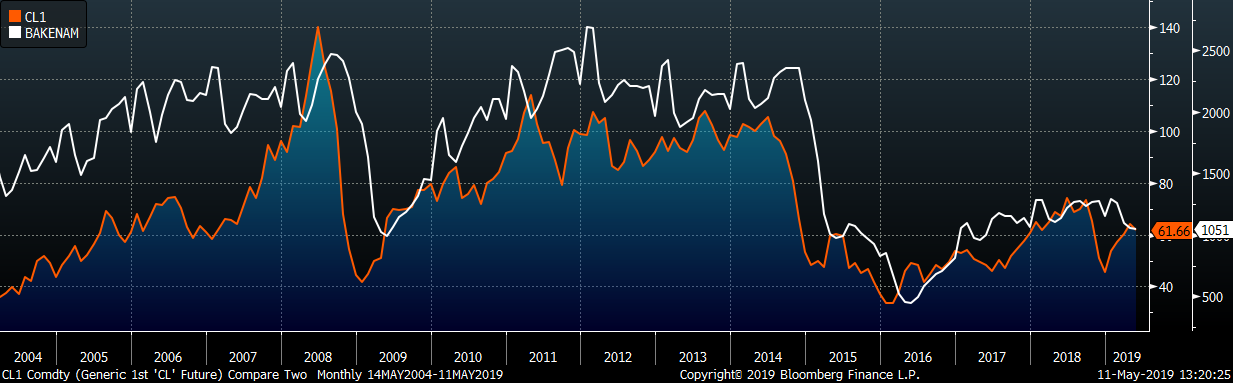
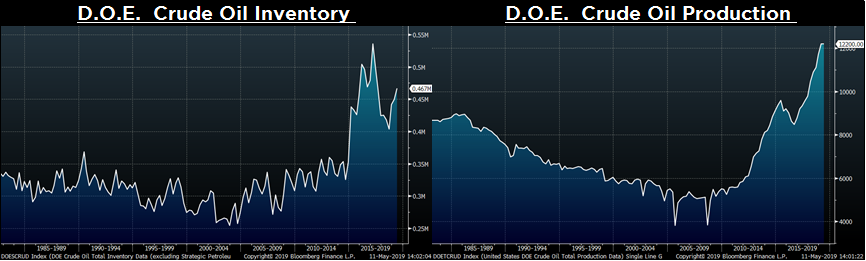
Last week, the June WTI crude oil future lost $0.28 or 0.45% to $61.66/bbl. The aggregate inventory level was down 0.6%, and crude oil production fell back down to 12.2m bbl/day. The U.S. rig count lost two rigs, while the North American rig count was unchanged.
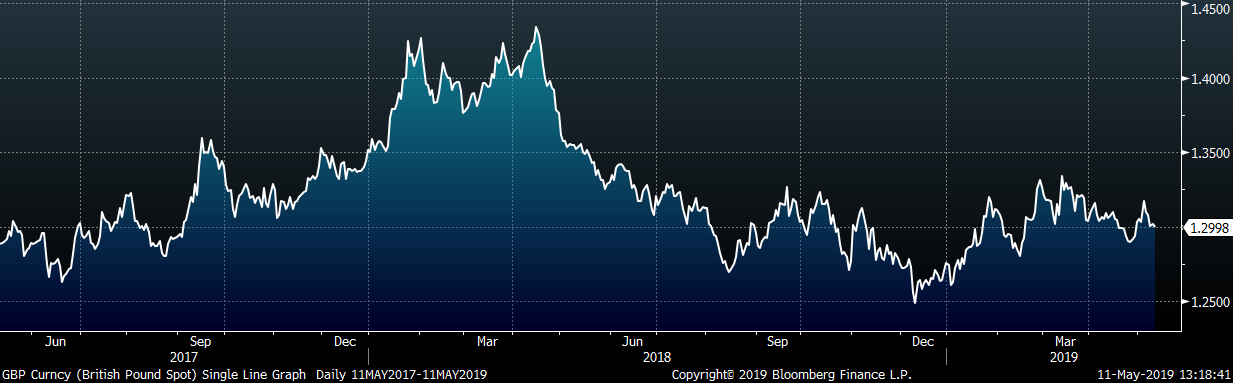
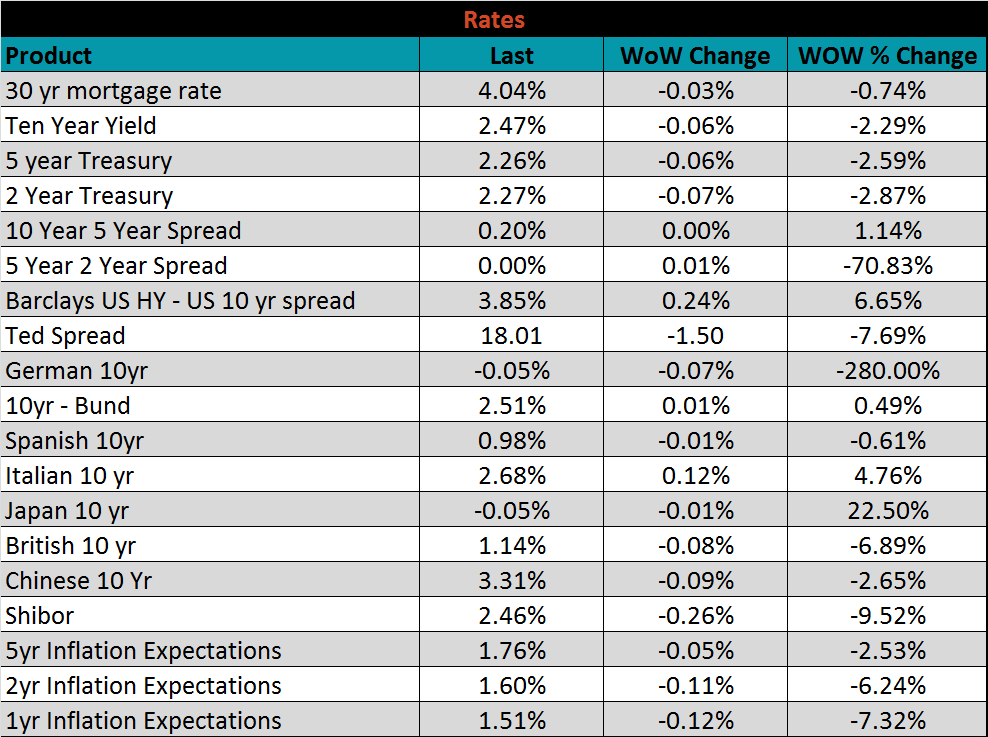
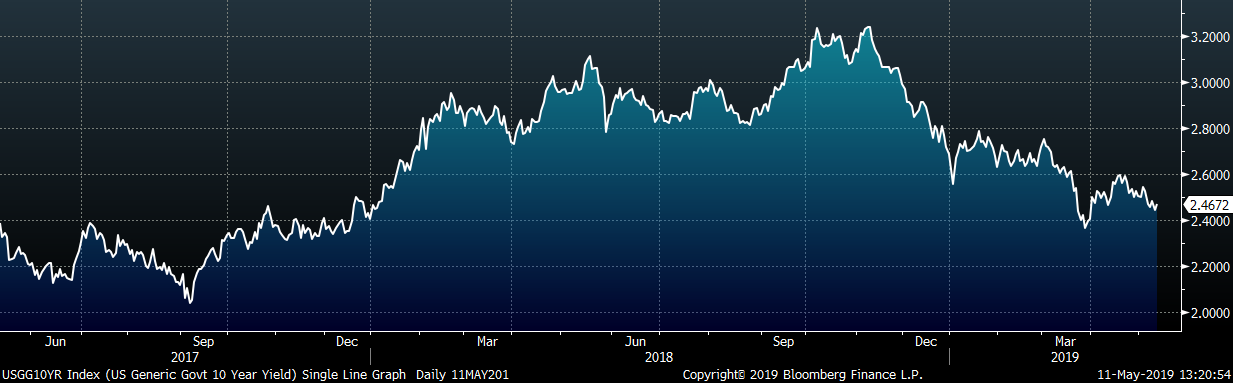
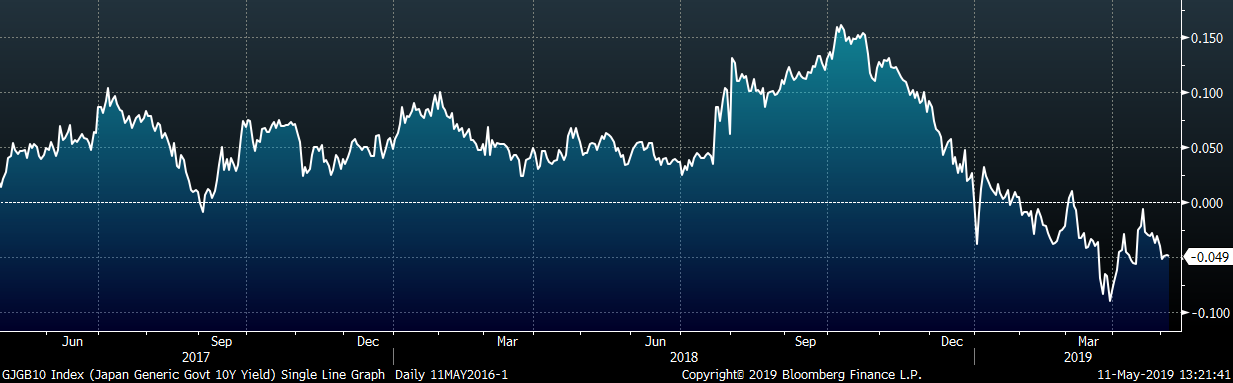
The U.S. 10-year treasury yield was down six basis points, closing the week at 2.47%. The Japanese 10-year yield was down to -0.05%. The German 10-year yield was down seven basis points and went back into negative territory closing at -0.05%.
The list below details some upside and downside risks relevant to the steel industry. The orange ones are occurring or look to be highly likely. The upside risks look to be in control.
Upside Risks:
Downside Risks: