Content
-
Weekly Highlights
- Market Commentary
- Durable Goods
- Risks


The march higher in the HRC spot price continued this week, as market dynamics remain largely unchanged. Mill orderbooks remain tight with long lead times and limited availability, selling out quickly at elevated prices. The largest current problem for end users remains the lack of inventories across the board, as broad strength for goods demand sees no cracks. Global HRC spot prices continue to rise and the structural shortage, both here and abroad, continues to worsen. This week, we will discuss recent headlines and their effect on the futures market as well as the March Durable Goods report released earlier this month.
Late in the week, rumors of trade normalization and E.U. steel tariffs discussion started to permeate through the futures market. As more information has become available, it appears as though any meaningful resolution is months away. However, as this story continues to develop, we refer to our prior analysis published on January 29th between the two partners. As mentioned in that report, historical data suggests European steel imports will likely not impact the current shortage significantly, even if they would match the highest sustained historical levels. Additionally, and possibly more importantly, Europe is facing a supply shortage of their own, making the likelihood of a meaningful number of European imports low.
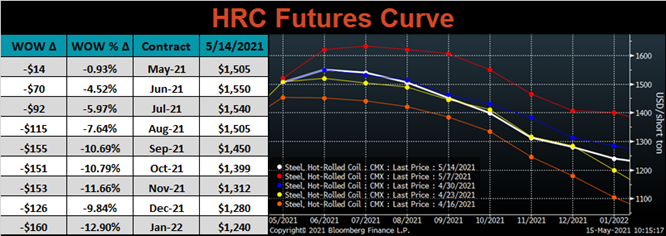
The other significant story from last week is what happened in the futures market. The chart below is the futures curve from the previous 3 weeks.

The previous 3 weeks are a perfect example of how momentum and speculation in the futures market can lead to decision paralysis for hedgers. Take the September expiration – up $141/ton two weeks ago, and down this week by $155. With no material change in the dynamics within the physical market over that period to justify these moves, it may be hard to see the value of the futures market for your business. Rather than trading the forward curve as a prediction of future spot prices, you can use the curve with one goal in mind: to manage steel price volatility of future physical steel transactions. Two weeks ago, when the September expiration was above the spot price, fixing your future prices was risky. However, the recent sell-off is providing you the opportunity to take a “second look” at fixing future prices (below the current spot price) which could lock in margin for your backlog. This rally has shown how quickly prices can move based off short-term sentiment. If the current curve prices work for your business, then they likely work for your competition as well. If you are being swayed by volatility within the futures market, you may be a step behind and miss opportunities to reduce the risk of your future steel buys.

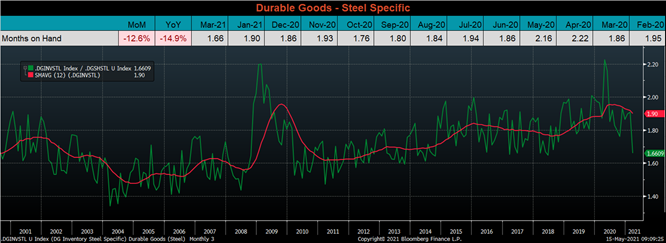
Below are final March new orders from the Durable Goods report. New orders for manufactured goods were up 20.3% compared to March 2020 and up 16.1% compared to February. Manufacturing ex-transportation new orders were up 12.6% YoY and 15.5% higher than February. More importantly, they were 2.6% higher than March 2019. The final chart looks at the months on hand (inventory divided by shipments) for durable goods categories that are steel intensive. MOH decreased significantly compared to February and are well below the 12-month moving average. The was driven by a significant increase in shipments compared to only a slight increase in inventories, which remain historically low.



Below are the most pertinent upside and downside price risks:
Upside Risks:
Downside Risks:

The Platts TSI Daily Midwest HRC Index increased by $53.25 to $1,554.75.

The CME Midwest HRC futures curve is below with last Friday’s settlements in white. After months of consistent increases, the entire curve sold off dramatically to end the week, most significantly in later expirations.
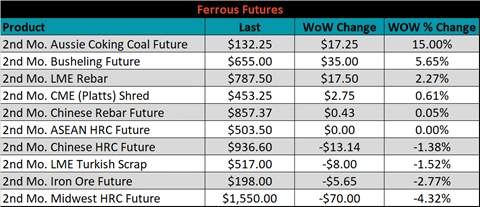
June ferrous futures were mostly higher. The Aussie coking coal future gained 15%, while Midwest HRC lost 4.3%.
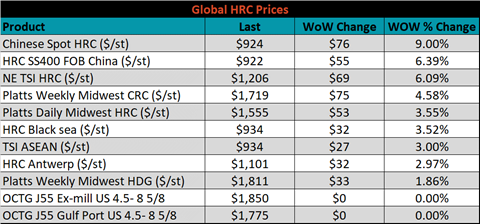
Global flat rolled indexes were all higher, led by Chinese spot HRC up another 9%.
The AISI Capacity Utilization rate decreased 0.6% to 78.1%.


May flat rolled import license data is forecasting an increase of 123k to 900k MoM.

Tube imports license data is forecasting an increase of 47k to 347k in May.


May AZ/AL import license data is forecasting an increase of 52k to 143k.

Below is April import license data through May 11, 2021.

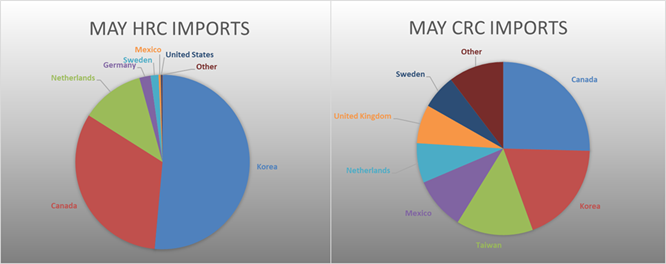

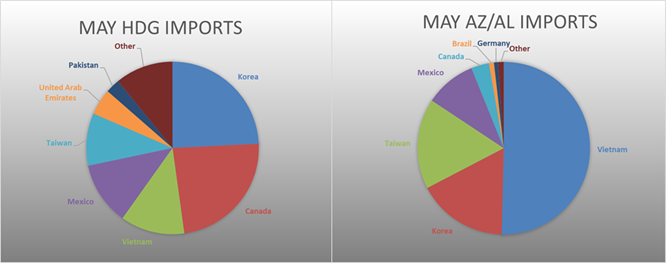
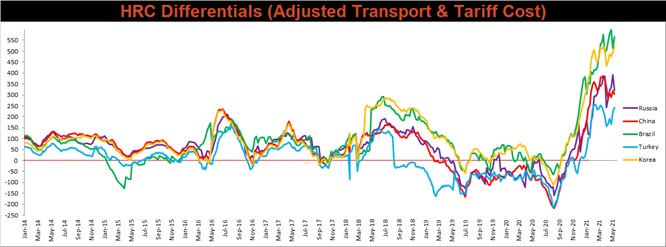
Below is the Midwest HRC price vs. each listed country’s export price using pricing from SBB Platts. We have adjusted each export price to include any tariff or transportation cost to get a comparable delivered price. The differentials increased for Turkey, Korea and Brazil, as the U.S. domestic price rose more significantly than theirs. This was not the case for Russia and China, as both countries saw dramatic increases to their export price.
SBB Platt’s HRC, CRC and HDG pricing is below. The Midwest CRC, HRC & HDG prices were up, 4.6%, 3.6% and 1.9%, respectively. Globally, the Russian export HRC price was up 12.4%.


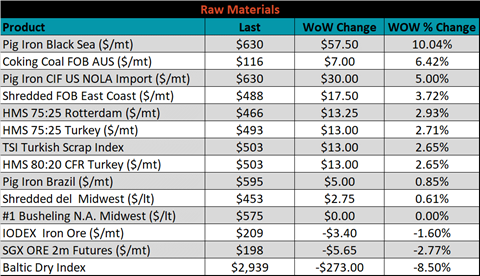
Raw material prices were mostly higher, led by Black Sea pig iron, up 10%.
Below is the iron ore future curve with Friday’s settlements in orange, and the prior week’s settlements in green. Last week, the entire curve shifted lower.

The ex-flat rolled prices are listed below.


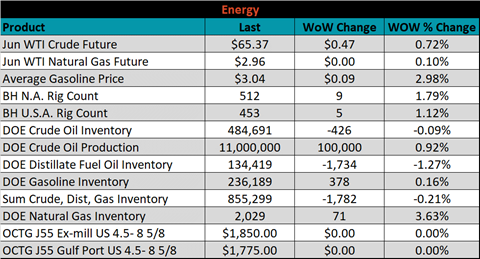
Last week, the June WTI crude oil future was up another $0.47 or 0.7% to $65.37/bbl. The aggregate inventory level was down another 0.2% and crude oil production increased to 11m bbl/day. The Baker Hughes North American rig count was up 9 rigs, and the U.S. rig count was up 5 rigs.


The list below details some upside and downside risks relevant to the steel industry. The orange ones are occurring or look to be highly likely. The upside risks look to be in control.
Upside Risks:
Downside Risks: