Content
-
Weekly Highlights
- Market Commentary
- Upside & Downside Risks


Momentum to the downside intensified this week as the prevailing sentiment is increasingly becoming “steel prices are going back to pre-invasion levels.” So, market participants remain on the sideline, sitting tight and waiting for their sub-$1,000 offers from the mills. While we understand why buyers remain cautious, there is a difference between waiting for better offers and taking on unnecessary risk. The most important lesson to learn from the 7-week mini rally in March and April is that the market is different than it was before the pandemic. While prices continue to decline, there will be a point where prices find support. We anticipate that this will be at a level much higher than the historical norms because of elevated input costs for the mills. What happened at the end of February was extreme, but it was not an anomaly. There are risks in both directions and the last 3 months are a prime example of why hedging and risk management are necessary for steel buyers in today’s market.
Turning to the demand side of the equation, our view over the last two years has been that the parts and labor shortages are resulting in pent-up demand which will keep prices elevated as these restraints ease. We still view extended backlogs in that way. However, without resolution, there is potential risk that new discretionary spending and project financing allocated towards steel intensive industries (autos, manufactured and durable goods, construction, appliances, etc.) will increasingly go elsewhere if it hasn’t already disappeared due to inflation.
The chart below shows the main regional Fed Manufacturing Surveys, going back to the beginning of the current expansion cycle, with the May expectations (dotted) and actual readings (solid, when applicable).
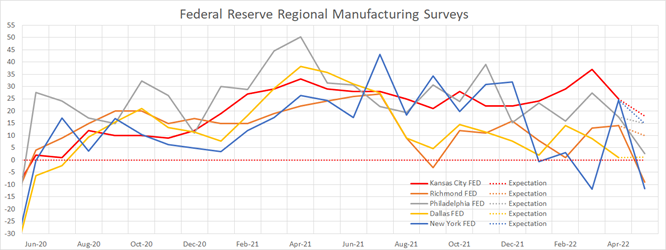
May readings have consistently underperformed market expectations, on top of the fact that the growth rates have been trending lower since the end of last summer. This trend is most notable in the Empire State (New York FED) manufacturing business conditions, which has printed well below zero 2 out of the last 3 months. In the coming weeks, a slew of economic datapoints will bring more clarity around the economy and steel consuming demand. While 1 month of poor readings do not indicate a crisis, the combination of worsening sentiment and weaking data are both signs that a cautious approach is the best way to view the current market. At the same time, while we anticipate further downward pressure on spot prices, it is important to keep in mind that the forward curve has provided opportunities to fix prices well below where most of the assessments and physical contracts have printed. Keep that in mind as we approach levels of support in the coming weeks.

Below are the most pertinent upside and downside price risks:
Upside Risks:
Downside Risks:

The Platts TSI Daily Midwest HRC Index was down another $80 to $1,300.

The CME Midwest HRC futures curve is below with last Friday’s settlements in white. The entire curve shifted slightly lower this week.

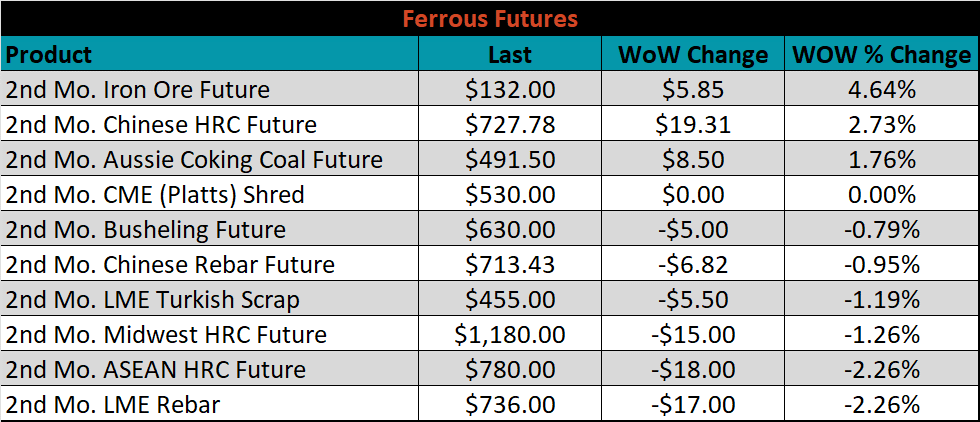
June ferrous futures were mixed, this week. Iron ore gained 4.6%, while LME rebar lost 2.3%.
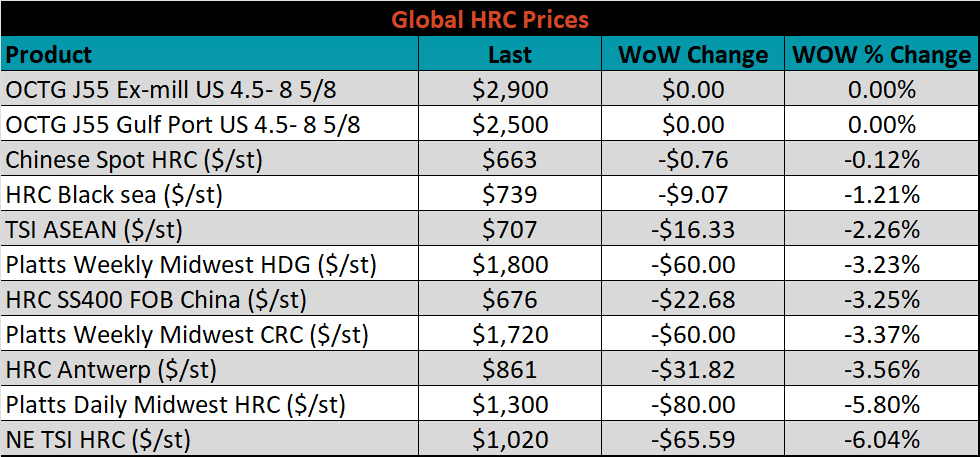
Global flat rolled indexes were lower again, led by Northern European HRC, down another 6%.
The AISI Capacity Utilization was up 0.4% to 81.8%.


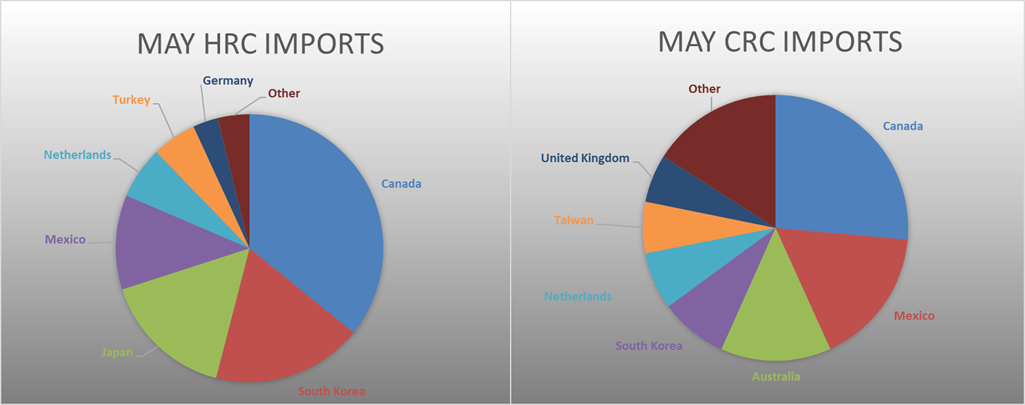
May flat rolled import license data is forecasting a decrease of 33k to 923k MoM.

Tube imports license data is forecasting an increase of 79k to 515k in May.


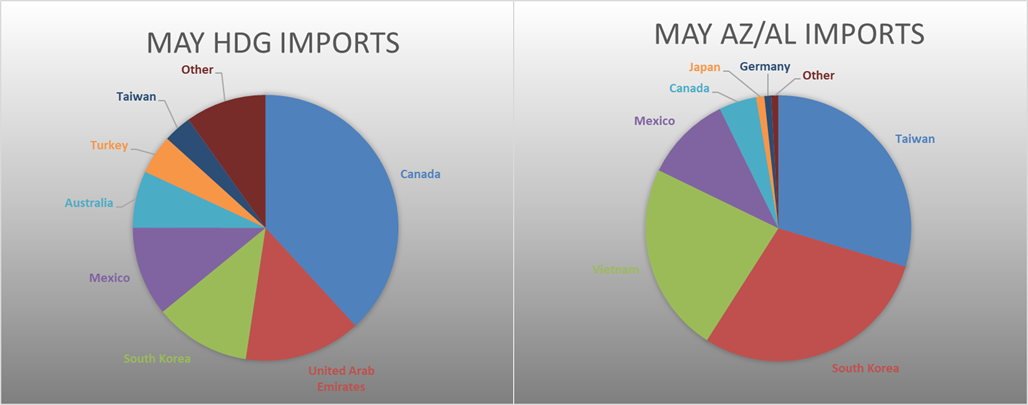
May AZ/AL import license data is forecasting a decrease of 20k to 77k.

Below is May import license data through May 16th, 2022.


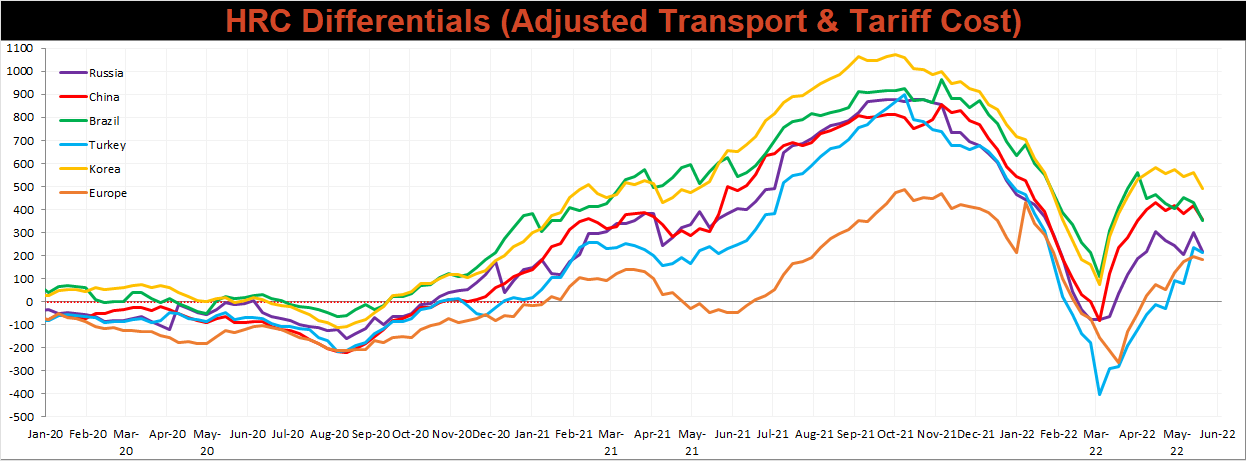
Below is the Midwest HRC price vs. each listed country’s export price using pricing from SBB Platts. We have adjusted each export price to include any tariff or transportation cost to get a comparable delivered price. Differentials decreased across the board, as the U.S. price fell more significantly that all the watched global prices.
SBB Platt’s HRC, CRC and HDG pricing is below. The Midwest HRC, CRC, & HDG prices were down 5.8%, 3.4%, & 3.2%, respectively. Outside of the U.S., the Southern European CRC export price was down the most, -14%.


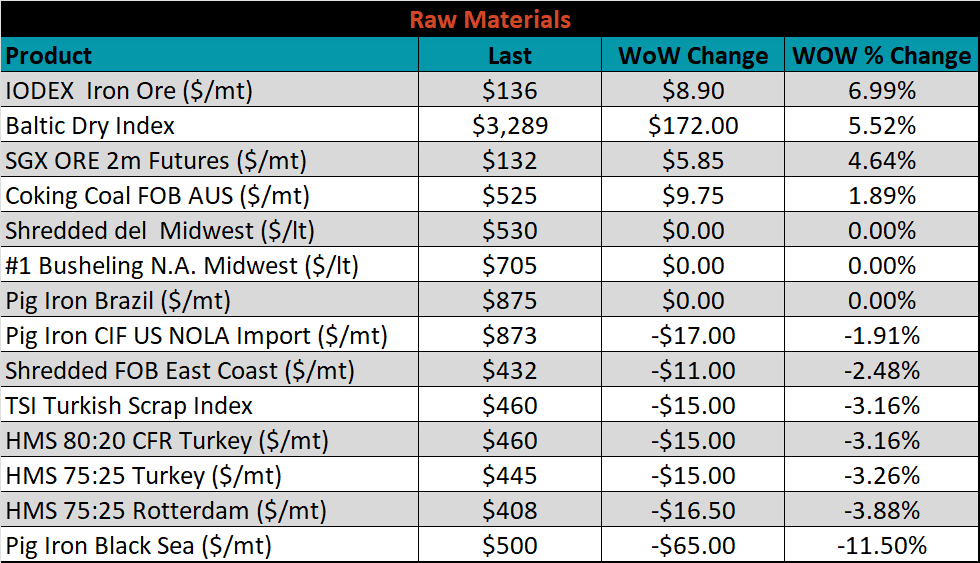
Raw material prices were mixed on the week. The IODEX iron ore index was up 7%, while pig iron was down 11.5%.
Below is the iron ore future curve with Friday’s settlements in orange, and the prior week’s settlements in green. Last week, the entire curve shifted higher at all expirations, most significantly in the front.

The ex-flat rolled prices are listed below.


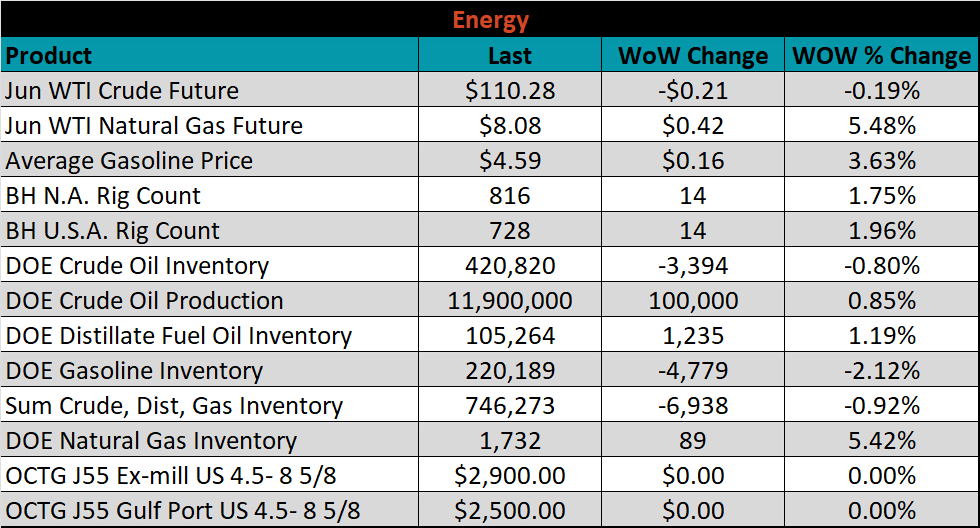
Last week, the June WTI crude oil future lost $0.21 or 0.2% to $110.28/bbl. The aggregate inventory level was down 0.9% and crude oil production rose 11.9m bbl/day. The Baker Hughes North American rig count was up 14 rigs, while the U.S. rig count was up another 14.


The list below details some upside and downside risks relevant to the steel industry. The bolded ones are occurring or highly likely.
Upside Risks:
Downside Risks: