Content
-
Weekly Highlights
- Market Commentary
- Risks


With the domestic HRC spot price dropping over the past several weeks, this report has examined at what price the market may find a bottom. We have highlighted declining producer’s profitability and shrinking import differentials as upside price risks, as they are both at historically low levels. As domestic prices continue to decline, and get closer to the bottom, the upside price pressure due to of both of these risks strengthens.
At FGM, we realize we will never be able to time the market through buying the bottom or selling the top. Instead, we look at upside and downside risks, analyzing how each will affect our business. Every week that prices decline and purchases are delayed, the risk/reward ratio for steel purchasers shifts to a more risky position. Prices are moving closer to the bottom, wherever it may be, and the upside price pressure grows.
We advise, and are deploying ourselves, a prudent strategy of mitigating upside price risk using the futures market through locking in only a fraction of forward purchases at current prices, and determining lower price levels, should the opportunity present itself, to lock in more material. Trying to time the market bottom inevitably leads to chasing the market higher without material on hand. Is the reward of slightly lower prices worth the risk?
Below are the most pertinent upside and downside price risks:
Upside Risks:
Downside Risks:
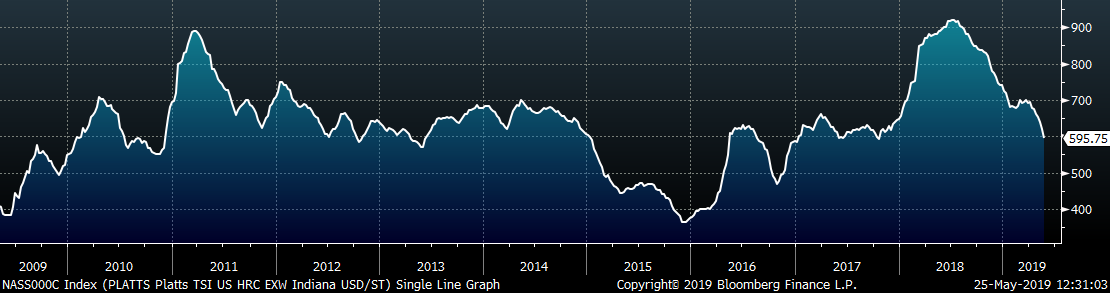
The Platts TSI Daily Midwest HRC Index was down $25.25 to $595.75.
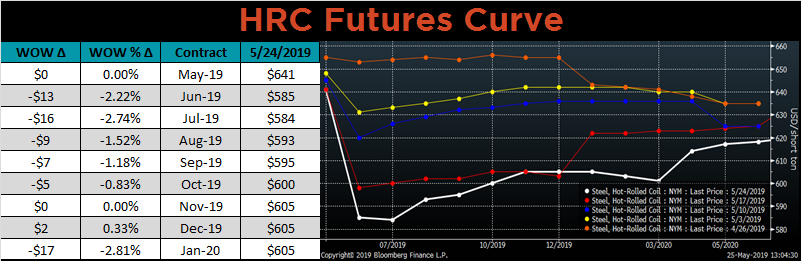
The CME Midwest HRC futures curve is shown below with last Friday’s settlements in white. The curve shifted lower in both the front and back last week, and it remains in contango.
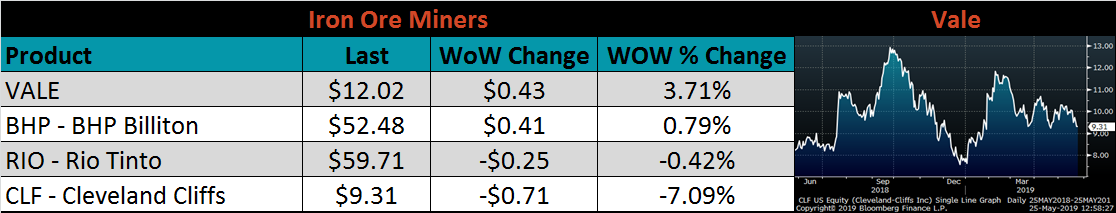
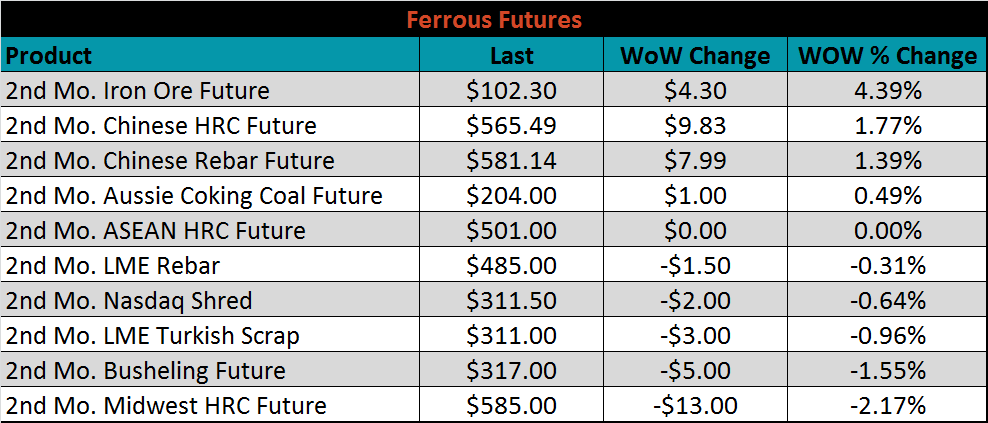
June ferrous futures were mixed. The iron ore future gained 4.4%, while the Midwest HRC future lost 2.2%.
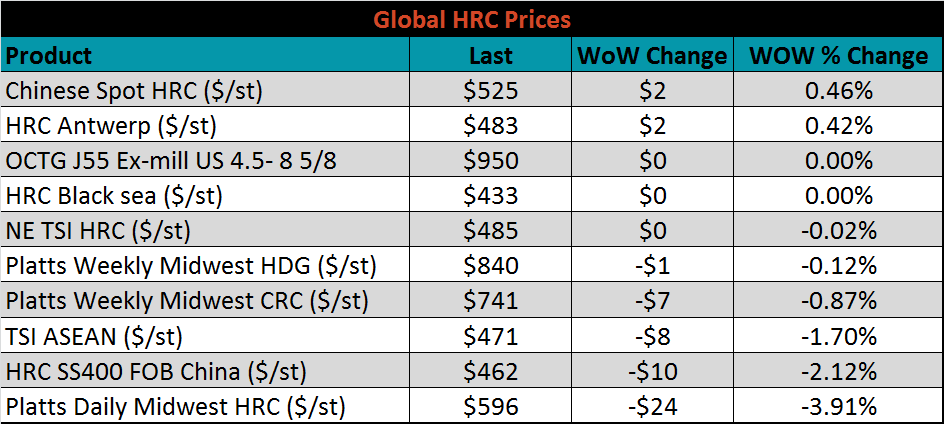
The global flat rolled indexes were mostly lower. Platts Midwest HRC was down 3.1%, while Chinese spot HRC was slightly higher.
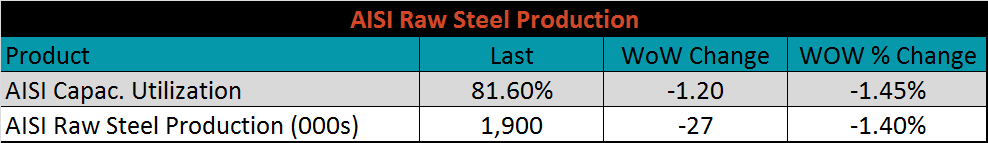
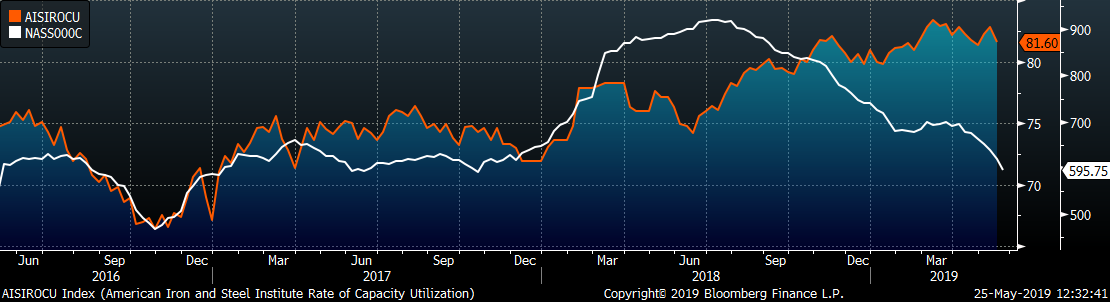
The AISI Capacity Utilization Rate was down 1.2 points to 81.6%. The Trump administration’s goal of 80% Capacity Utilization Rate has held since October 2018, but could be in jeopardy if mills cut production due to low prices.
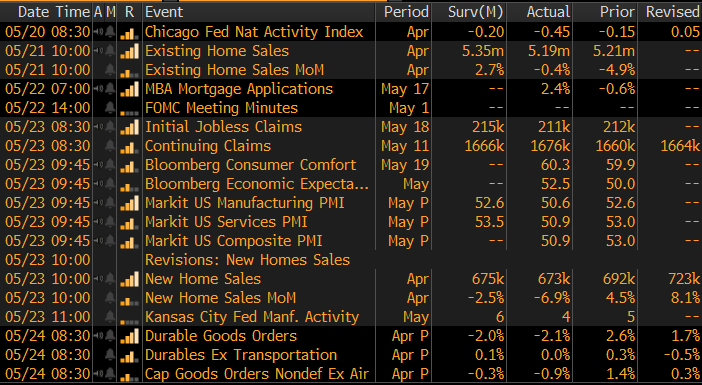
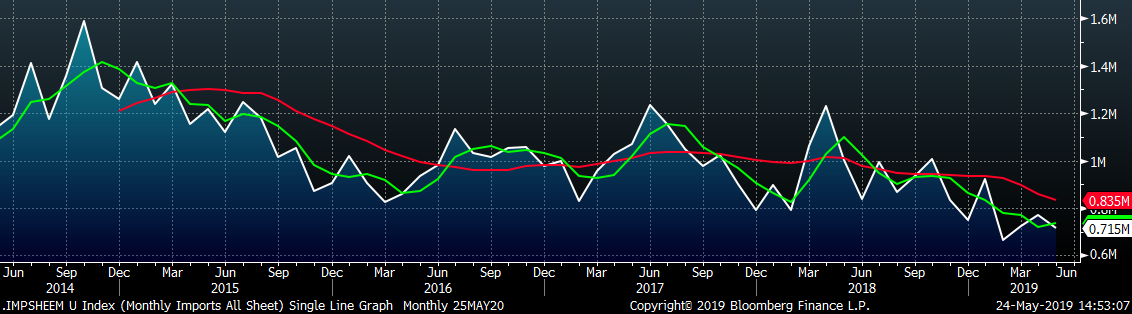
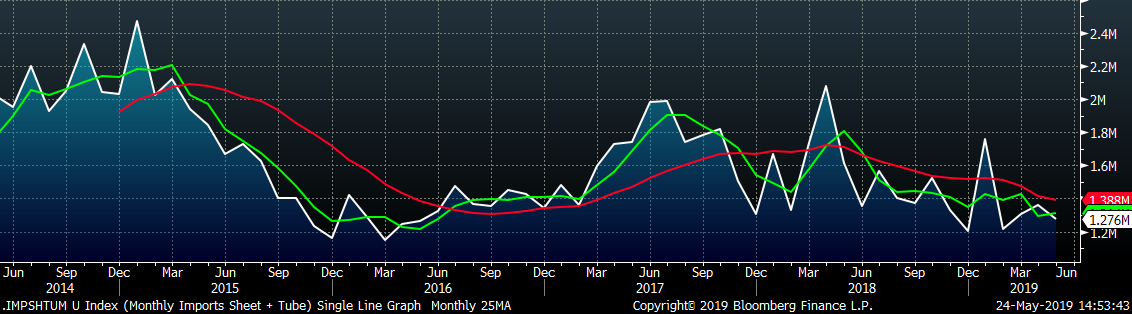
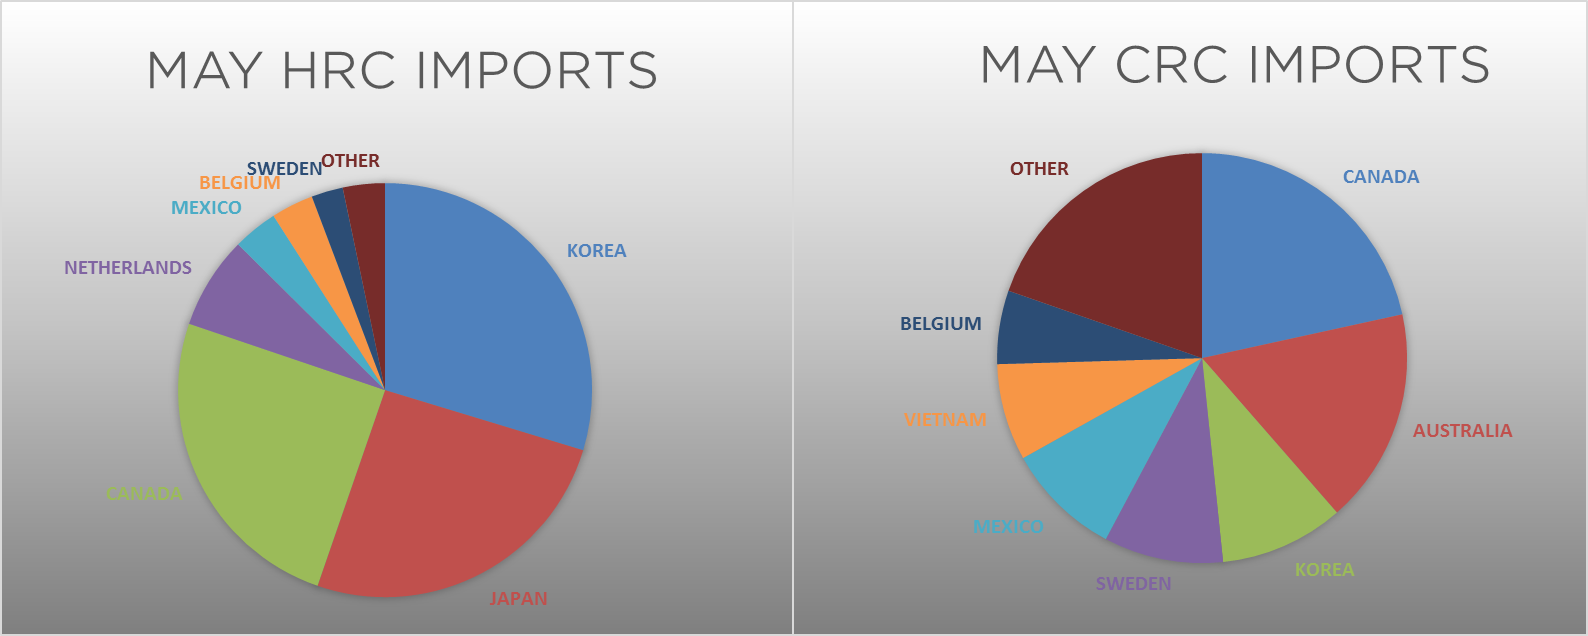
May flat rolled import license data is forecasting a decrease to 715k, down 55k MoM.
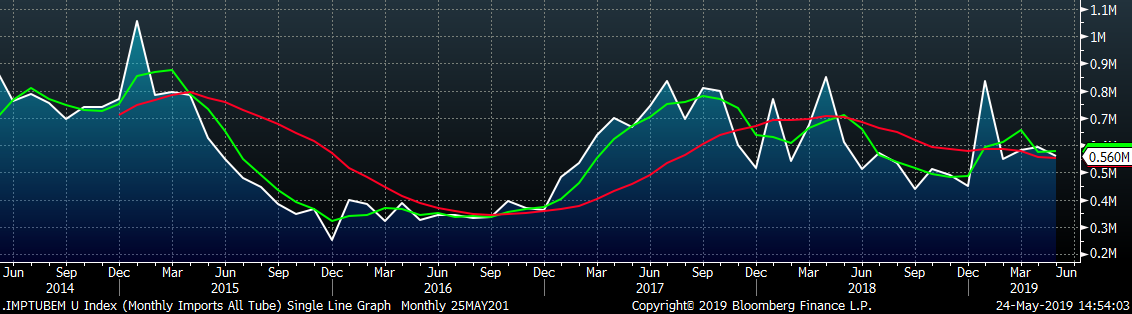
May tube import license data is forecasting a MoM decrease of 32k to 560k tons.
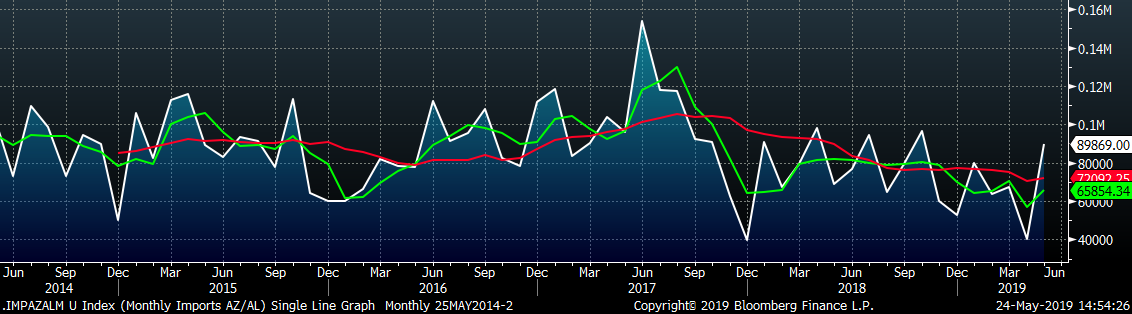
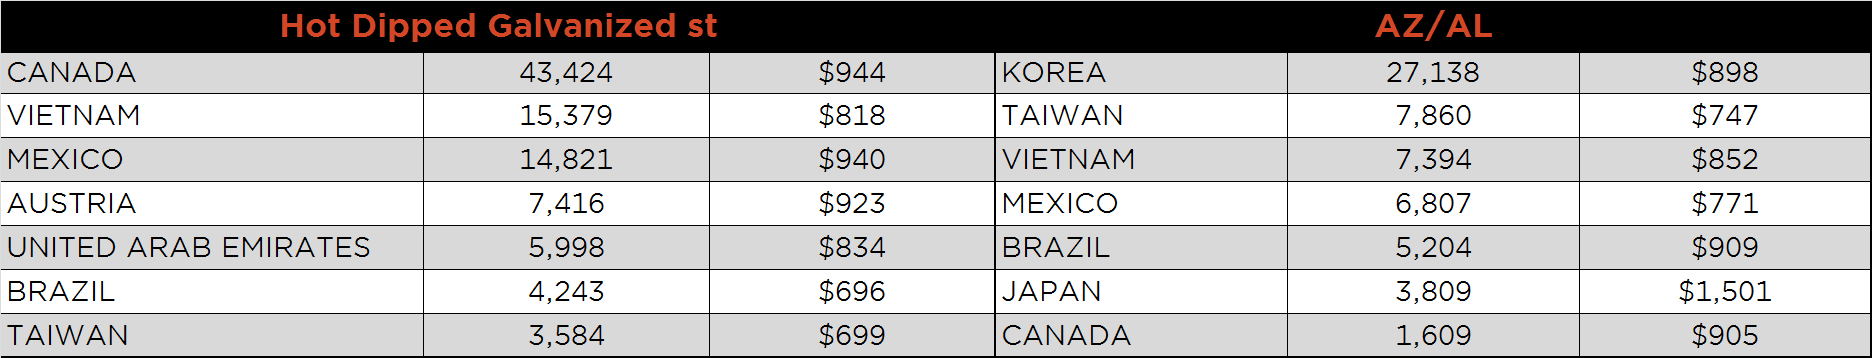
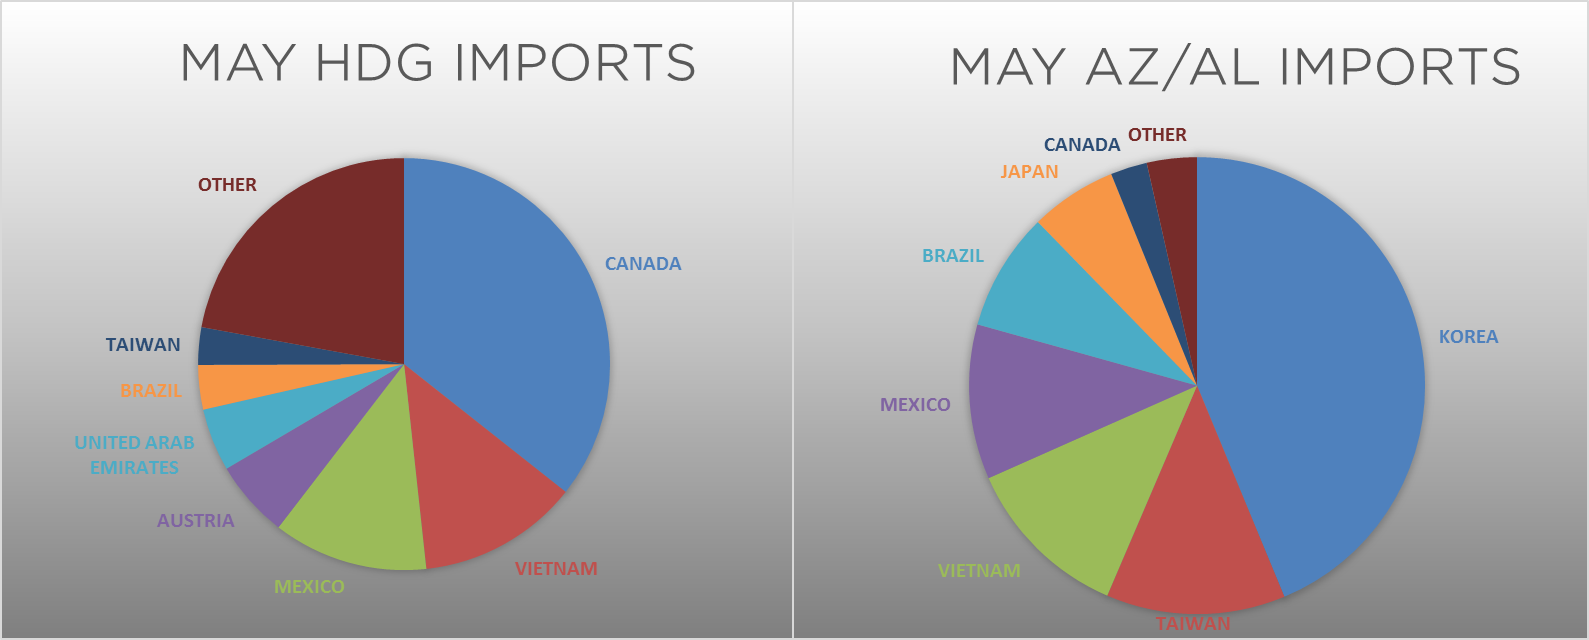
AZ/AL import licenses forecast an increase of 50k MoM to 90k in May.
Below is April import license data through May 21, 2019.
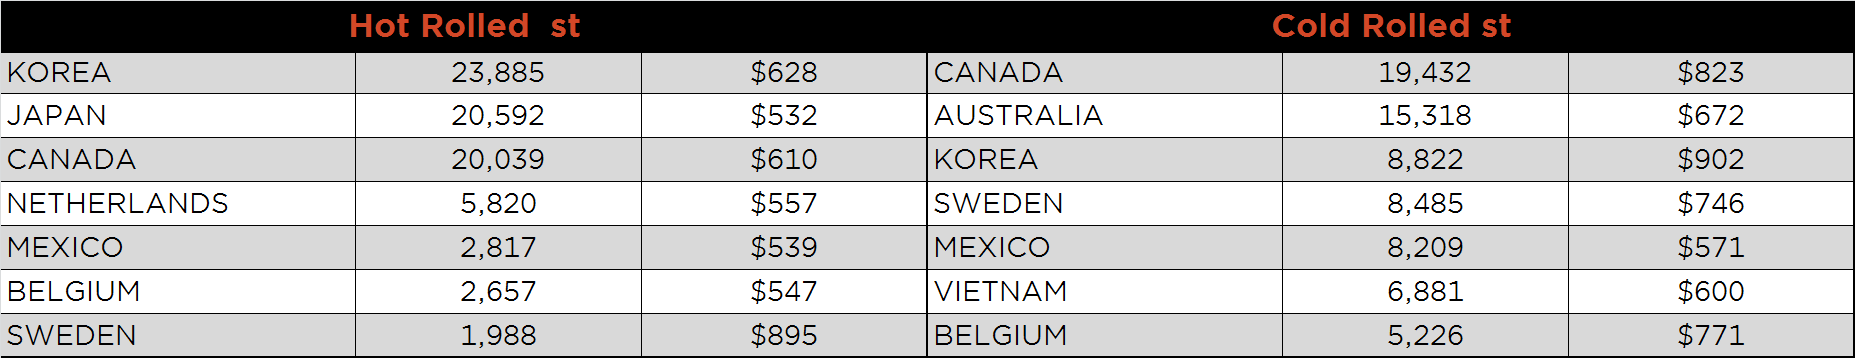
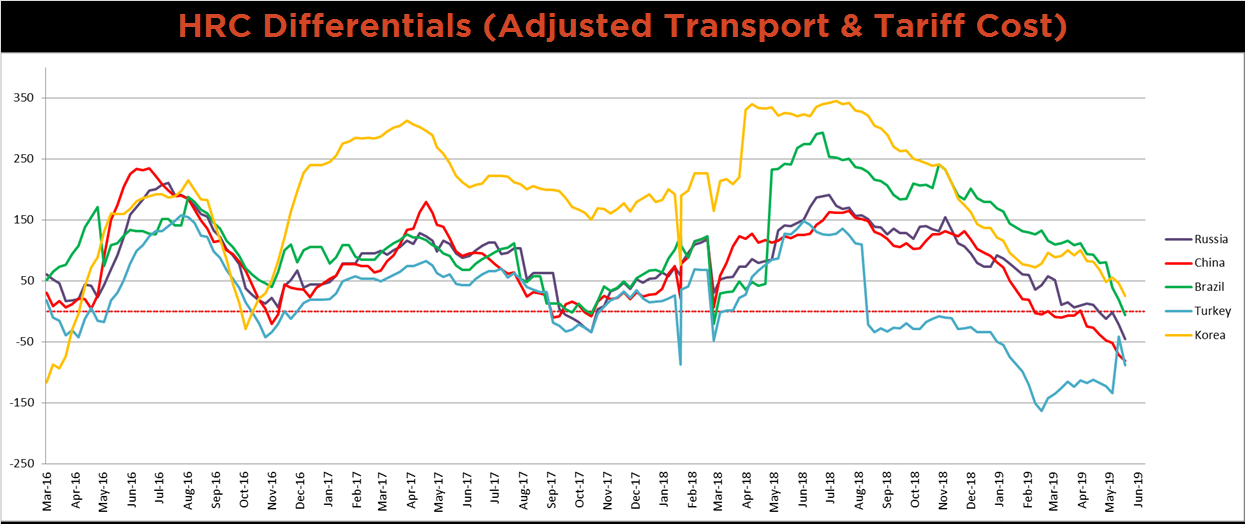
Below is HRC Midwest vs. each listed country’s export price differential using pricing from SBB Platts. We have adjusted each export price to include any tariff or transportation cost to get a comparable delivered price. For all the countries listed, price differentials moved lower last week, and each country’s differential is below zero except for Korea’s. Historically, the zero price differential level has acted as a bottoming signal for domestic HRC prices.
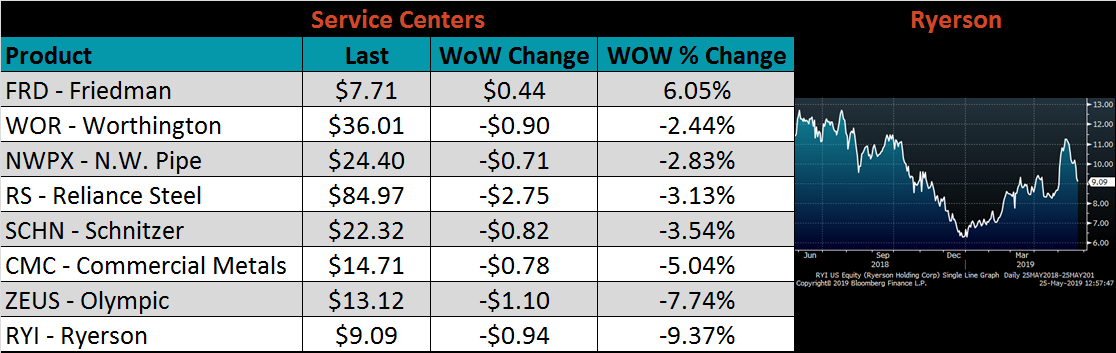
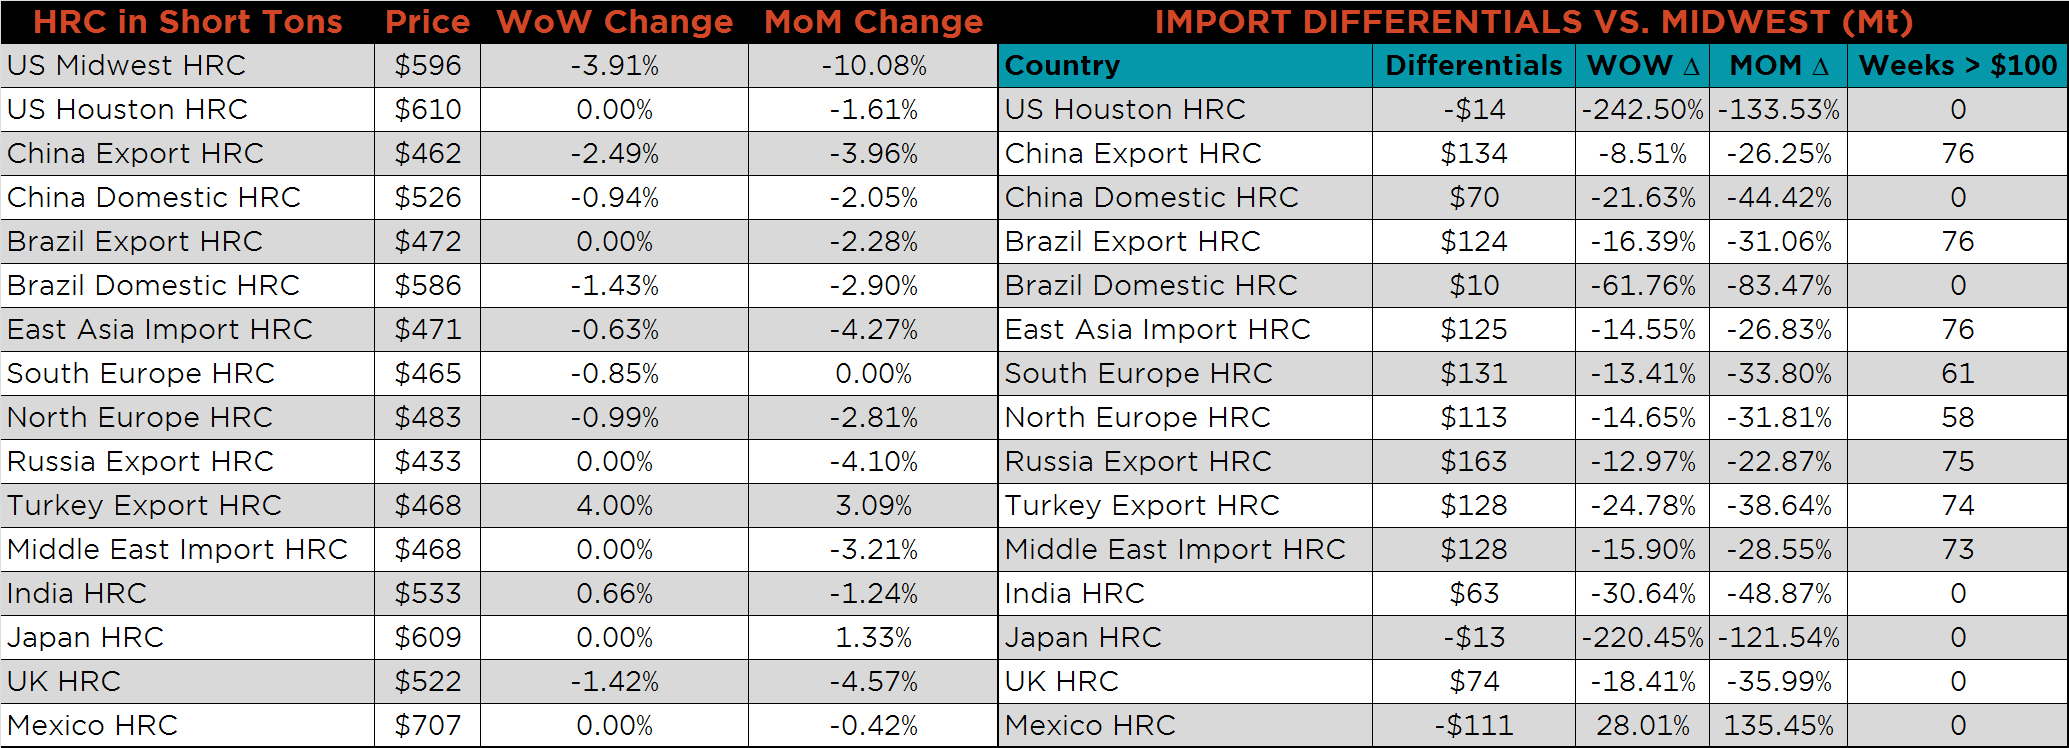
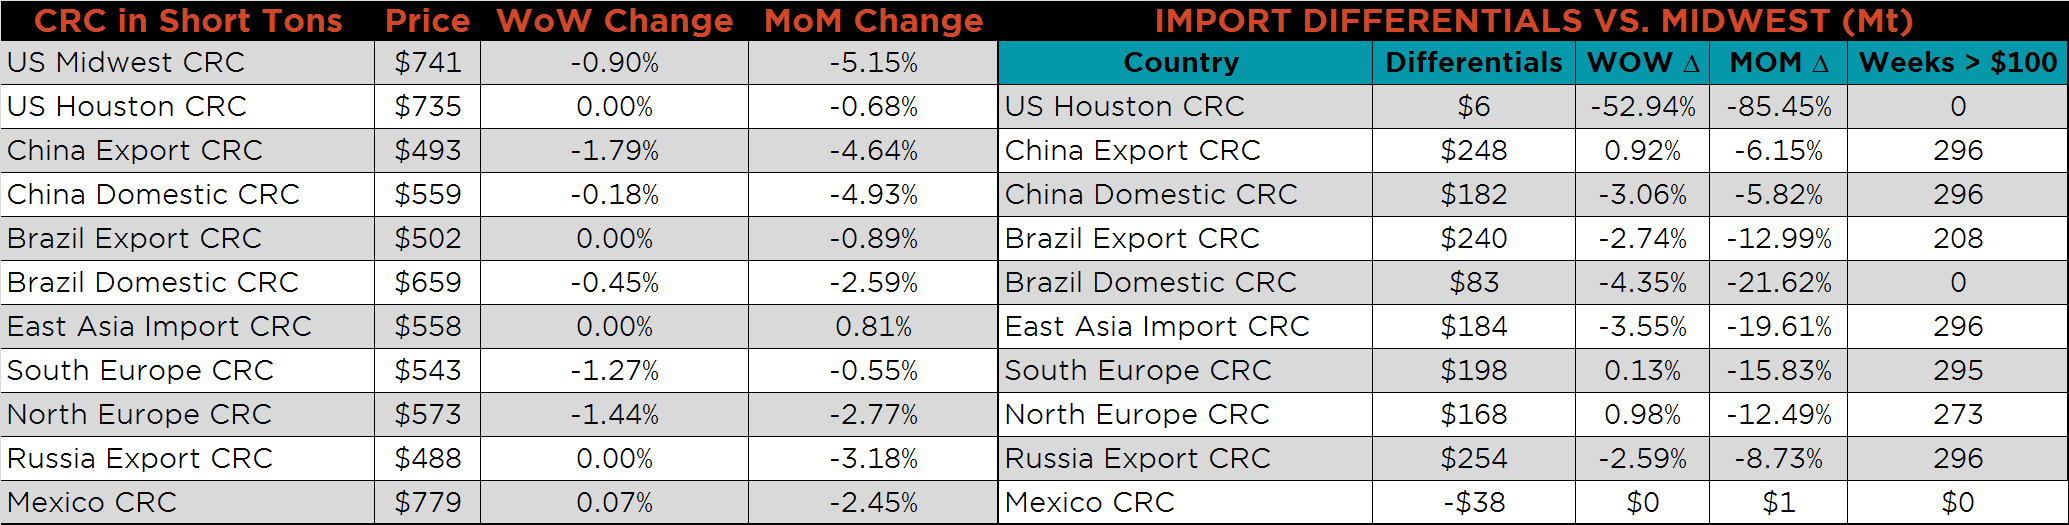
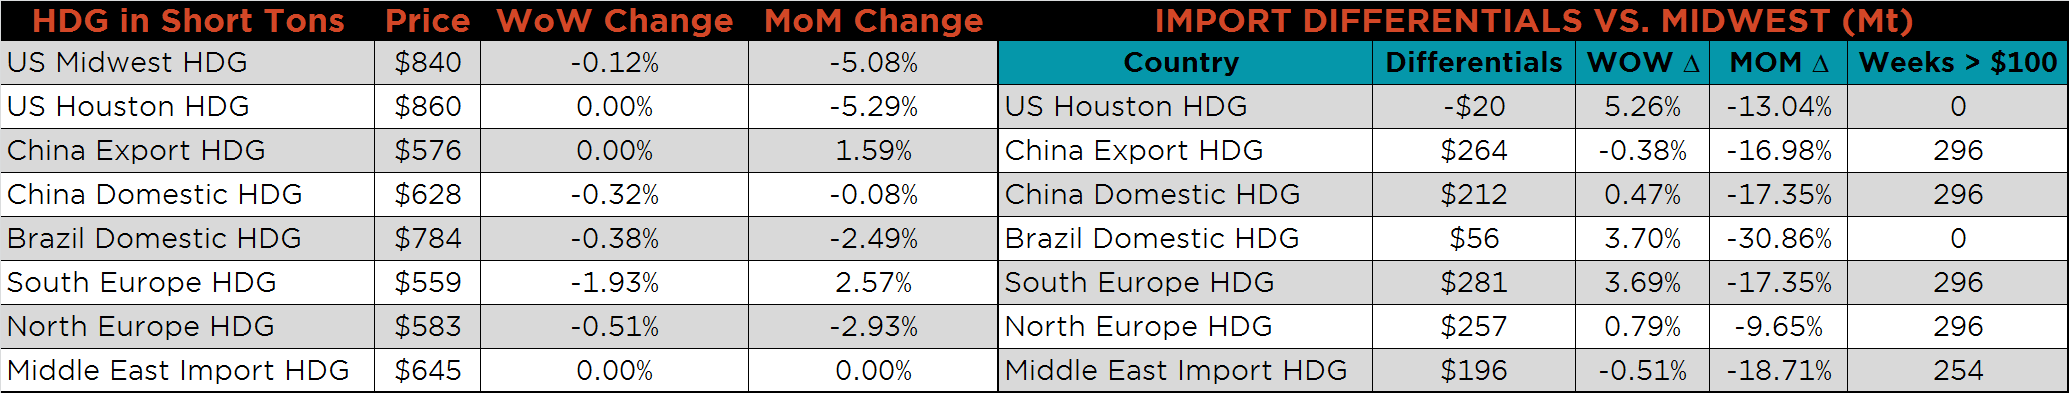
SBB Platt’s HRC, CRC and HDG pricing is below. Midwest HRC, CRC and HDG prices were lower on the week, 3.9%, 0.9% and 0.1%, respectively. The Turkey Export price was up 4%, while the Chinese Export HRC price was down 2.5%.
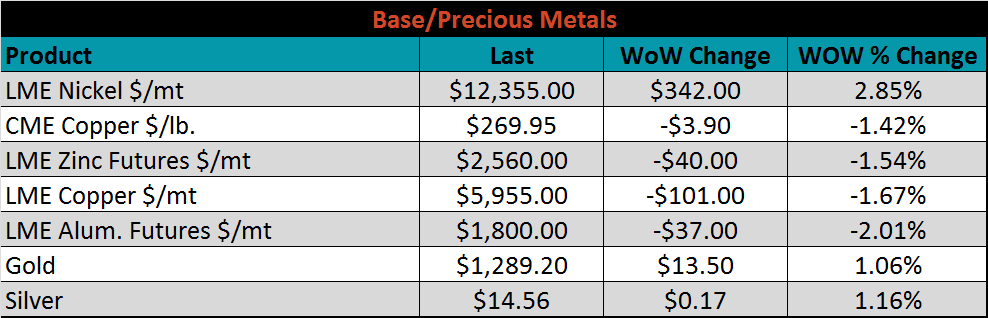
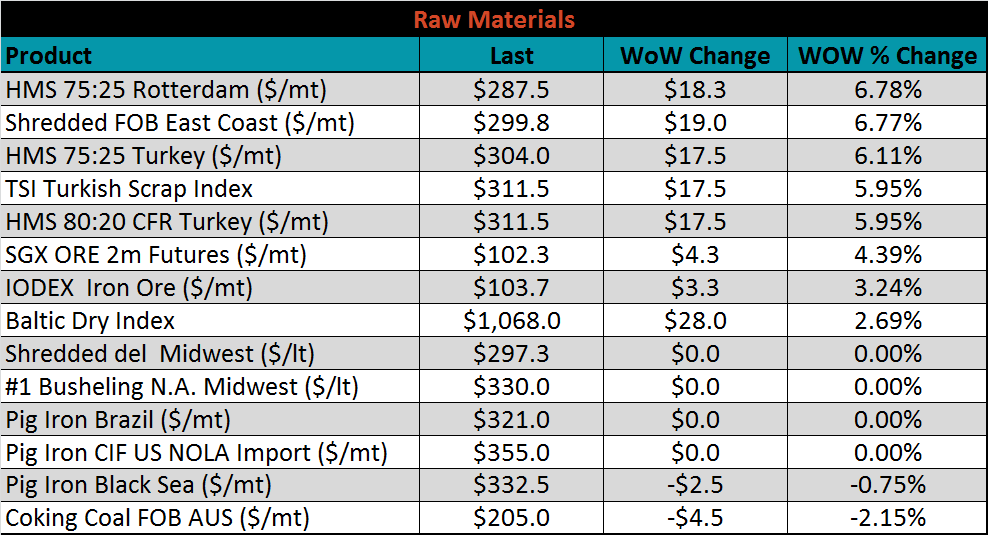
Raw material prices were mostly higher. HMS Rotterdam and East Coast shredded were each up 6.8%, while coking coal and pig iron were each down 2.2% and 0.8%, respectively.
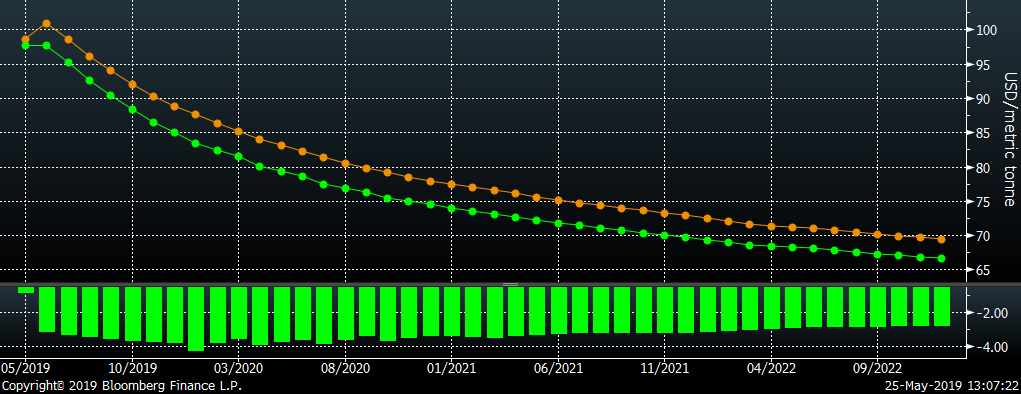
Below is the iron ore future curve with Friday’s settlments in orange, and one week prior’s settlements in green.
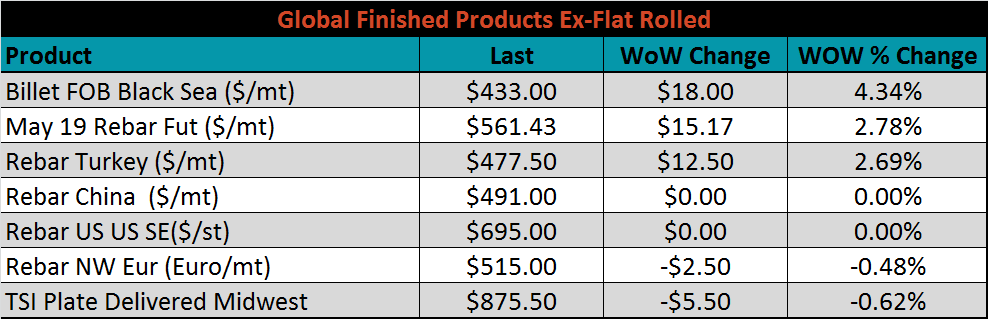
The ex-flat rolled prices listed below were mostly higher.

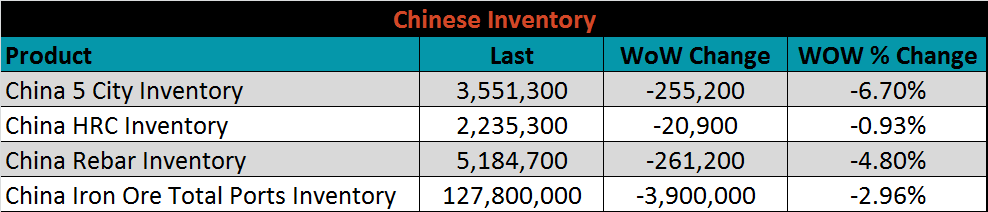
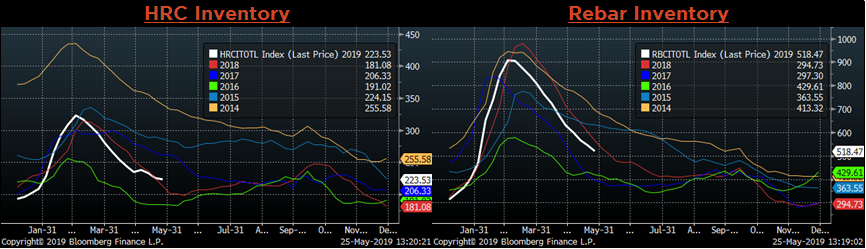
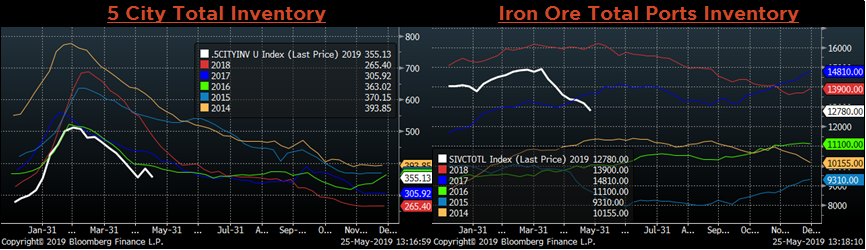
Below are inventory levels for Chinese finished steel products and iron ore, which all moved lower on the week. The white line in the charts shows how 2019 is tracking so far compared to the previous 5 years. 5 City inventory was down 6.7% and iron ore port inventory continues to fall. High prices have encouraged a depletion of existing inventory over restocking at these prices.
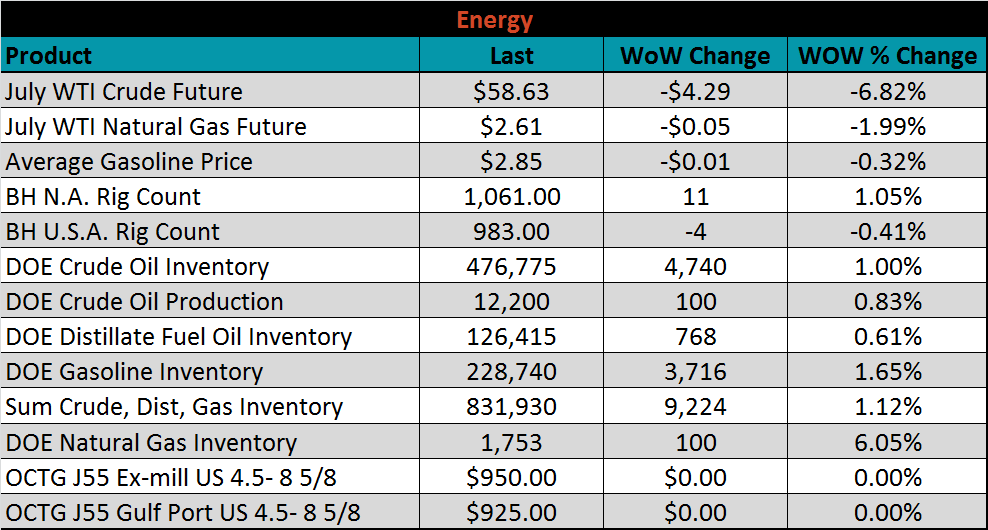
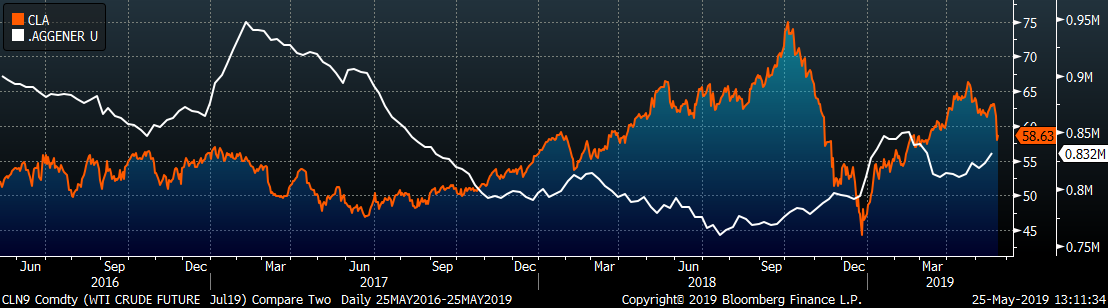
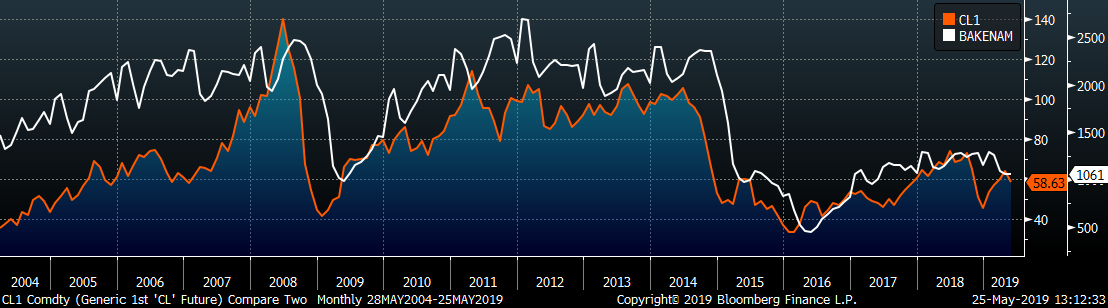
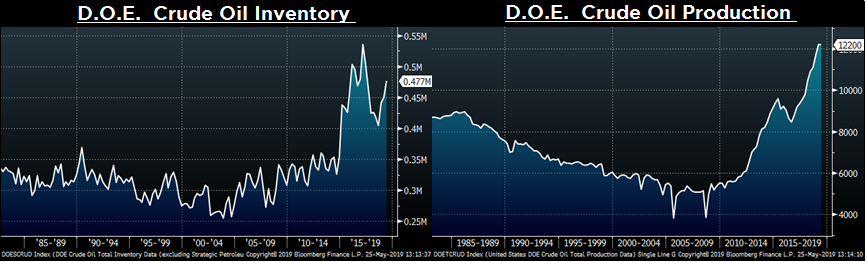
Last week, the July WTI crude oil future dropped $4.29 or 6.8% to $58.63/bbl. The aggregate inventory level was up 1.1%, and crude oil production rose to 12.2m bbl/day. The Baker Hughes North American rig count gained eleven rigs, while the U.S. gained one rig. Geopolitical tensions have supported oil prices, despite increased production and inventory.
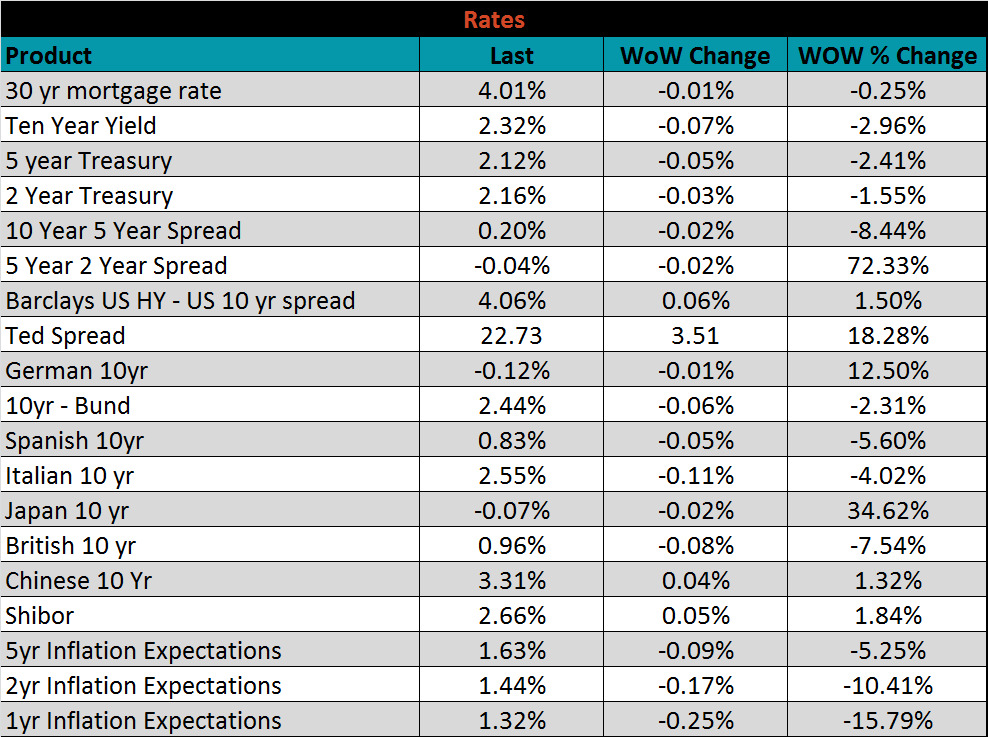
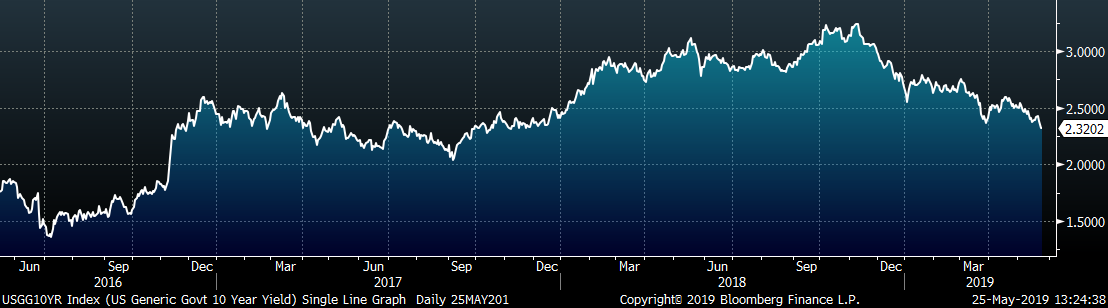
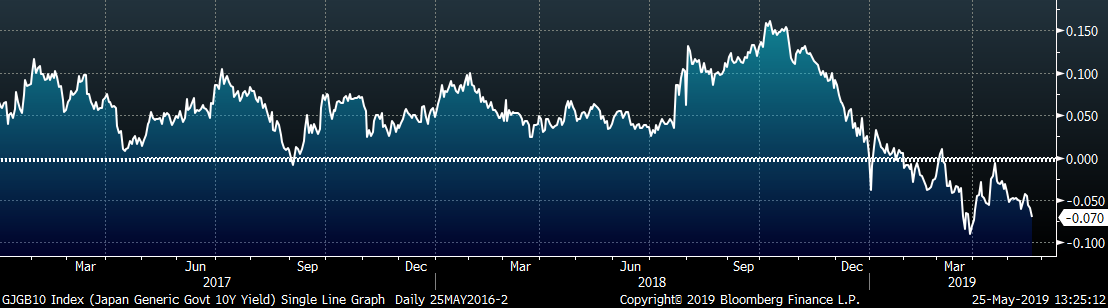
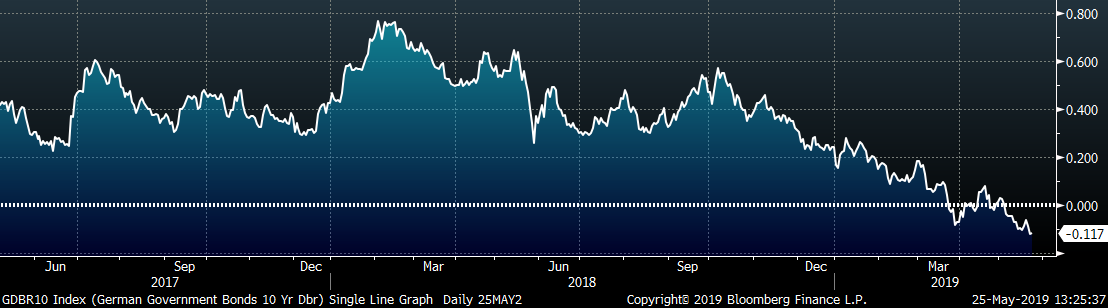
The U.S. 10-year treasury yield was down seven basis points, closing the week at 2.32%. The Japanese 10-year yield was down two basis points to -0.07%. The German 10-year yield was down one more basis points to -0.10%.
The list below details some upside and downside risks relevant to the steel industry. The orange ones are occurring or look to be highly likely. The upside risks look to be in control.
Upside Risks:
Downside Risks: