Content
-
Weekly Highlights
- Market Commentary
- Upside & Downside Risks


Over the last 6 months, the global steel market has experienced its most significant rally in terms of dollars per ton and percentage moves, sandwiched between two separate periods of freefall. If you are experiencing a sense of whiplash, you’re not the only one. This week was a quiet week as far as the domestic physical market was concerned, prices continued their downtrend but with very few transactions and most buyers on the sideline.
Turning to the financial market, the futures curve continues to be steeply backwardated, and provides a significant discount of at least $250 to current spot levels. Additionally, prices on the curve are currently at parity with the global price (adjusted for transportation) beginning in the fall of this year, a dynamic that remains that way through the end of 2023. The main takeaway here is that we are starting to see support levels emerge.
In addition to U.S. versus global price convergence, one of our main arguments for why the domestic market is not going back to its pre-COVID form is because of the consolidation amongst domestic producers. We view the new group of suppliers as better equipped to remain disciplined and achieve higher levels of profitability. On top of that, the overall costs for raw materials remain elevated. The first real test of this thesis was going to be happening in the 2Q22, where domestic prices were on track to bump up against cost-plus-profitability levels for both EAFs and BOFs. Leading up to the invasion, capacity utilization had already begun to decline and each of the mills expressed more interest in selling fewer tons rather than chasing lower orders. This was one of the reasons we were bullish on HRC prices at that period, but the Russian invasion superseded the testing of this new support level. Pending any major changes to the current market dynamics, this new support level will be retested. However, spot prices still have a long way to go before we get there.

Below are the most pertinent upside and downside price risks:
Upside Risks:
Downside Risks:

The Platts TSI Daily Midwest HRC Index was down another $60 to $1,240.

The CME Midwest HRC futures curve is below with last Friday’s settlements in white. Most of the curve was slightly higher, except for August & September expirations which were both down small. The curve has found support at current levels over the past three weeks, trading in a tight range.

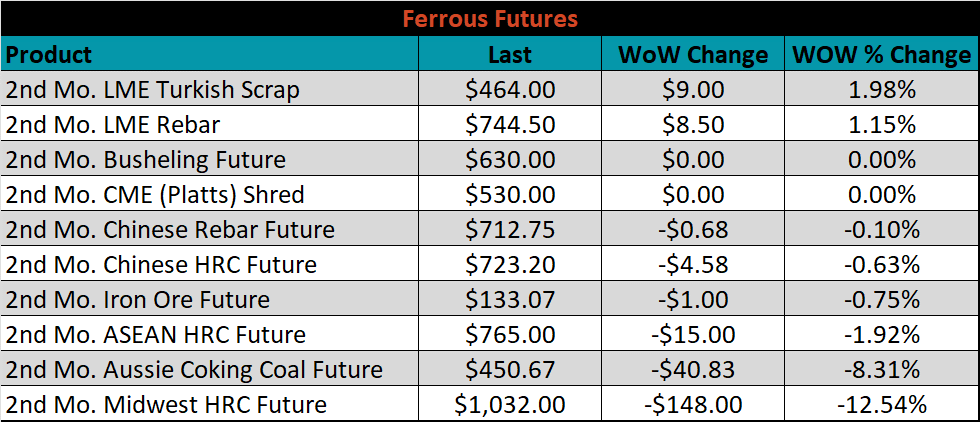
The 2nd month ferrous futures were mixed, this week. Turkish scrap gained 2%, while Midwest HRC lost 12.5%. The move in HRC was the result of the 2nd month rolling from June to July, which was priced $150 lower.
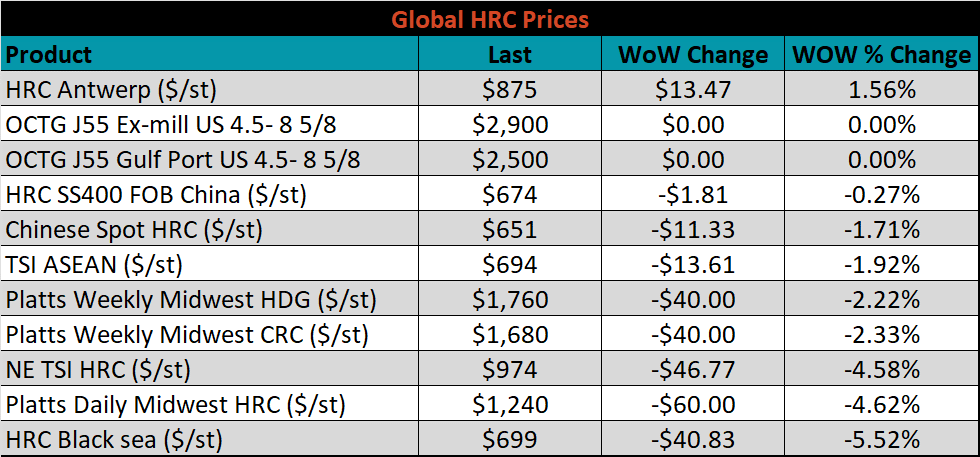
Global flat rolled indexes were mostly lower again, led by Black Sea HRC, down another 5.5%, while Antwerp HRC was up 1.6%.
The AISI Capacity Utilization was up 0.2% to 82%.


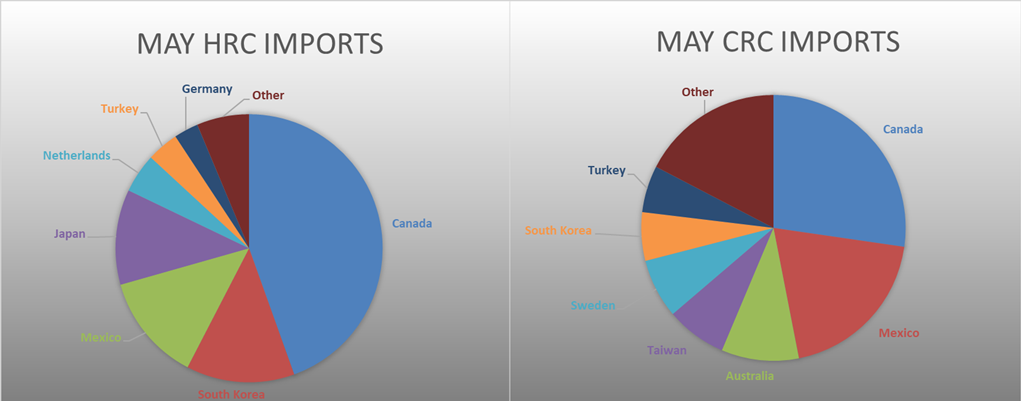
May flat rolled import license data is forecasting a decrease of 57k to 944k MoM.

Tube imports license data is forecasting an increase of 21k to 509k in May.


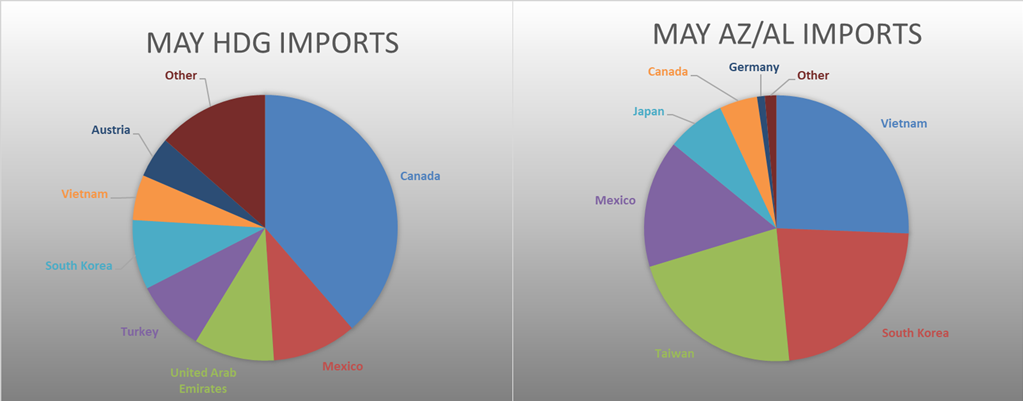
May AZ/AL import license data is forecasting a decrease of 21k to 81k.

Below is May import license data through May 23th, 2022.


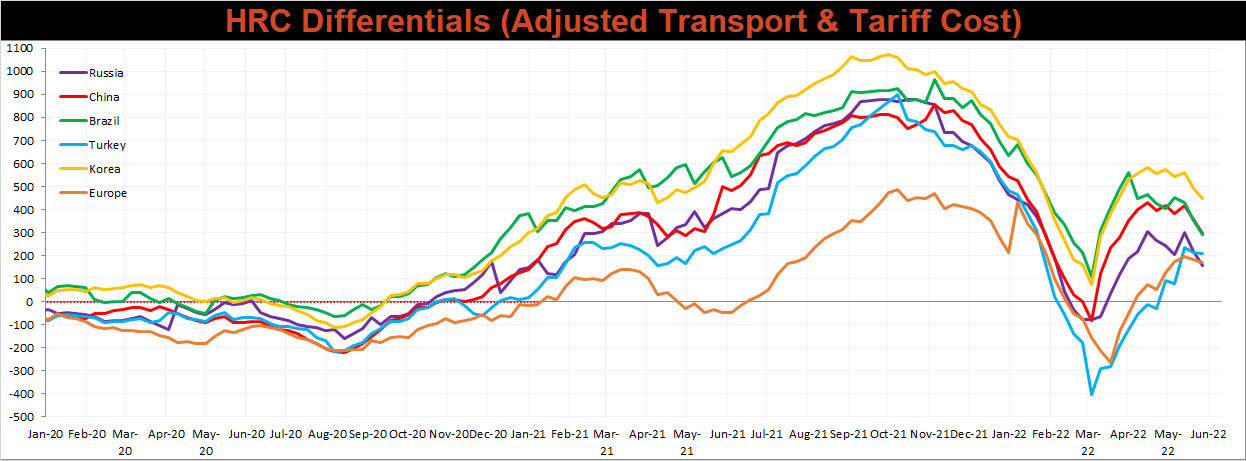
Below is the Midwest HRC price vs. each listed country’s export price using pricing from SBB Platts. We have adjusted each export price to include any tariff or transportation cost to get a comparable delivered price. Differentials decreased across the board again this week, as the U.S. price continues to more significantly than all the watched global prices.
SBB Platt’s HRC, CRC and HDG pricing is below. The Midwest HRC, CRC, & HDG prices were down 4.6%, 2.3%, & 2.2%, respectively. Outside of the U.S., the Northern European CRC export price was down the most, -8.4%.


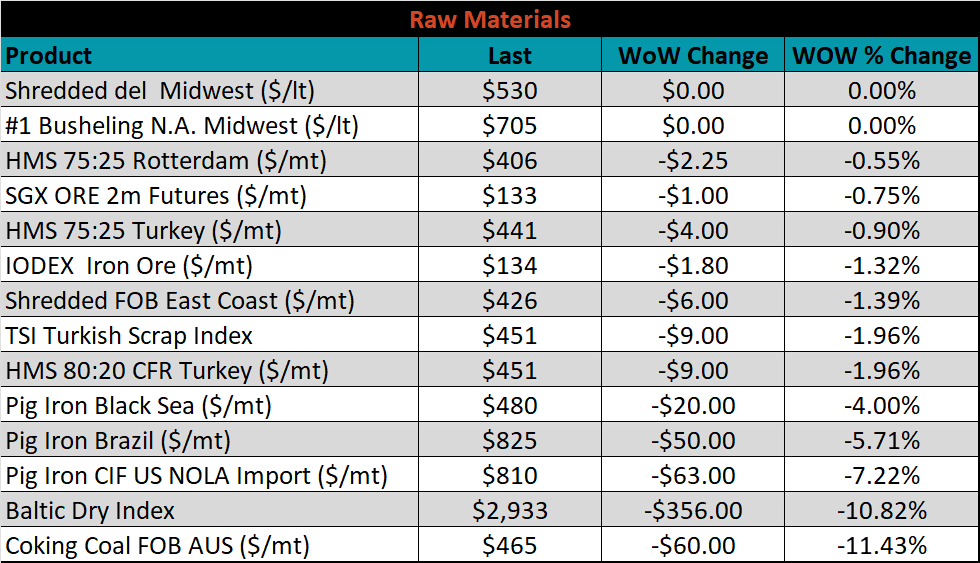
Raw material prices were all lower this week, led by Aussie coking coal, down 11.4%.
Below is the iron ore future curve with Friday’s settlements in orange, and the prior week’s settlements in green. Last week, the front of the curve moved slightly lower, while the back of the curve was unchanged.

The ex-flat rolled prices are listed below.


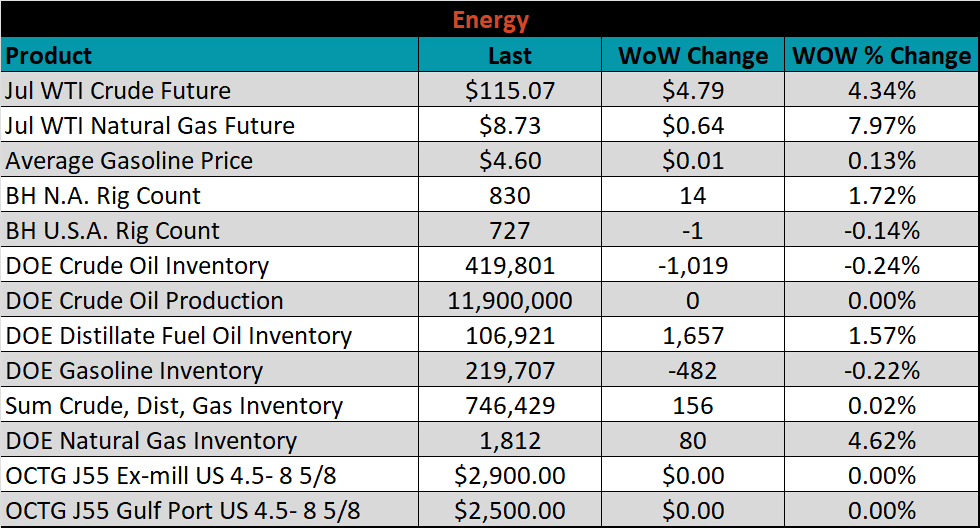
Last week, the July WTI crude oil future gained $4.79 or 4.3% to $115.07/bbl. The aggregate inventory level was up 0.2% and crude oil production rose 11.9m bbl/day. The Baker Hughes North American rig count was up 14 rigs, while the U.S. rig count was down 1 rig.


The list below details some upside and downside risks relevant to the steel industry. The bolded ones are occurring or highly likely.
Upside Risks:
Downside Risks: