Content
-
Weekly Highlights
- Market Commentary
- Risks


Physical transaction volume remained sparse over the past week as mill continue to raise their offer prices above $500/st for HRC and buyers refuse to move higher. As we move into the beginning of June, mill’s desire to drive the spot index higher is apparent. The spot index price during the second week of the month is used for monthly contracts, and mills tend to refrain from negotiating during this stretch leading up to the index printing. Additionally, mills have kept a significant portion of their production idled, restraining supply in the market and supporting the price. These dynamics have led to transaction volumes plummeting in the physical market, and the volume in the derivatives market has followed. The CME HRC curve has been remarkably stable in the same $15/ton range over the past 5 weeks, giving everyone opportunities to trade at the current price levels. The forward price stability has driven the volatility down, and we will dive into the implications of lower volatility levels this week.
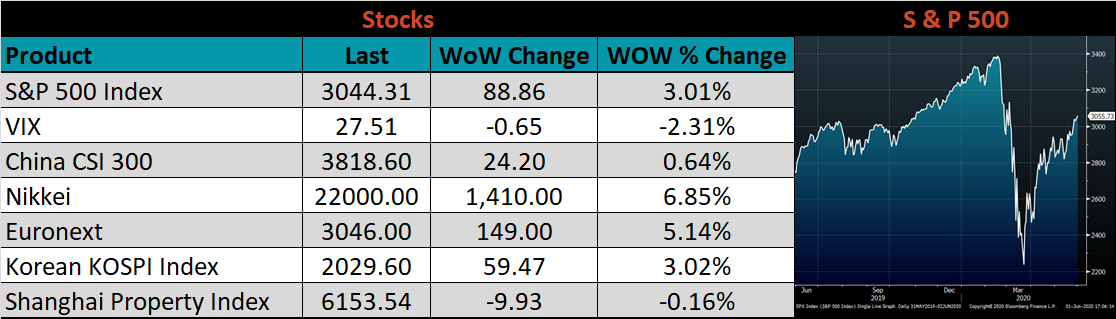
Volatility is a statistical measure based on the size of the daily changes in price. In many asset classes, volatility readings are closely watched as active options markets are used to wager on the movements in volatility. For example, the VIX measures implied volatility in the S&P 500 and is often called a “Fear Index” because increases in the index imply higher costs to protect stock portfolios from losses. The chart below shows the 10-day historical volatility for the rolling 5th month HRC future.
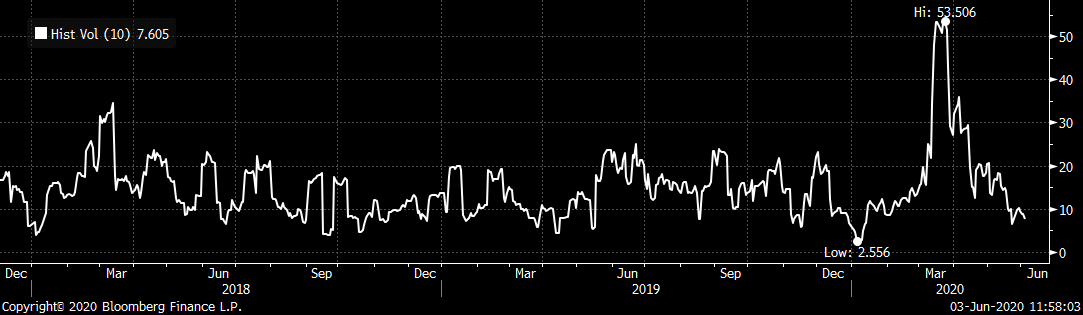
The recent spike in volatility occurred as the coronavirus outbreak drove the forward curve below $500. As the prices on the curve bottomed and began to recover, volatility fell back to historical levels, indicating further downside risks had subsided. The declines in volatility coincided with the rally in price. However, over the past month, prices on the curve have been very stable, while volatility has continued to grind lower, reaching historically low levels.
With “fear” leaving the market, along with low imports and domestic supply, high raw material costs and an economic recovery, why have future prices not continued to increase? Put simply – the supply outlook. Inventory levels across the supply chain increased as economic activity grinded to a halt this quarter. It will take several months for end users to work through this material. More importantly, mills are currently operating at significantly depressed utilization rates, and will attempt to bring that production and supply to the market as soon as possible. As the spot price increases, there is a better probability that mills will ramp up production sooner due to the increasing cost they incur as capacity is idled.
The forward curve is showing expectations for the spot price to continue higher through the month of June, and to flatten near $530. This signals the anticipation is for some production to be brought online in July. The curve beyond July is extremely flat, giving both buyers and sellers opportunities to hedge against the next price move. Low volatility environments typically do not last long, so we would encourage those looking to protect their business to do so soon.
Below are the most pertinent upside and downside price risks:
Upside Risks:
Downside Risks:
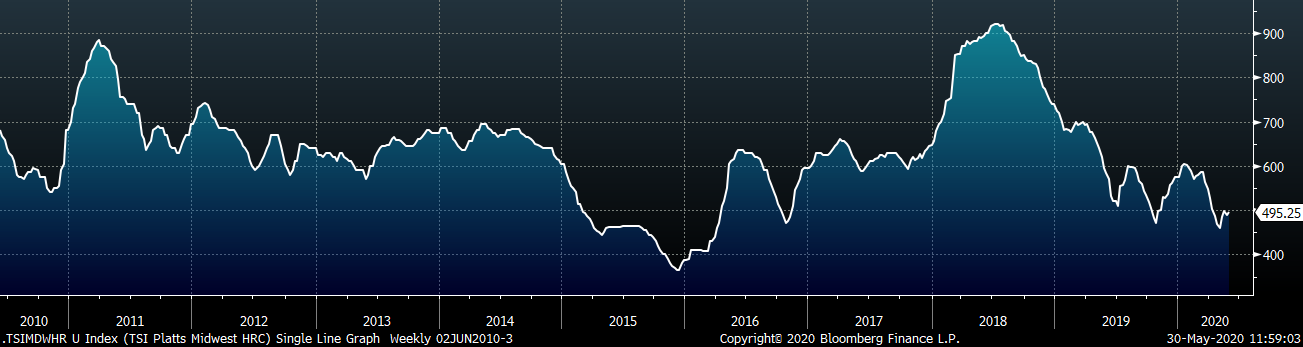
The Platts TSI Daily Midwest HRC Index was down $5.50 to $495.25.
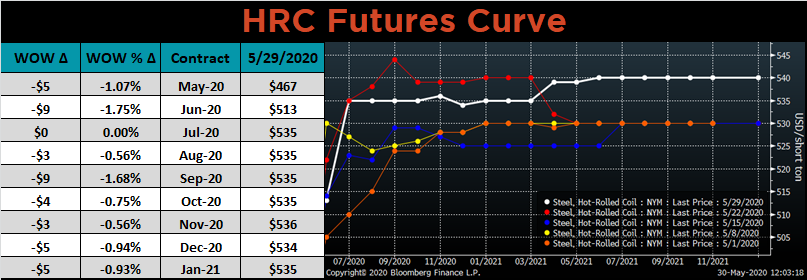
The CME Midwest HRC futures curve is below with last Friday’s settlements in white. The entire curve shifted lower and flattened around $535.
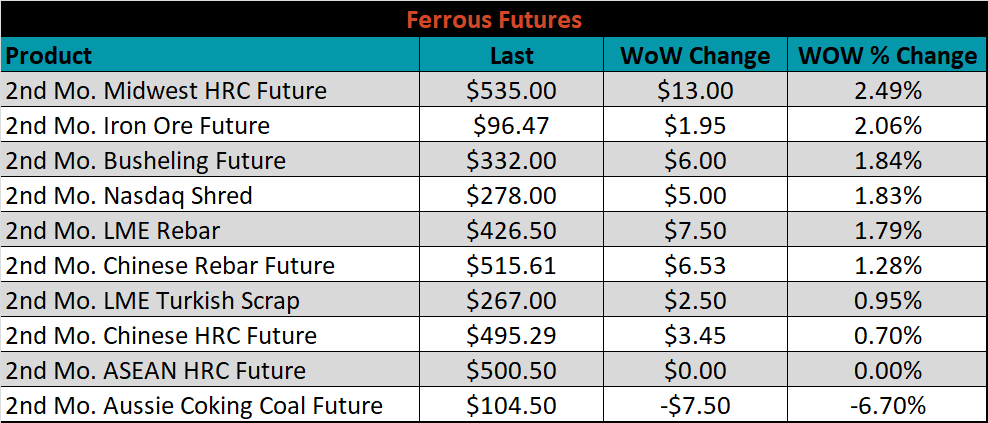
July ferrous futures were mixed. The iron ore future gained 2.1%, while the coking coal future lost another 6.7%.
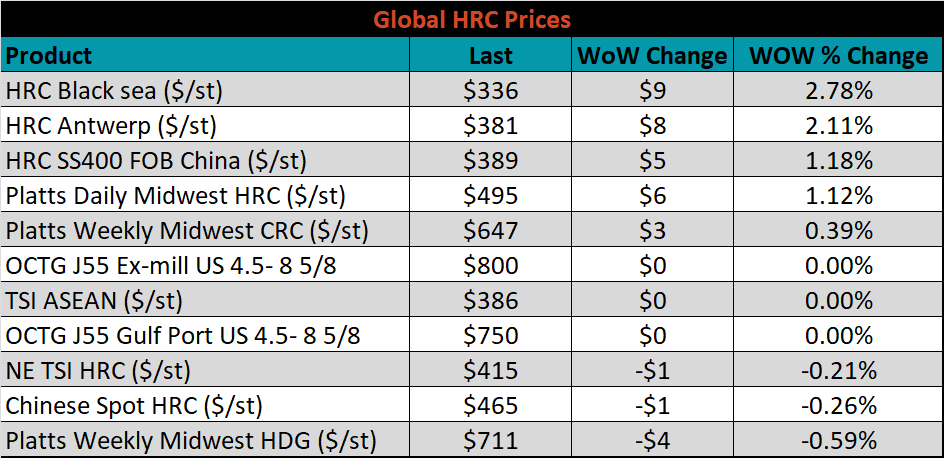
The global flat rolled indexes were mixed. TSI Black Sea HRC was up 2.8%, while Platts Midwest HDG was down 0.6%.
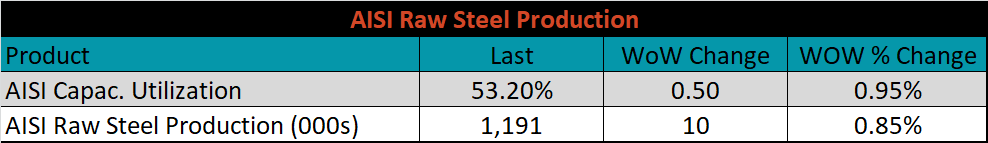
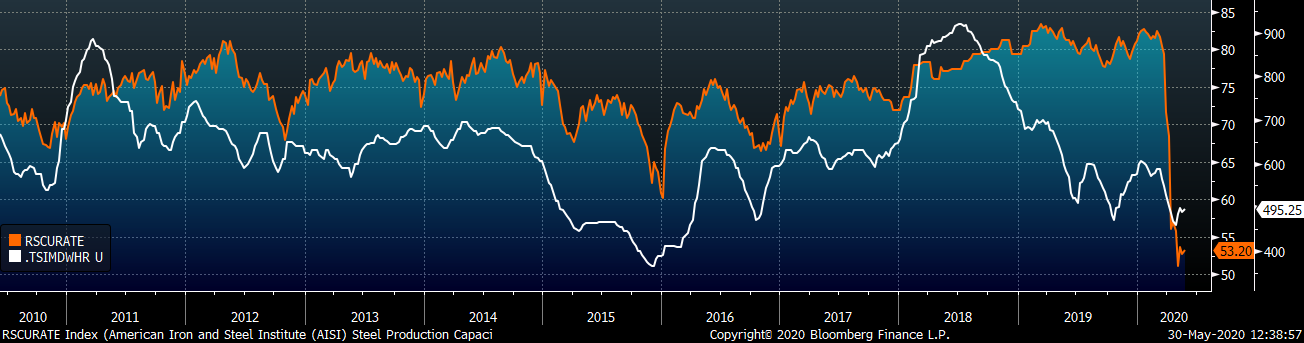
The AISI Capacity Utilization Rate was up 0.5% to 53.2%.
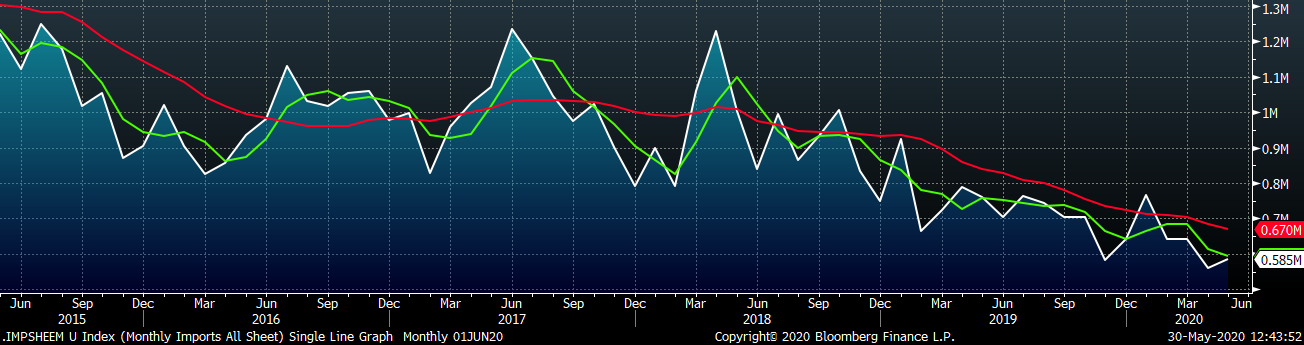
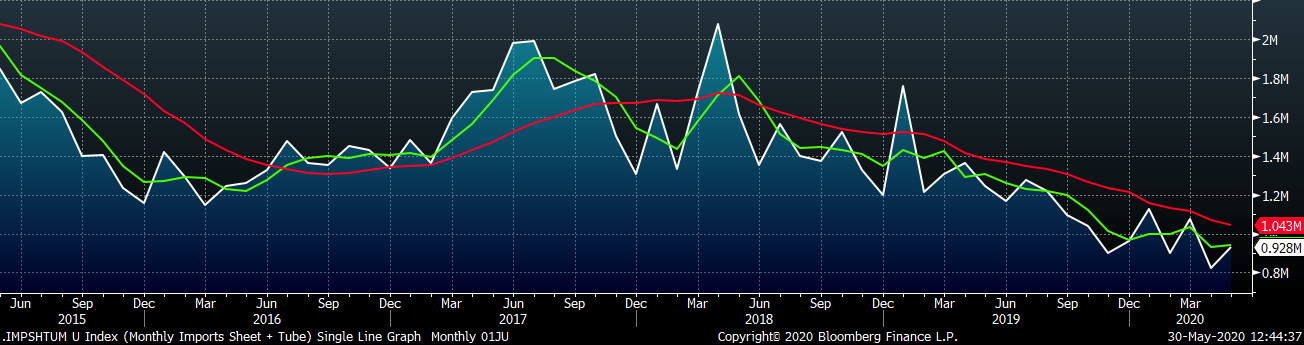
May flat rolled import license data is forecasting an increase of 25k to 585k MoM.
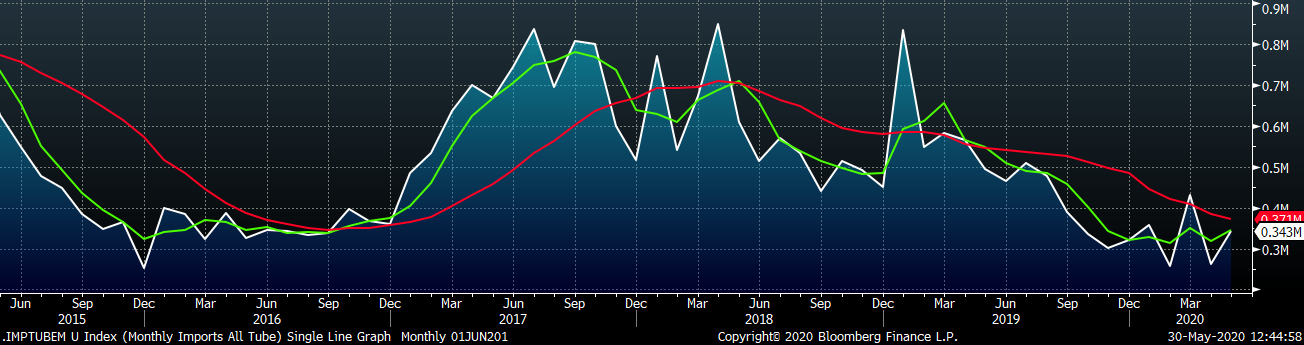
Tube imports license data is forecasting a MoM increase of 81k to 343k tons in May.
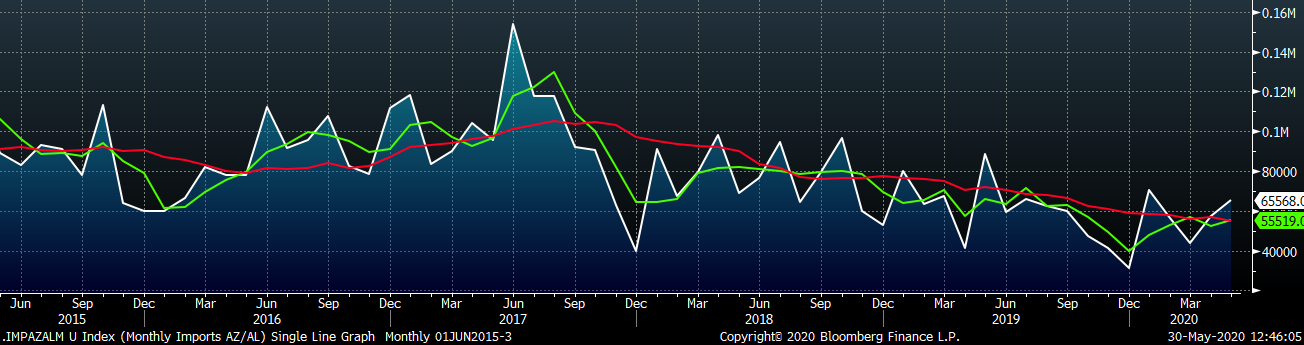
AZ/AL import license data is forecasting an increase of 8k in May to 66k.
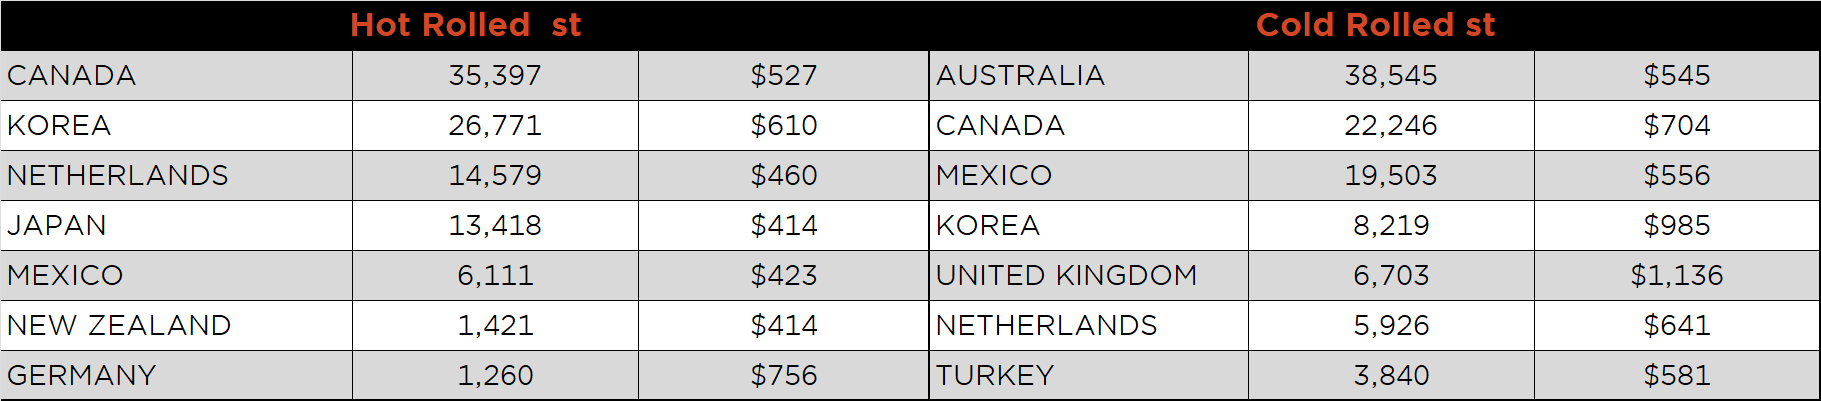
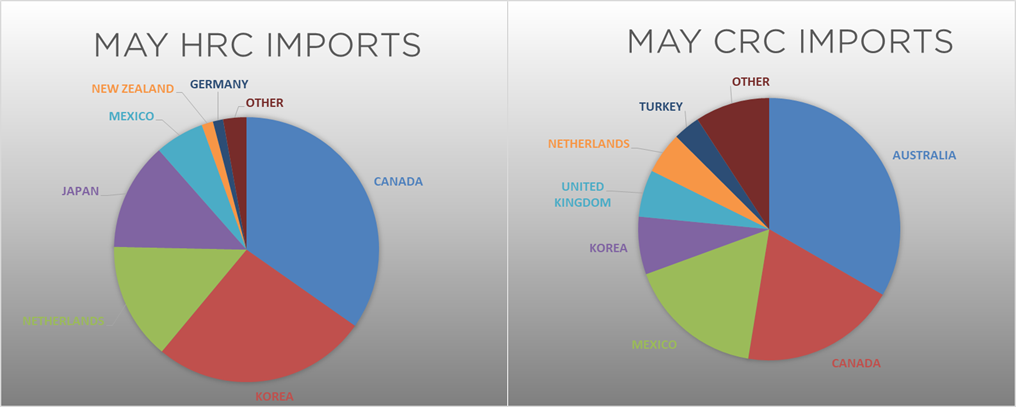
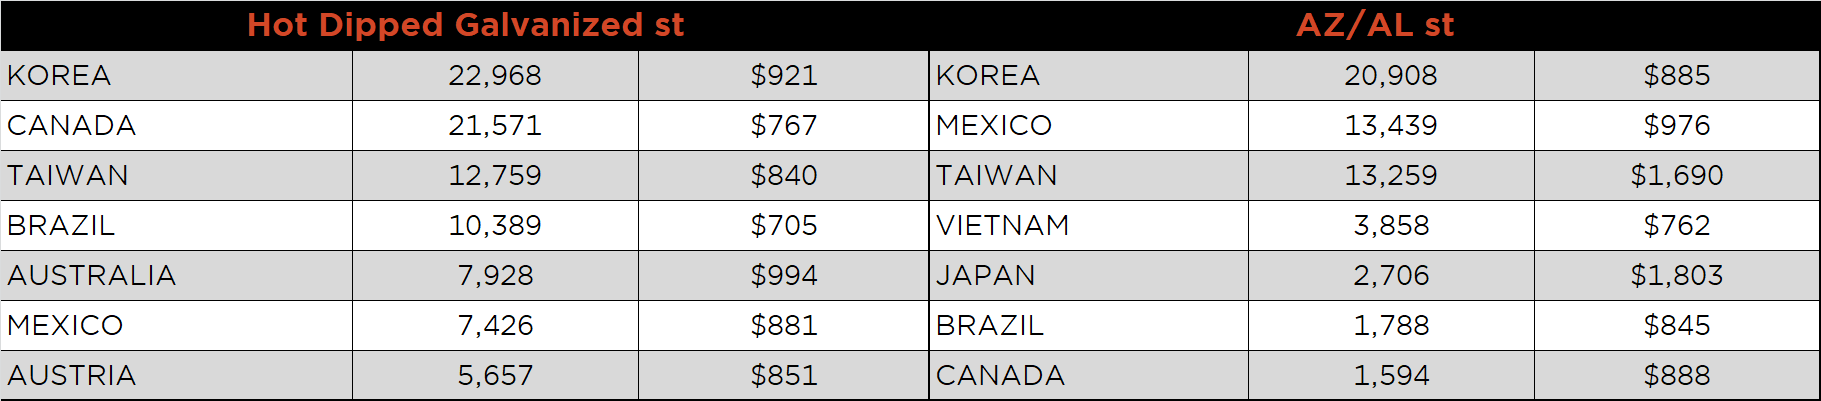
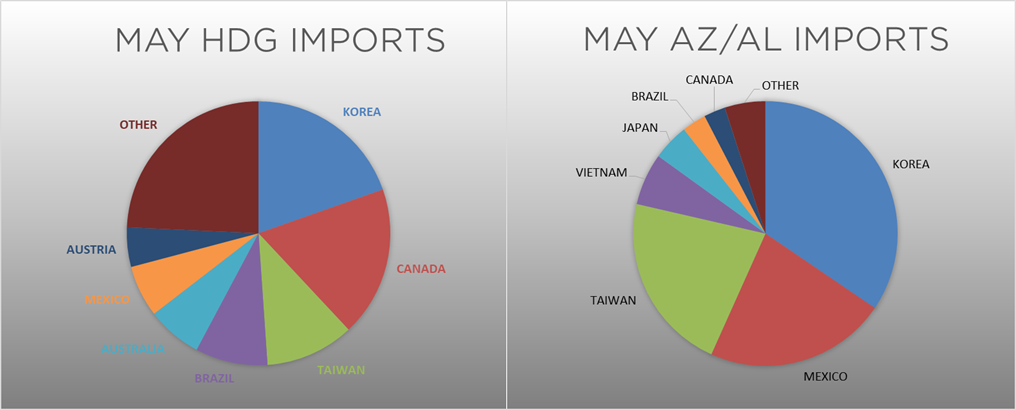
Below is May import license data through May 26, 2020.
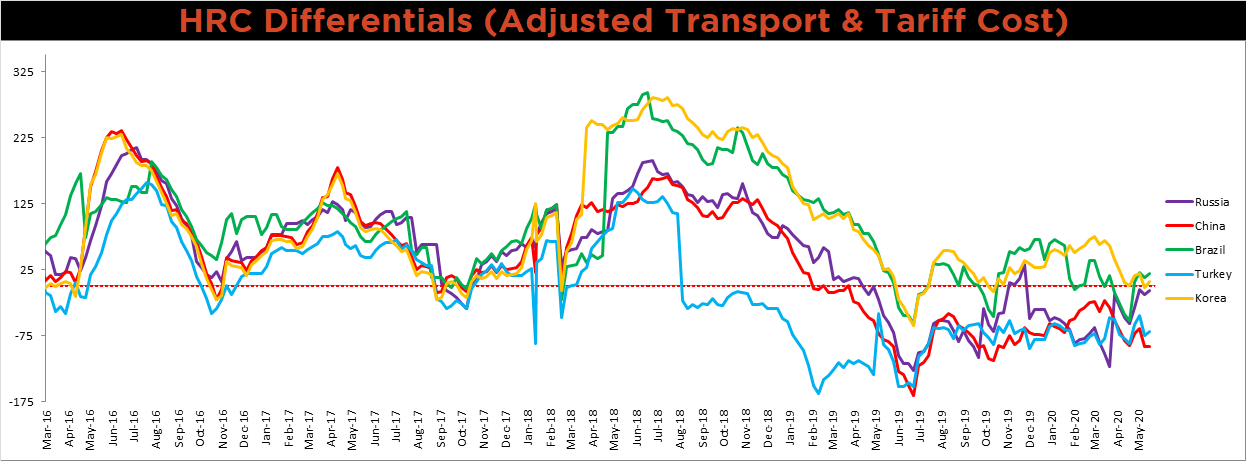
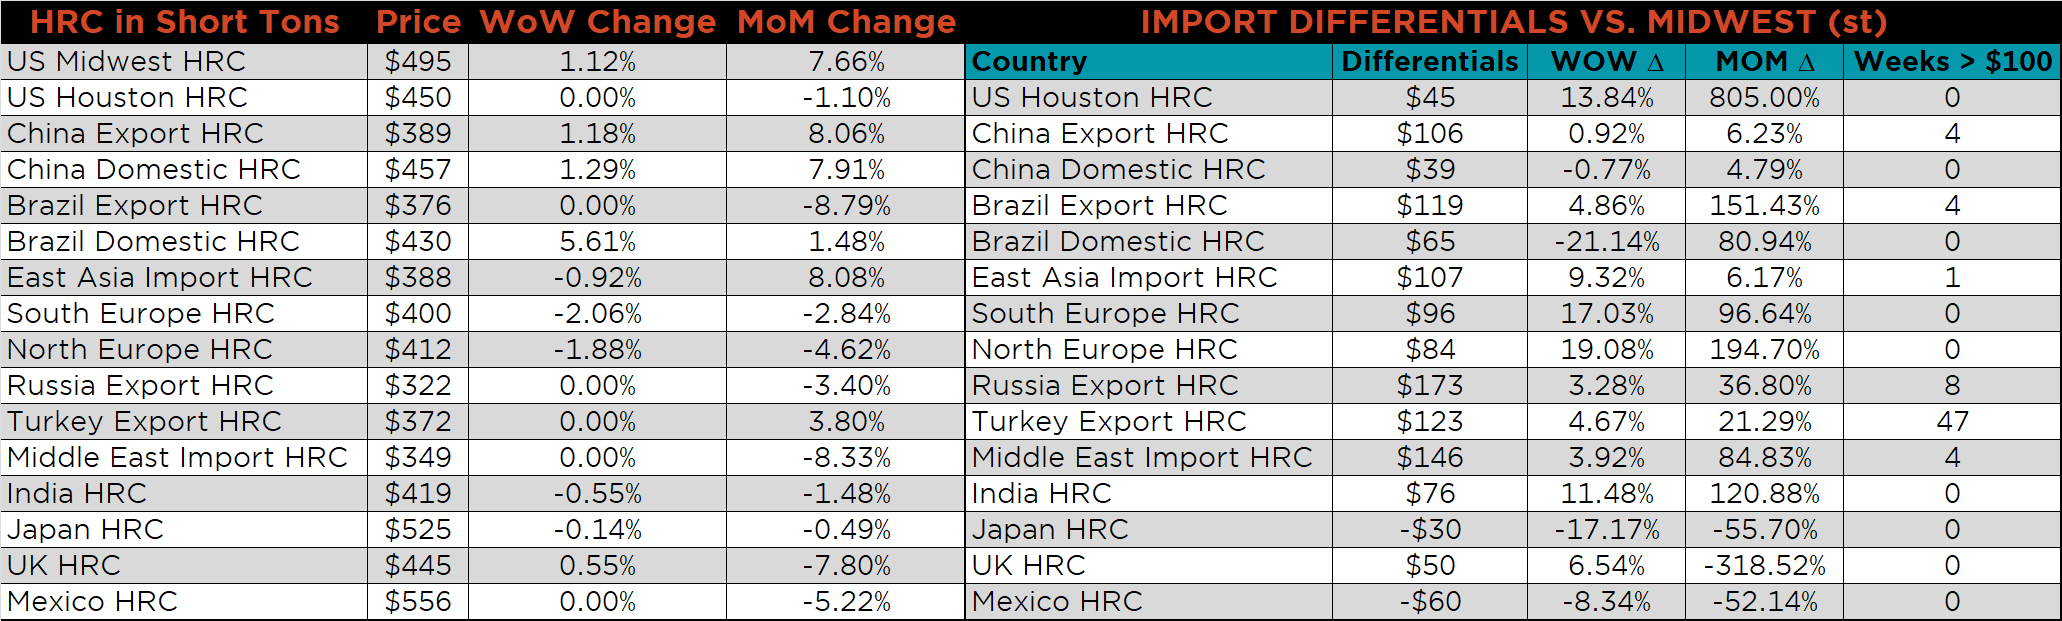
Below is the Midwest HRC price vs. each listed country’s export price using pricing from SBB Platts. We have adjusted each export price to include any tariff or transportation cost to get a comparable delivered price. The Brazilian, Korean, Russian and Turkish differentials all increased, as U.S. domestic price increased. The Chinese price, however, increased slightly more than the U.S. domestic price and its differential decreased slightly.
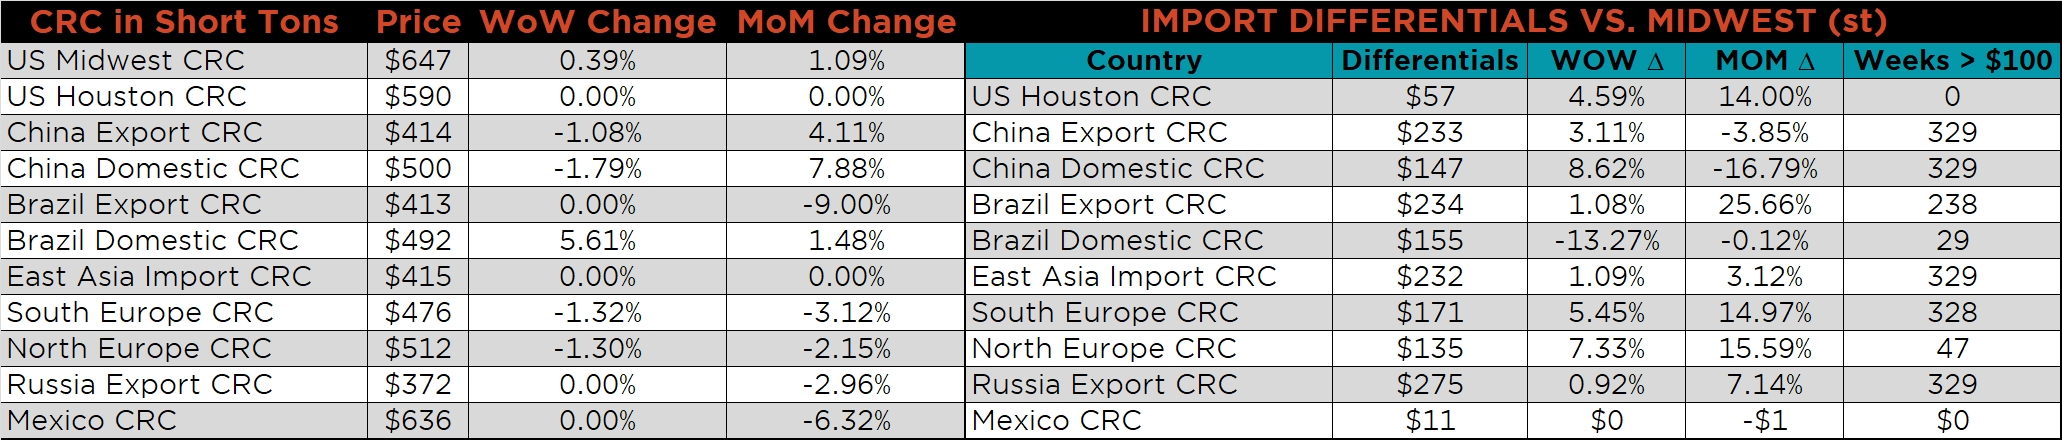
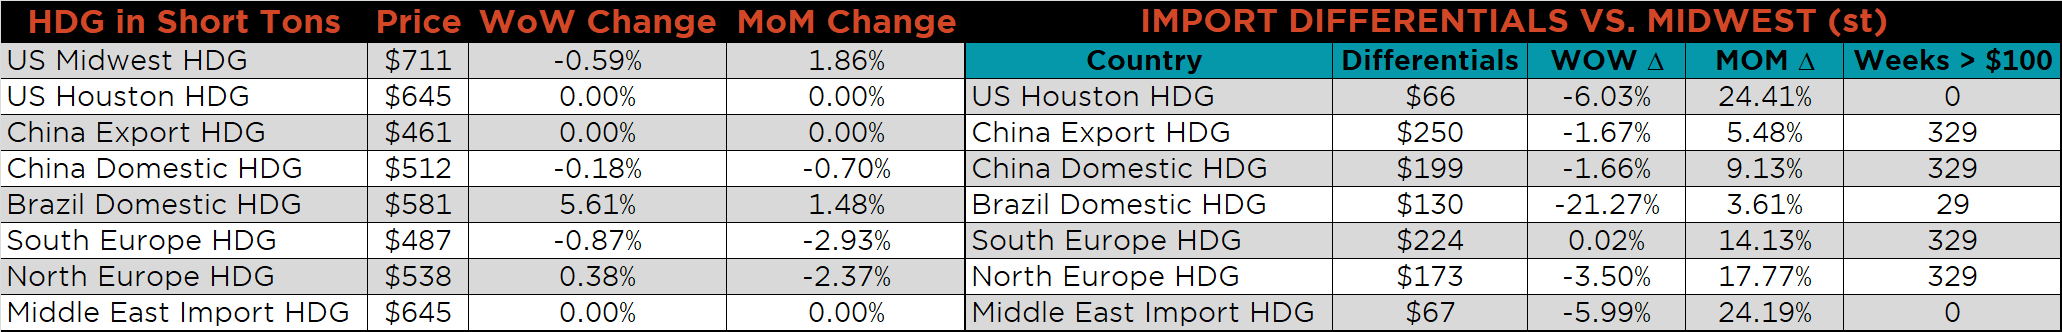
SBB Platt’s HRC, CRC and HDG pricing is below. The Midwest HRC and CRC prices were up 1.1% and 0.4%, respectively, while the HDG price was down 0.6%. Globally, the Chinese export HRC price was up, 1.2%.
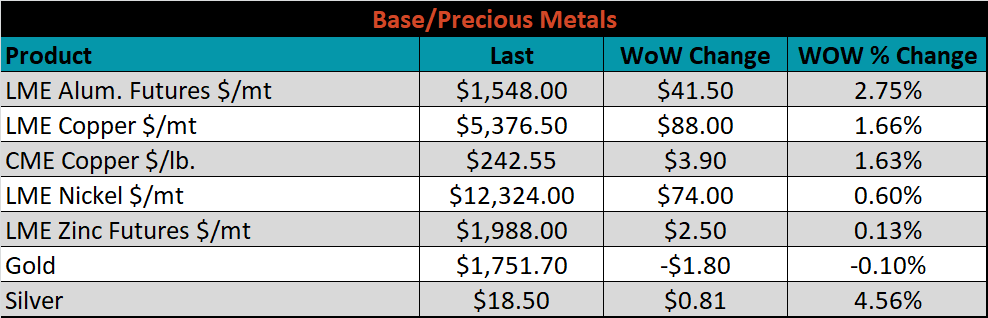
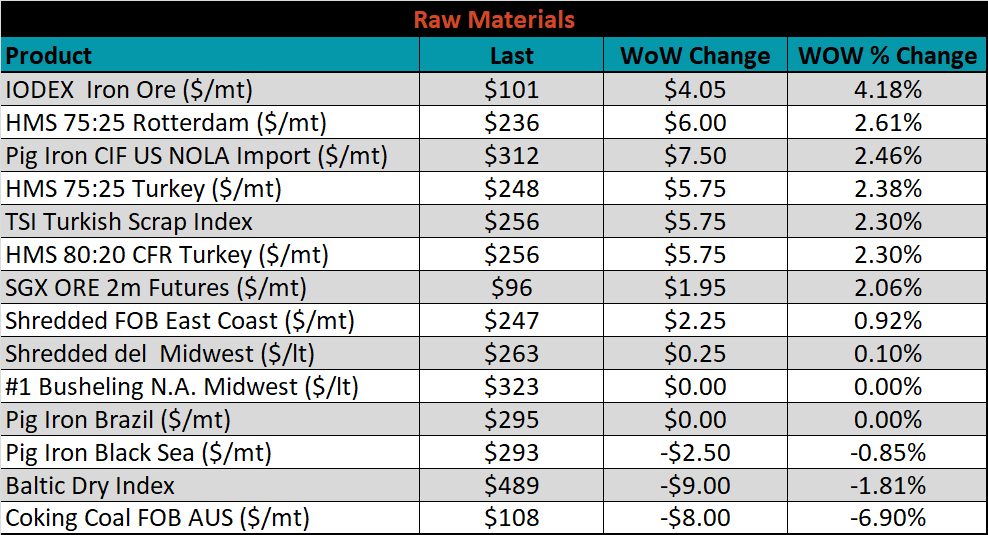
Raw material prices were mixed. The IODEX price was up 4.2%, while Australian coking coal was down another 6.9%.
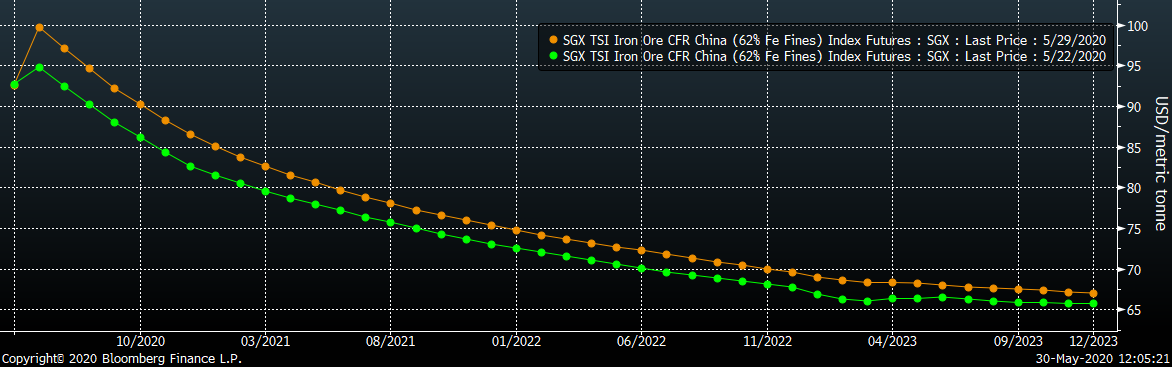
Below is the iron ore future curve with Friday’s settlements in orange, and the prior week’s settlements in green. The entire curve shifted higher for the fourth week in a row, most dramatically in the front.
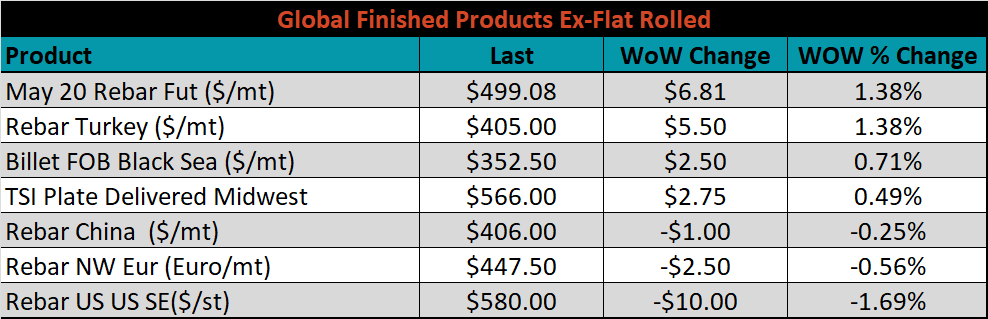
The ex-flat rolled prices are listed below.

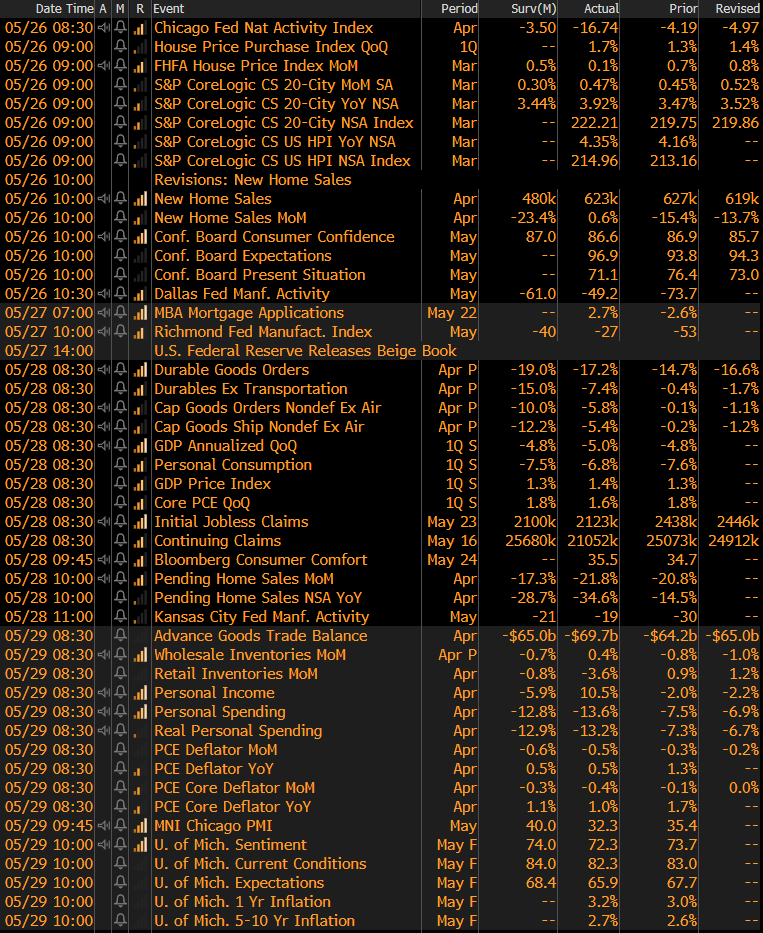
The remaining significant economic data is to the right. The May Chicago PMI printed at 32.3, below expectations of 40 and last month’s print of 35.4. Additionally, the University of Michigan Sentiment, Current Conditions and Expectations Indexes for May all came in just below expectations and below last month’s print. However, The Richmond Fed Manufacturing Index for May came in at -27, above expectations of -40; as did Dallas and Kansas City, at -49.2 compared to -61 and -19 compared to -21, respectively.
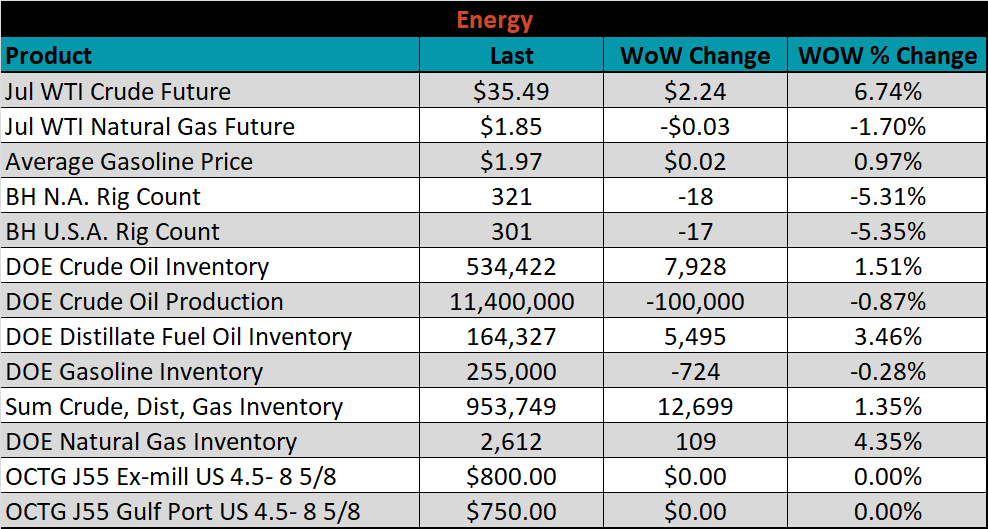
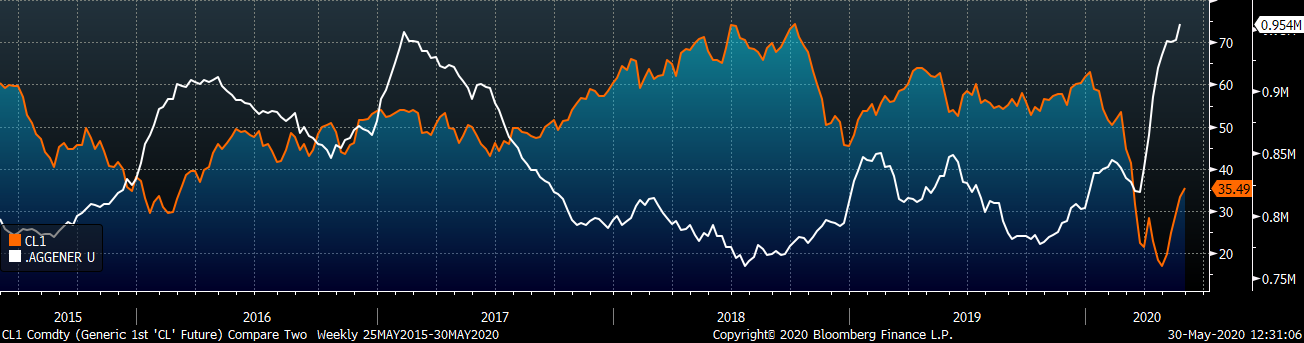
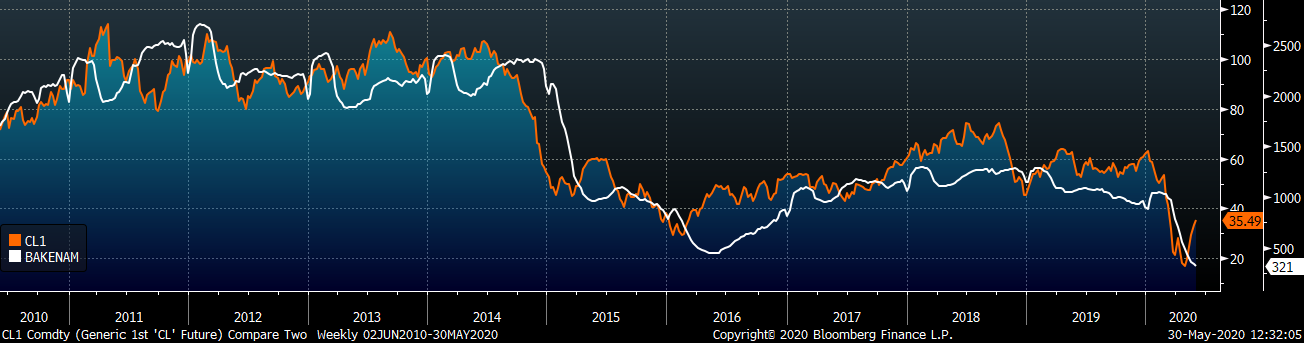
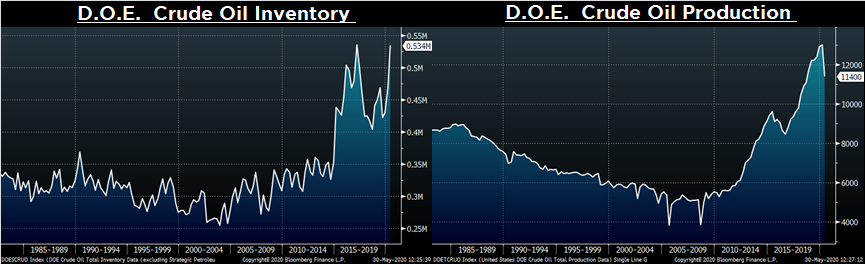
Last week, the July WTI crude oil future gained another $2.24 or 6.7% to $35.49/bbl. The aggregate inventory level was up 1.4%, while crude oil production was down to 11.4m bbl/day. The Baker Hughes North American rig count was down another 18 rigs, and the U.S. rig count was down 17 rigs.
The list below details some upside and downside risks relevant to the steel industry. The orange ones are occurring or look to be highly likely. The upside risks look to be in control.
Upside Risks:
Downside Risks: