Content
-
Weekly Highlights
- Market Commentary
- ISM PMI
- Global PMI
- Construction Spending
- Auto Sales
- Risks


After the price stabilization at the beginning of this year revolved into a dead cat bounce, prices have continued their move to the downside with the market now focused on – Where is the bottom?
Even with the low level of imports, customer and service center destocking amid increased production has weighted on the price. With lead times contracting, buyers have no incentive to restock, preferring instead to delay purchases and obtain lower prices. Last week this report analyzed the profitability of the producers, which has been declining since the peak in July 2018. BOF’s profit per ton is nearing $100 per ton, which was its average for much of 2017. While EAF’s profit per ton is higher, it is also moving towards pre-section 232 tariff levels. If the post tariff prices and profits led the mills to increase production, there must be a price, and profit, level at which they will reduce production. If the mills are no longer obtaining pre-tariff profits, they have no incentive to maintain the additional production.
Lower spot pricing without a decline in production indicates that the market and mills have not yet reached this point. However, there are some indications in the market that this inflection point could be near. First, the world steel price has been strong, especially the China export price, which is a proxy for the Southeast Asia price. Including tariff, profit and transportation charges, this price is above the domestic spot price. Historically, this type of environment has been supportive of U.S. pricing. Second, the future curve has flattened significantly with current prices at or below expected future prices. While the curve is a poor predictor of future spot pricing, this does reflect a change in market sentiment. If steel buyers expect spot prices in the future to be higher, restocking would appear advantageous. Finally, the domestic economic backdrop continues to be supportive with first quarter GDP at 3.1%, an accommodative Federal Reserve with low interest rates and continued job growth.
While we do not believe a bottom has been reached, buyers should closely monitor the market dynamics above, and be prepared for a V-shaped recovery.
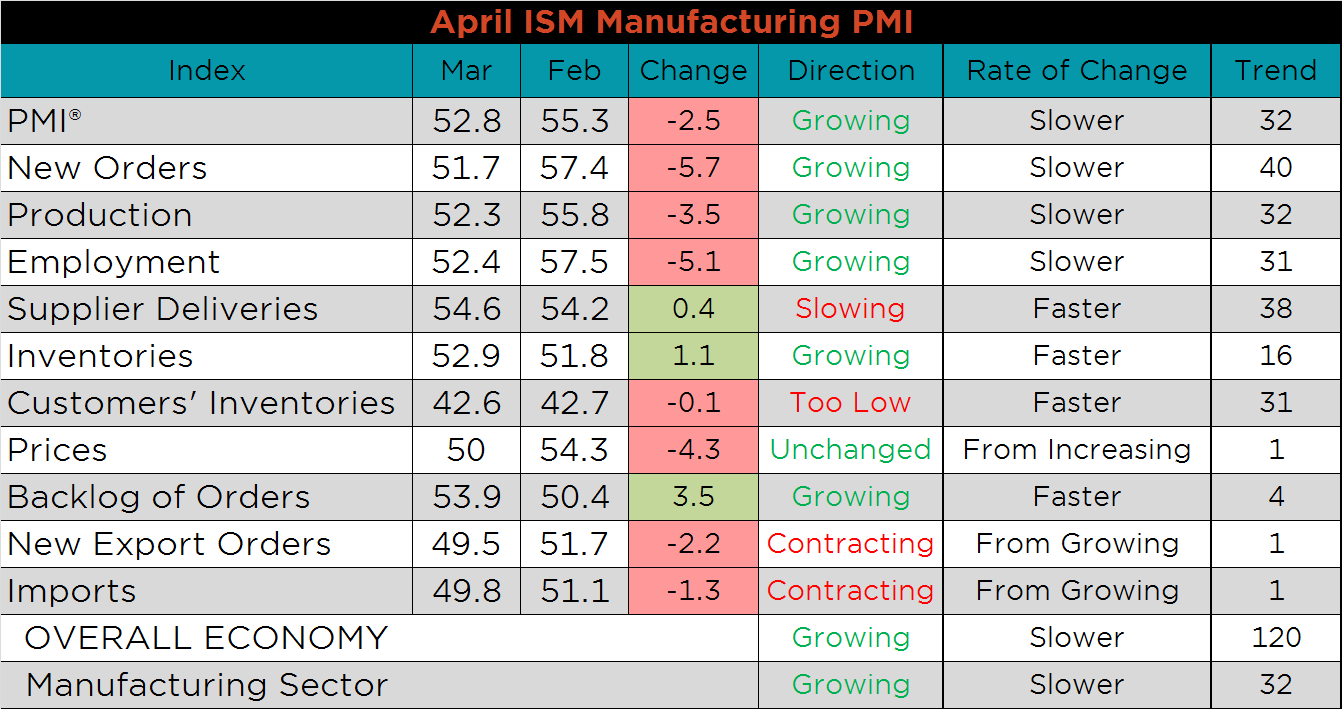
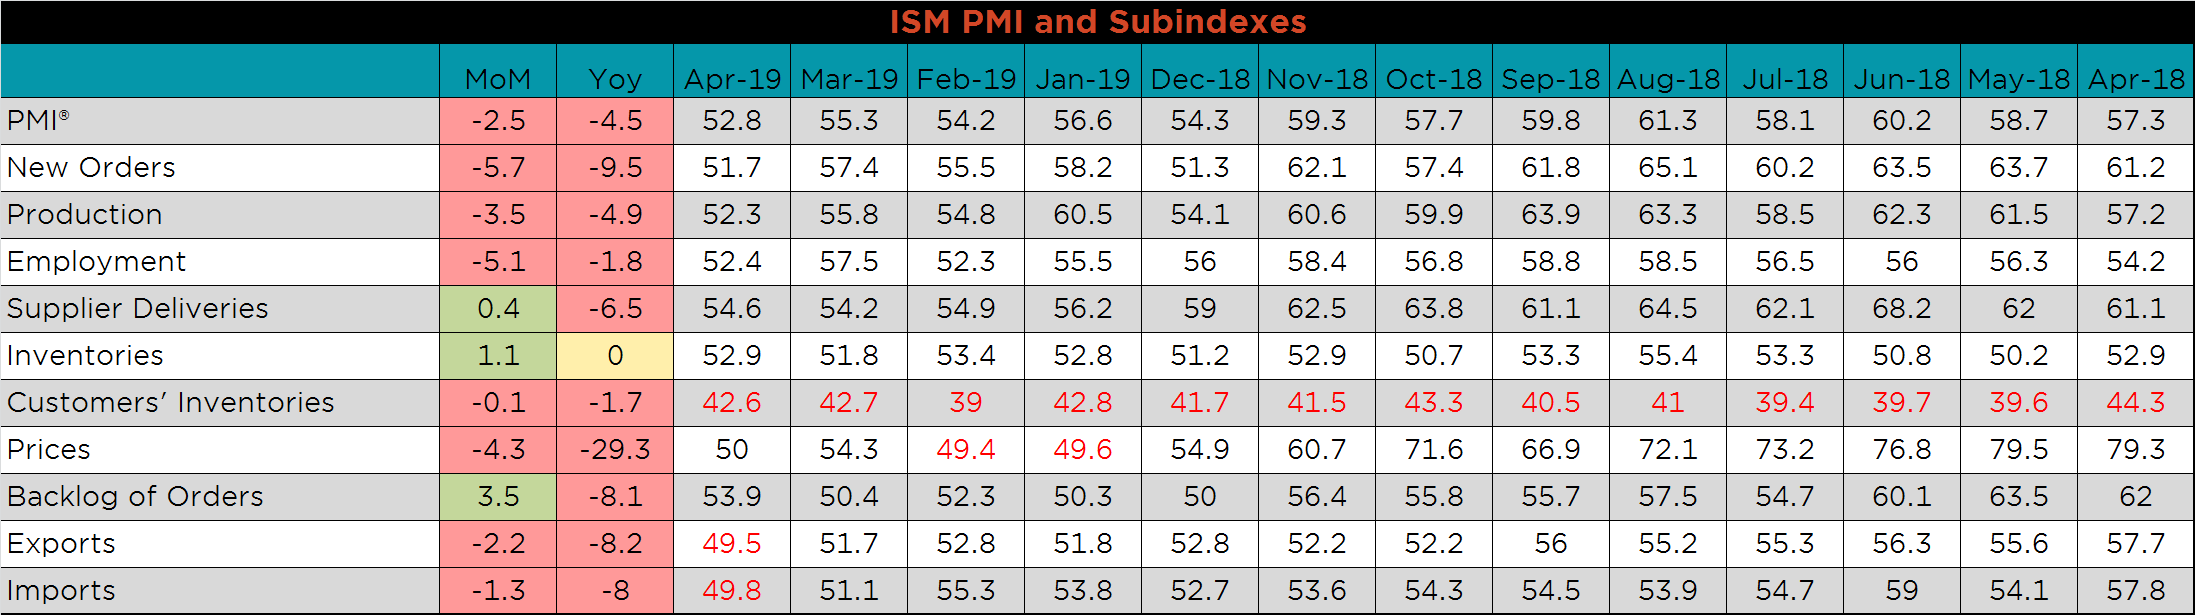
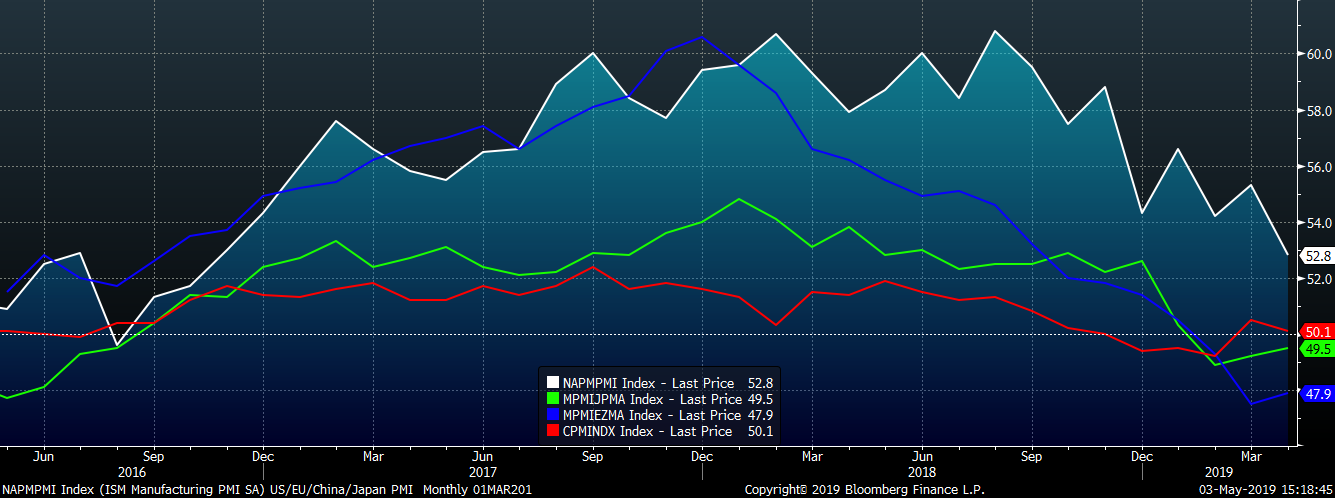
The ISM Manufacturing PMI printed at 52.8 for April, 2.5 points lower MoM. Imports and new export orders fell into contraction along with customers’ inventories. New orders saw the largest decrease, but remain in an expansionary position.
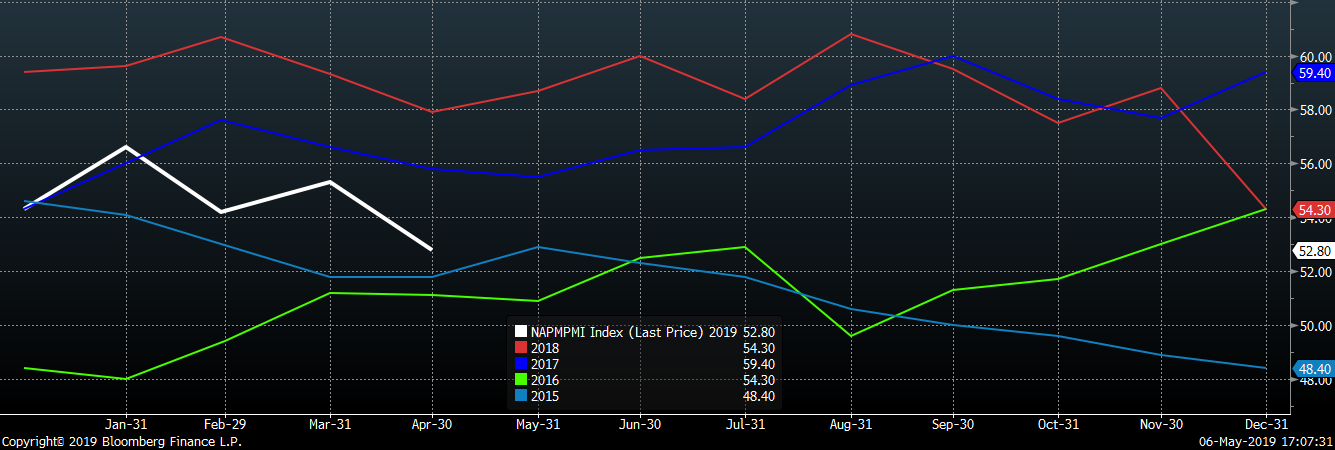
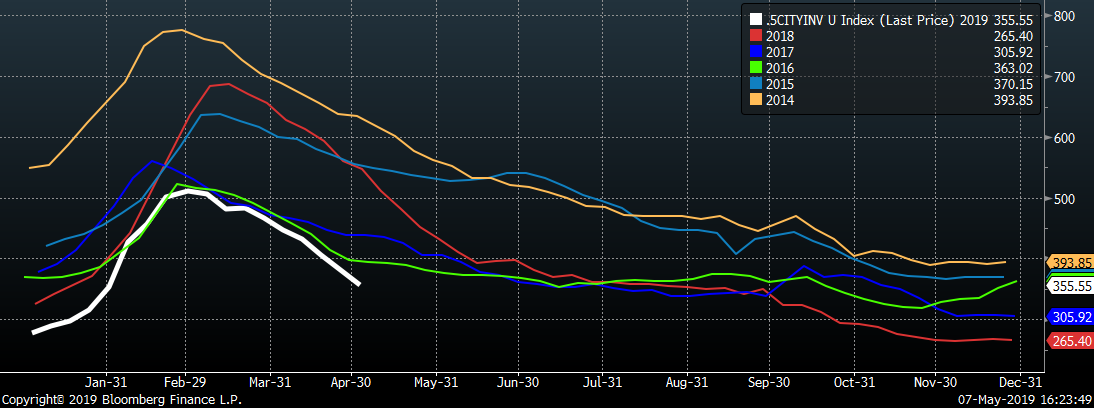
The white line below shows how 2019 is tracking so far compared to the previous 4 years.
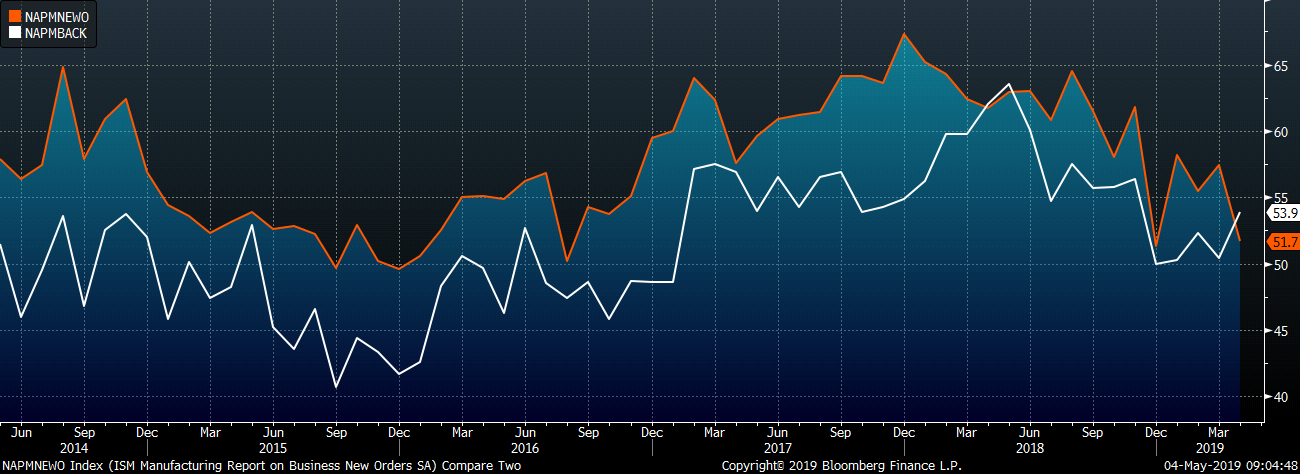
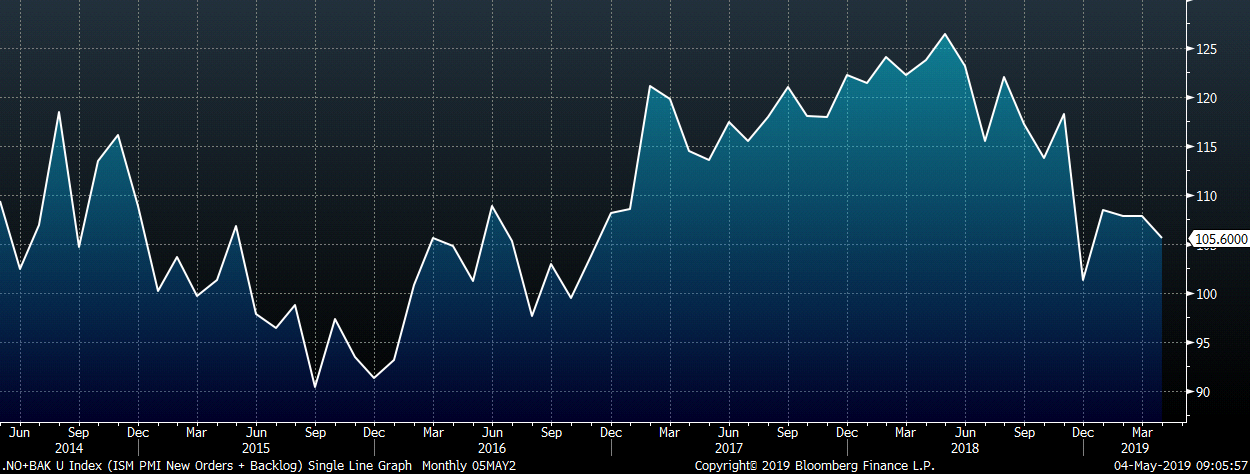
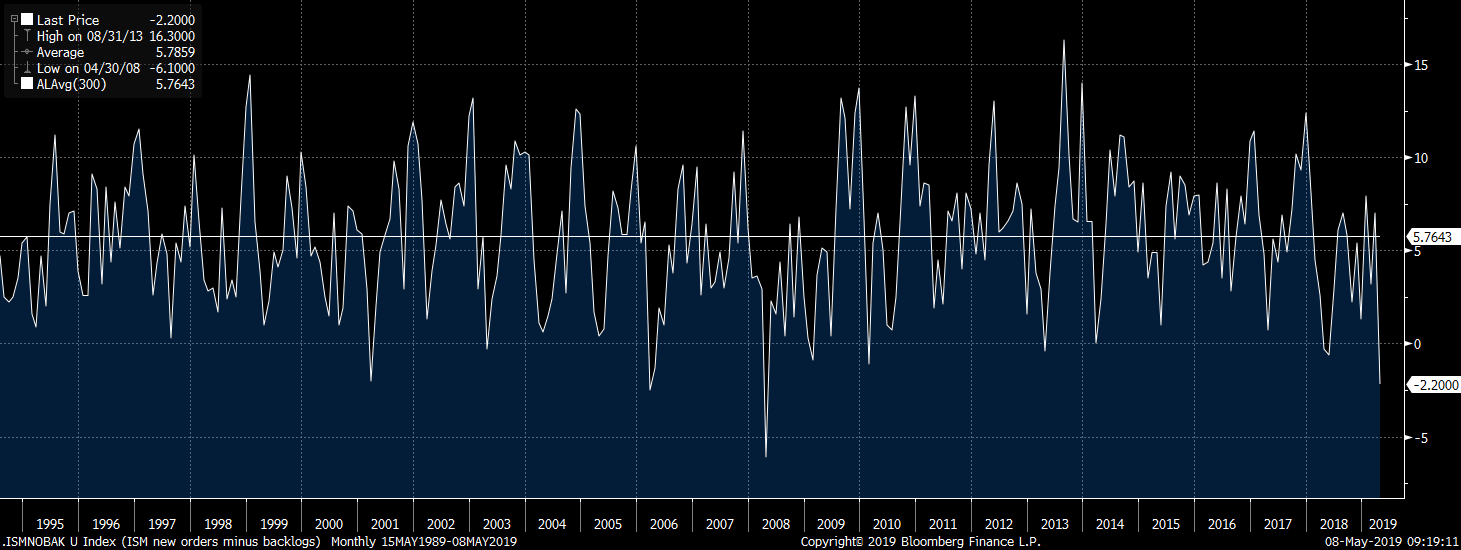
The April ISM new orders subindex fell 5.7 points to 51.7, while the backlog subindex rose 3.5 points to 53.9. The second chart adds the new orders and backlog subindexes to provide a reliable gauge for manufacturing demand. While the drop in the new orders index in April is concerning for the outlook on current demand, the recovery in the backlog index indicates that demand is being delayed rather than restrained. The third chart shows the new order subindex minus the backlog subindex. In the coming months, look for new orders to recover and the new orders and backlog subindexes to return to their historical average.
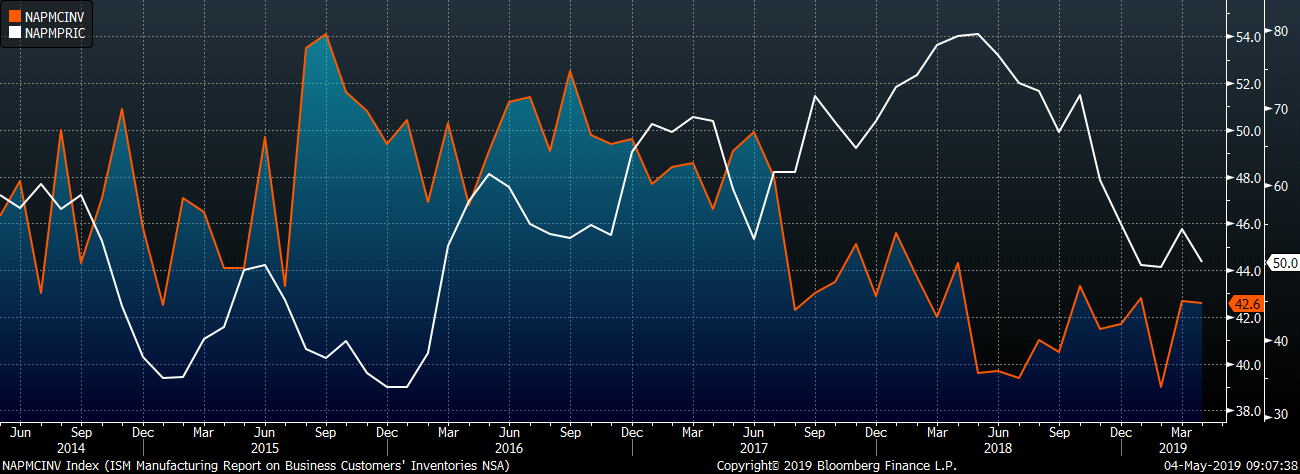
The chart below shows the prices subindex and the customer inventory subindex. There has been a clear trend since Q3 of 2017, customers have held low inventory when faced with higher prices. Prices are down 29.3 YoY and are likely to encourage restocking from customers.
This table shows the monthly ISM PMI and subindexes back to April 2018.
Many of the April global purchasing manager indexes have been fluctuating between contraction and expansion over the last six months. In April, Canada, Austria and Switzerland fell in to contraction, while France, Mexico and South Korea rose in to expansion. The Eurozone and German remain in a contractionary position, but both rose 0.4 and 0.3, respectively.
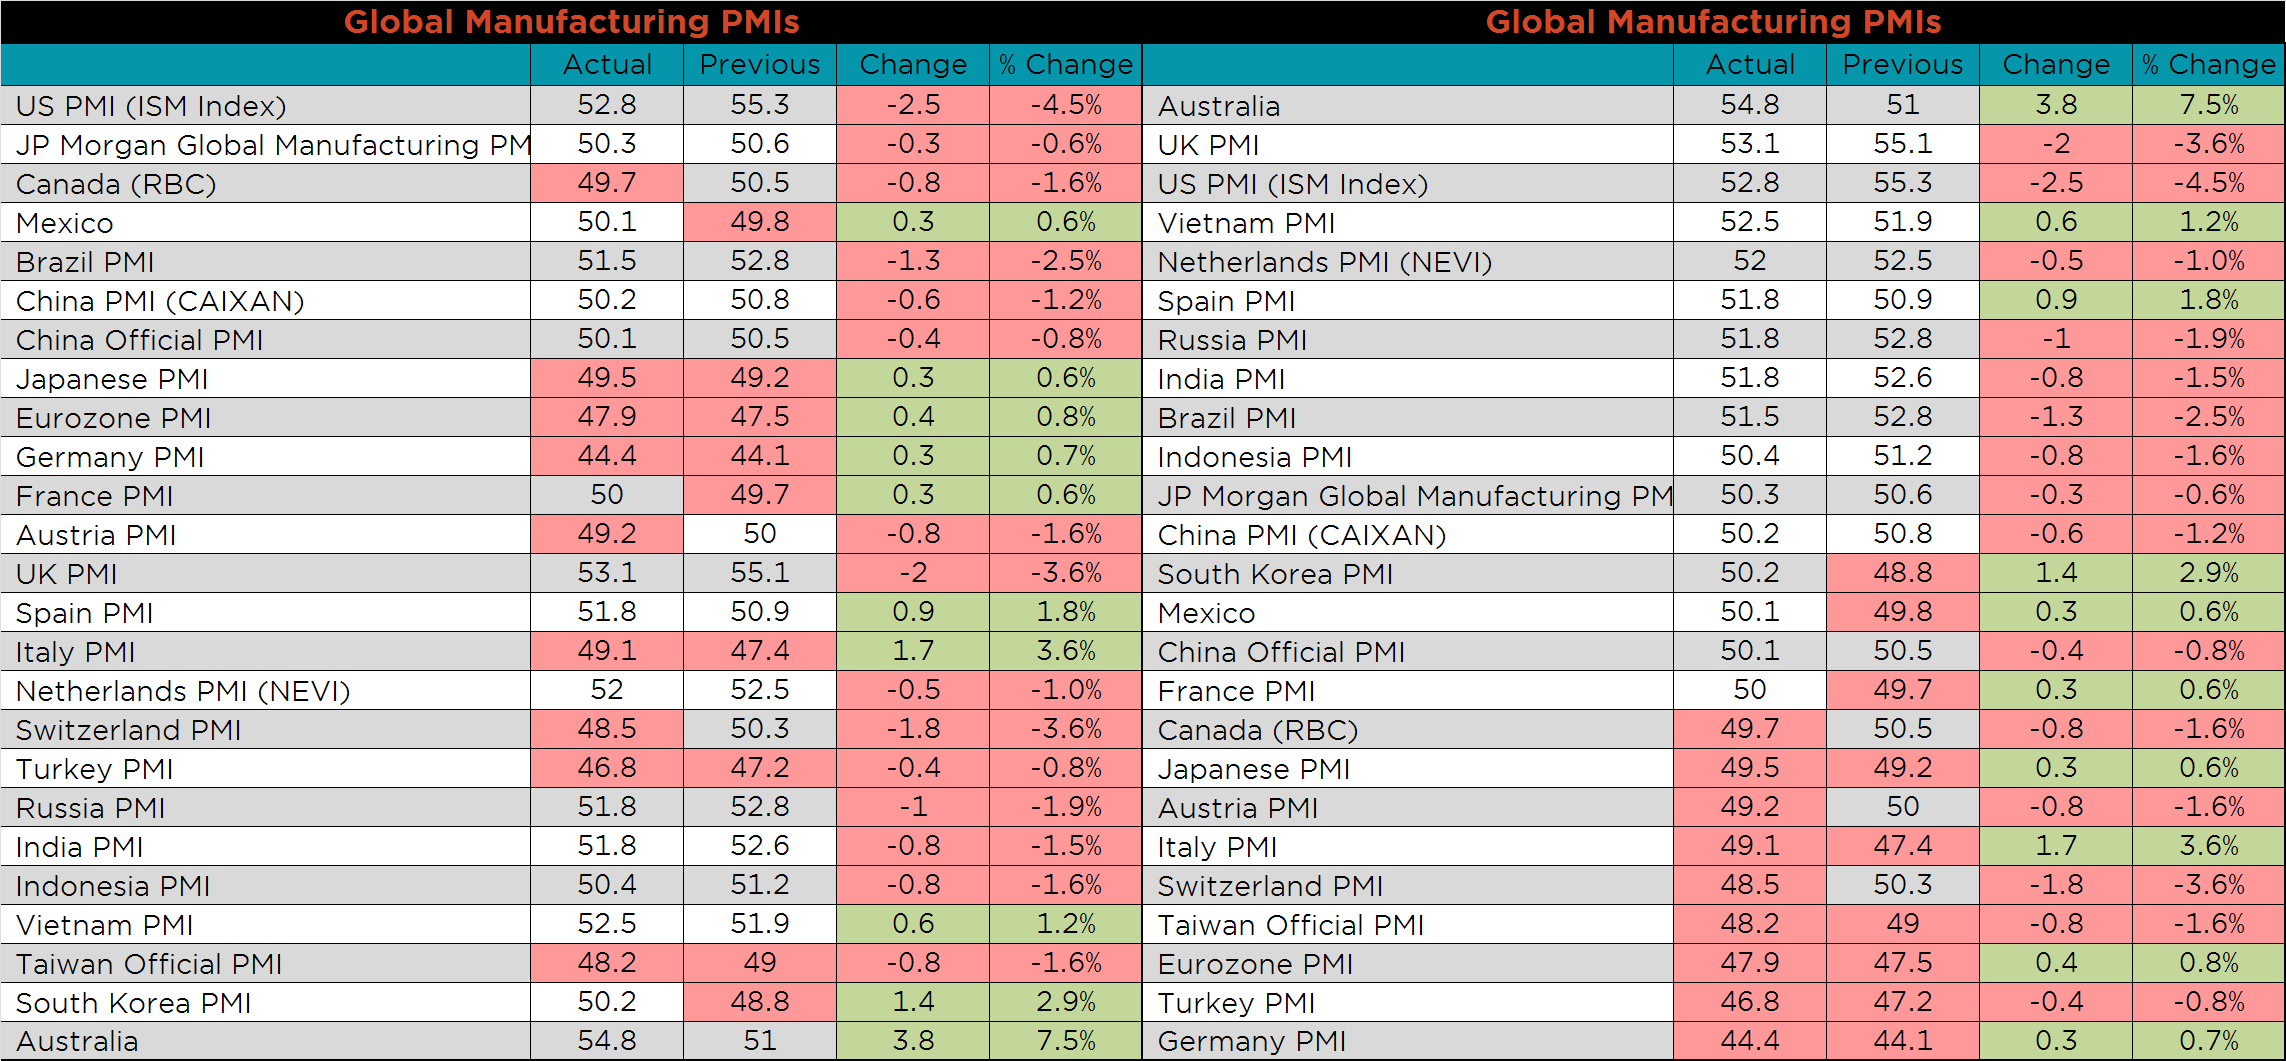
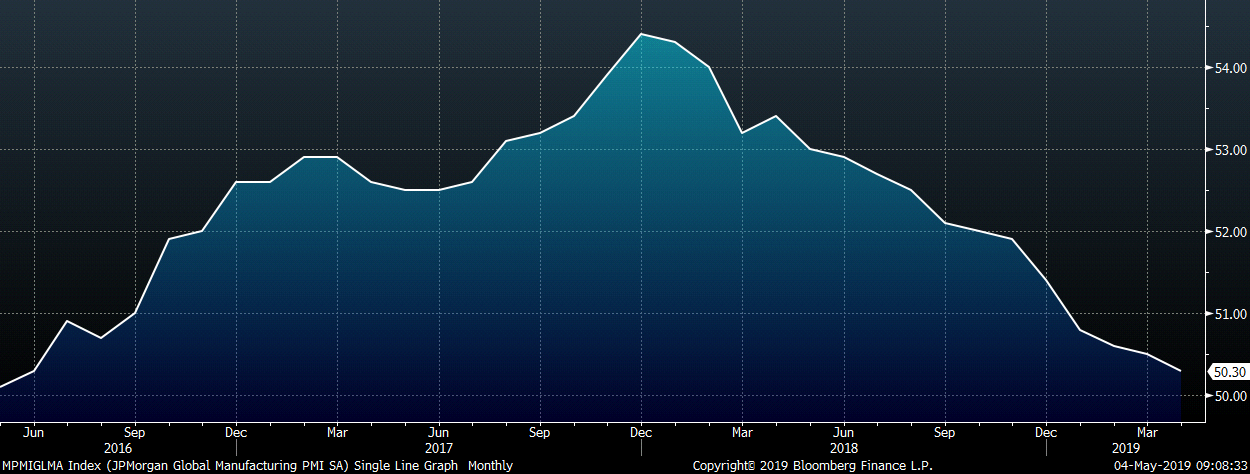
The JP Morgan Global Manufacturing PMI printed down 0.3 MoM to 50.3, the lowest level since August 2016.
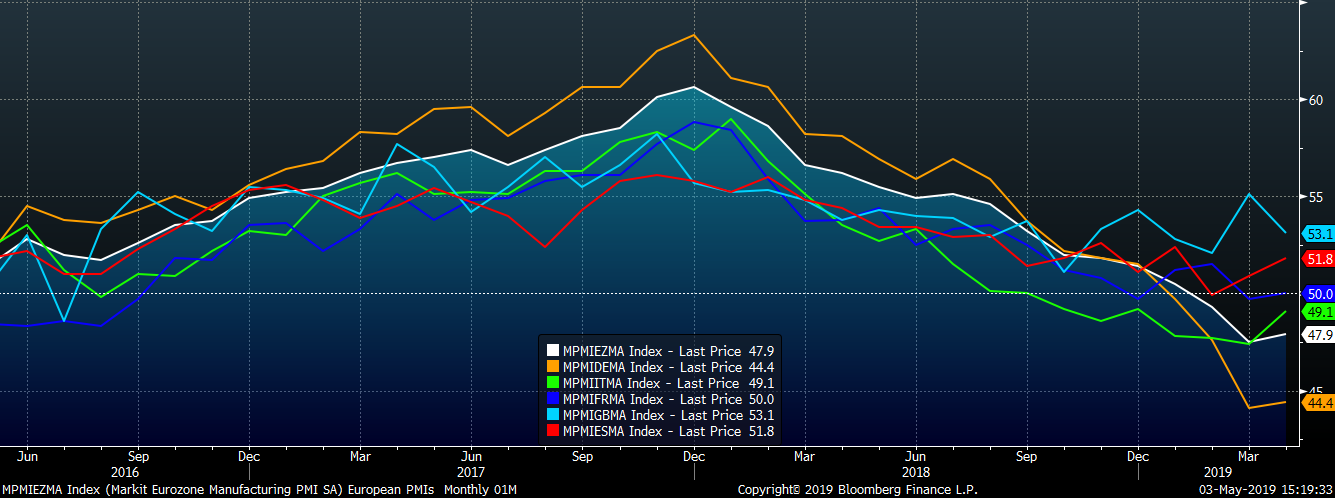
The overall downtrend in European PMIs appears to be over with five of the six country’s PMIs recovering in April. The Eurozone Composite, German and Italian PMIs remain in contraction, while the French and Spanish are in expansion.
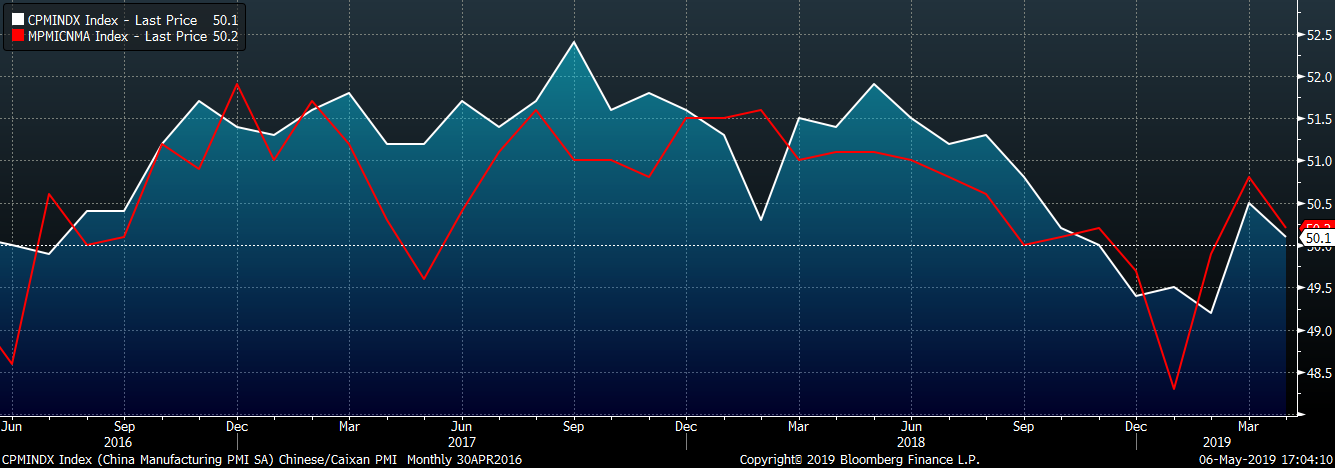
While the Chinese official and Caixan PMIs printed in expansion again in April, they both fell MoM.
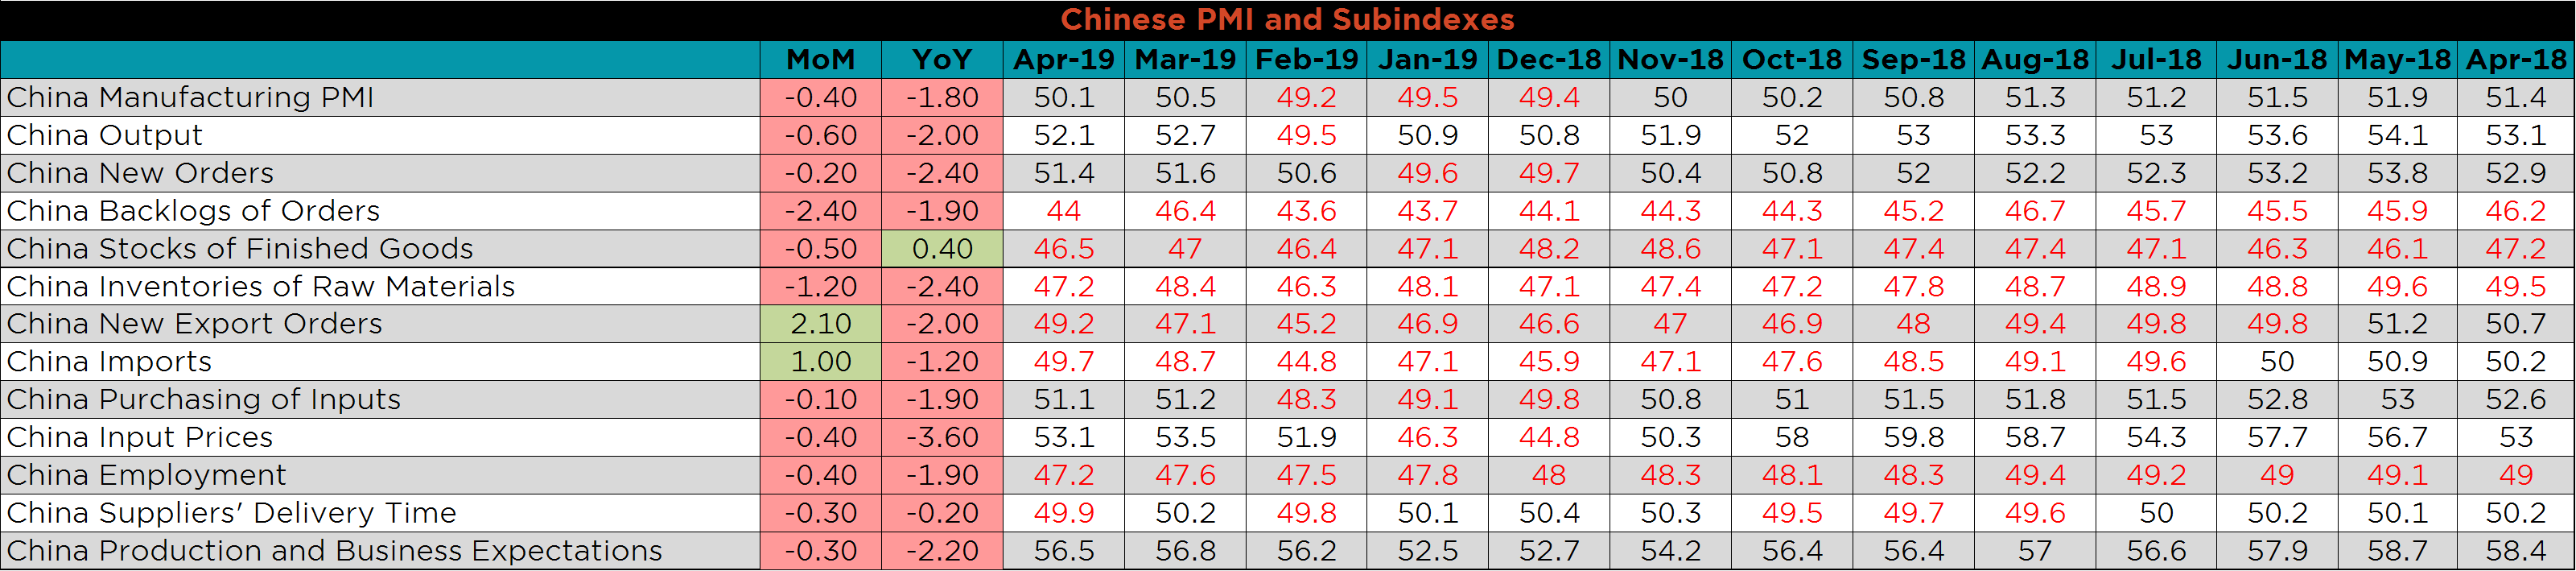
The table below breaks down China’s official manufacturing PMI subindexes.
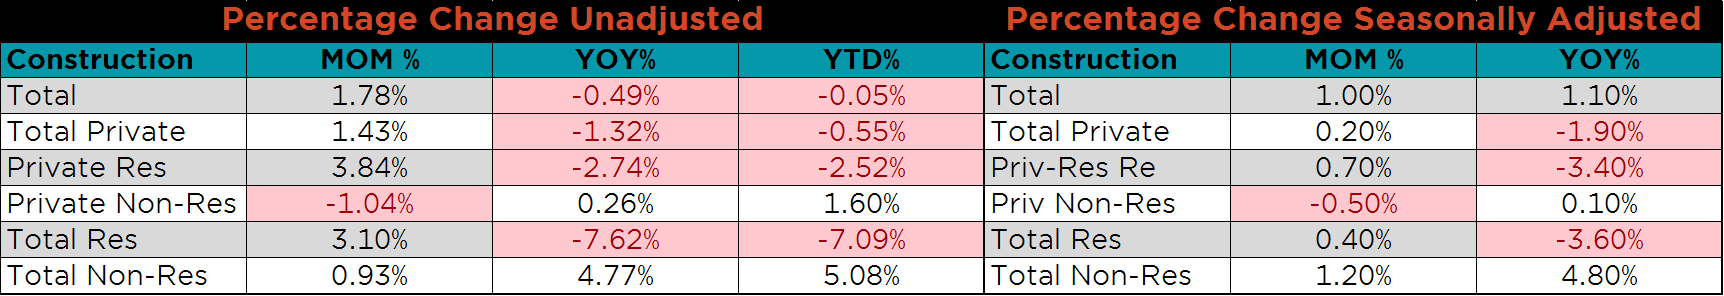
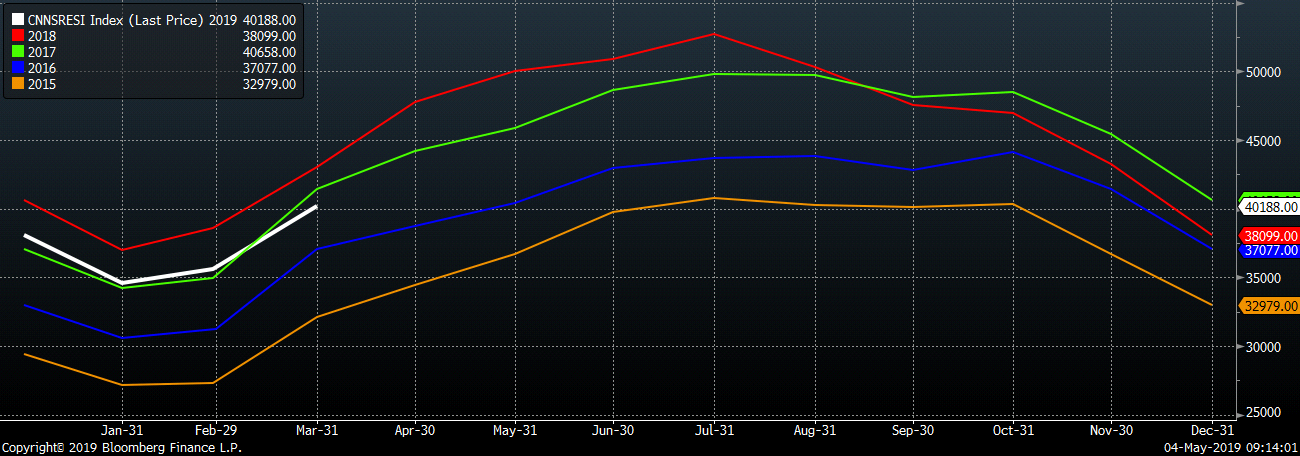
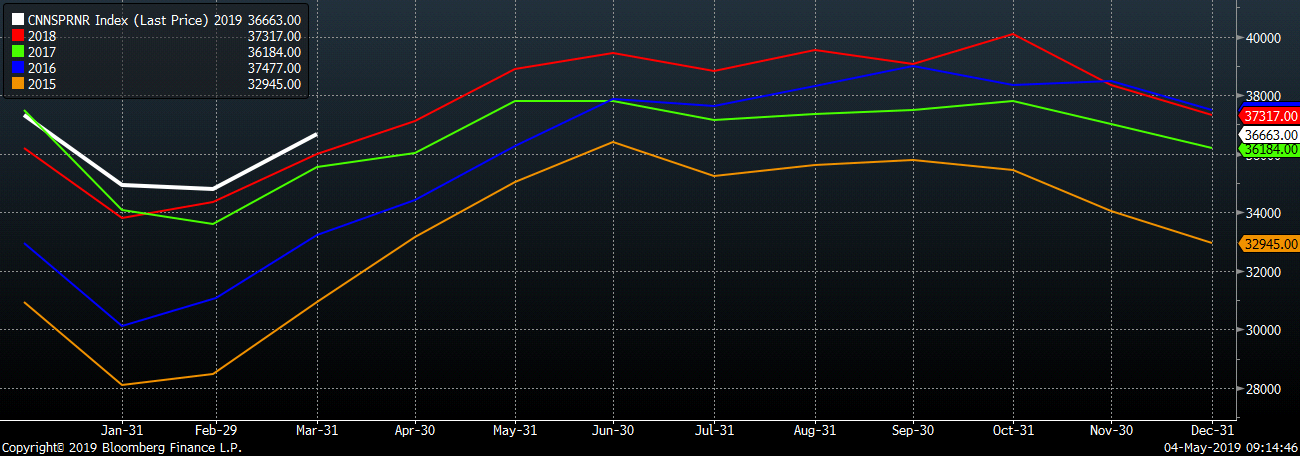
Seasonally adjusted March U.S. construction spending was up 1% MoM, and 1.1% YoY. U.S. residential construction spending was down YoY, but remains the second highest of the last 5 years. The decrease in interest rates this year should help the residential sector. Nonresidential construction spending was higher 0.9% MoM, 4.8% YoY and 5.1% YTD. The strength of nonresidential construction spending is good news for the steel industry, as this is the most steel intensive of the construction segments.
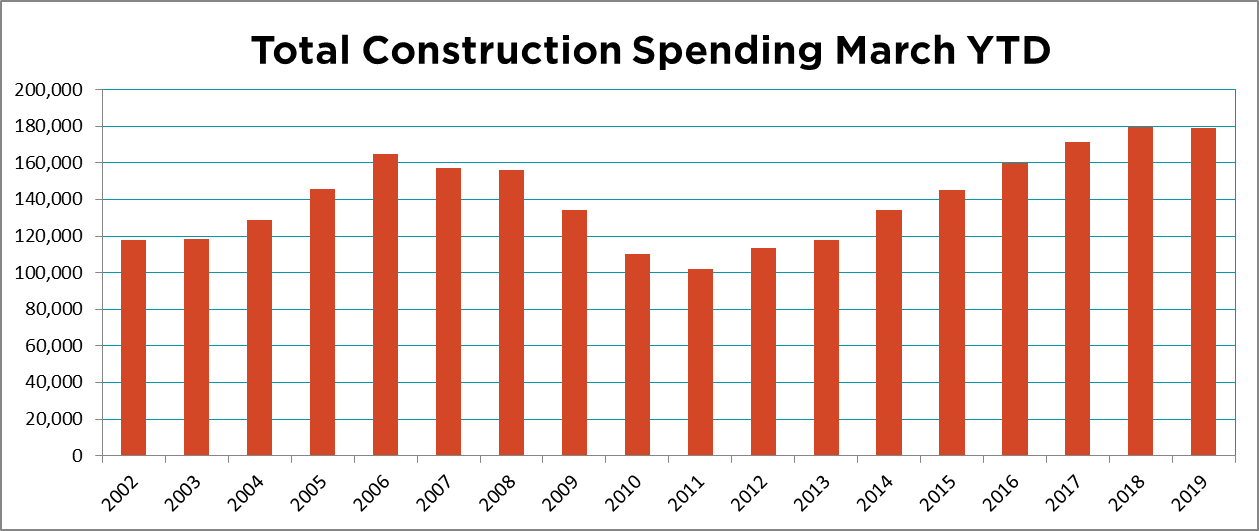
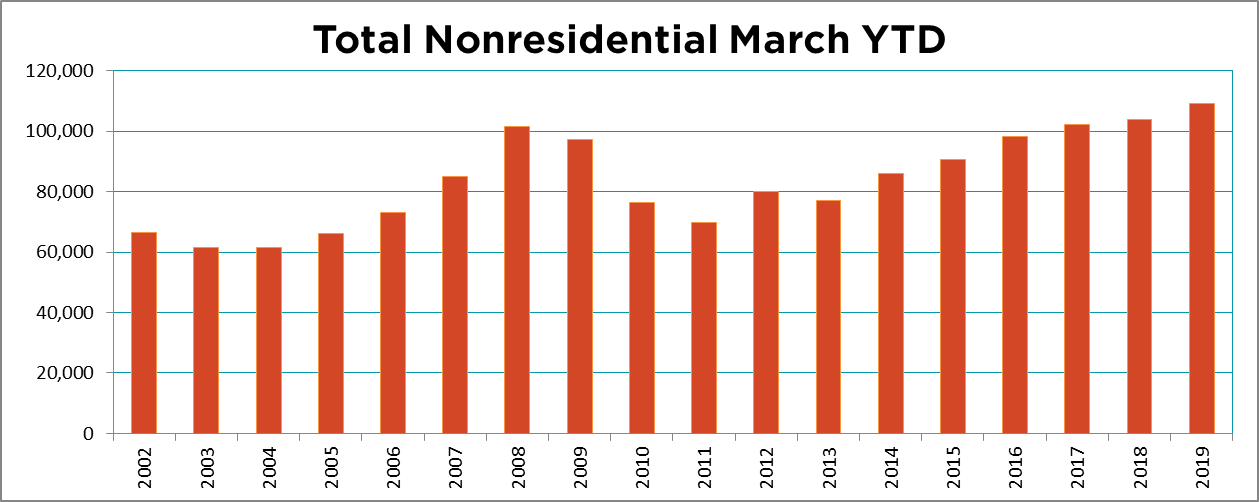
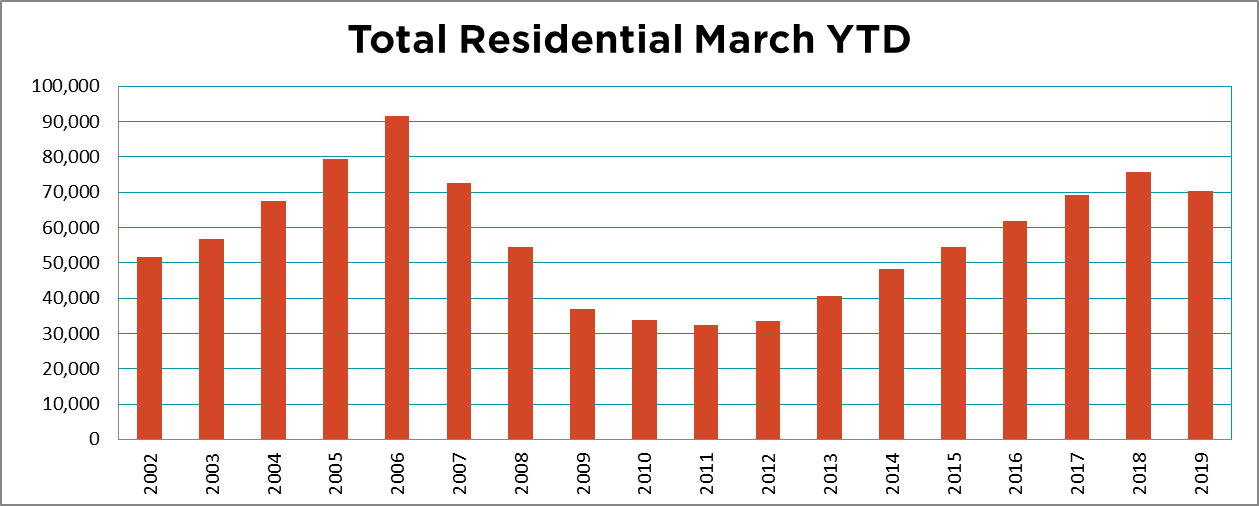
The white line in the charts below compares spending for the first three months of 2019 to the spending over the previous 4 years. Residential construction spending is at the lowest level since 2016, but nonresidential spending this year has been stronger than each of the past 4 years.
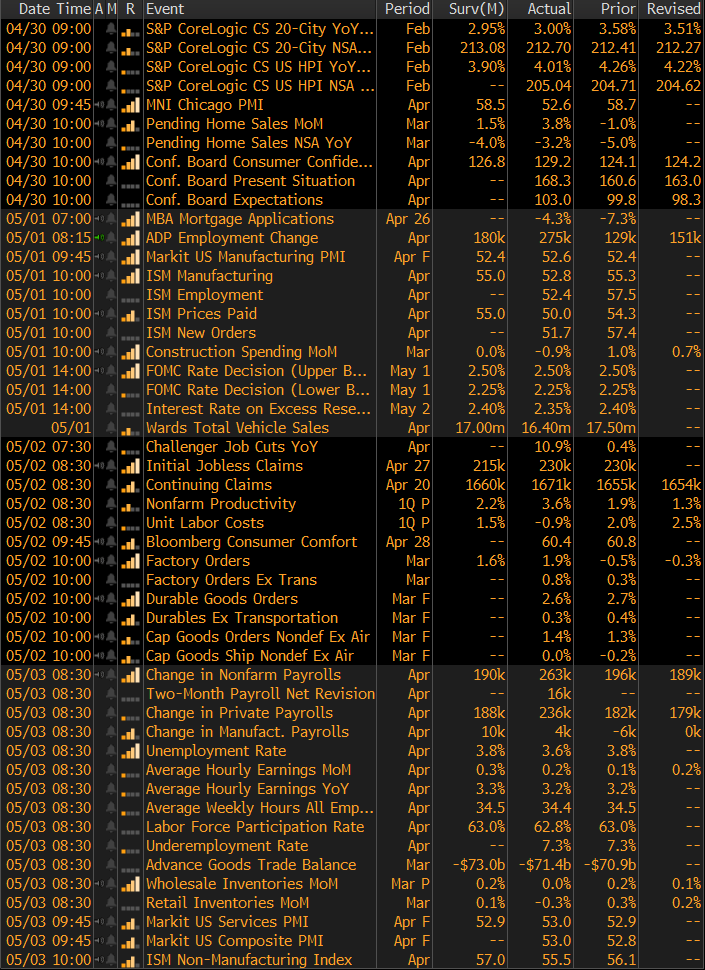
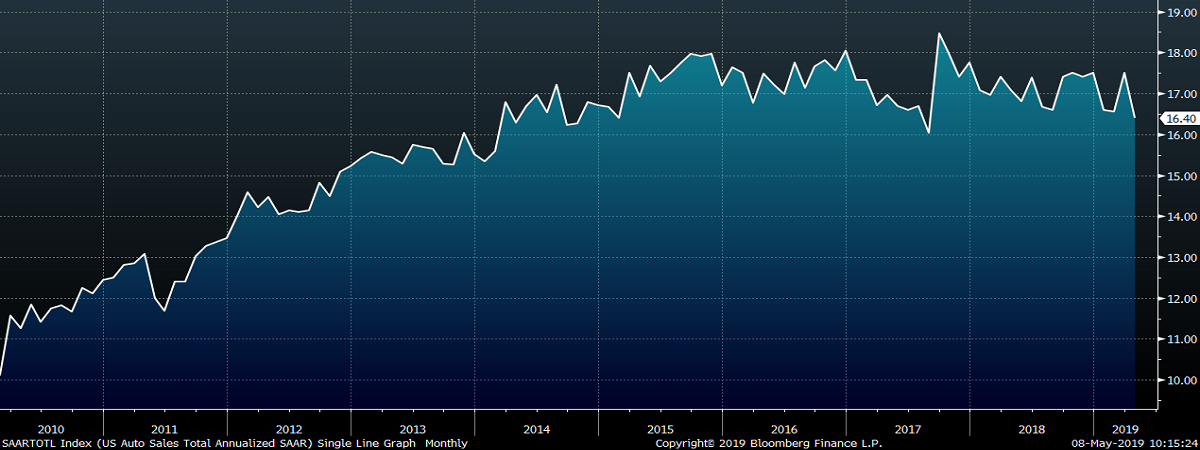
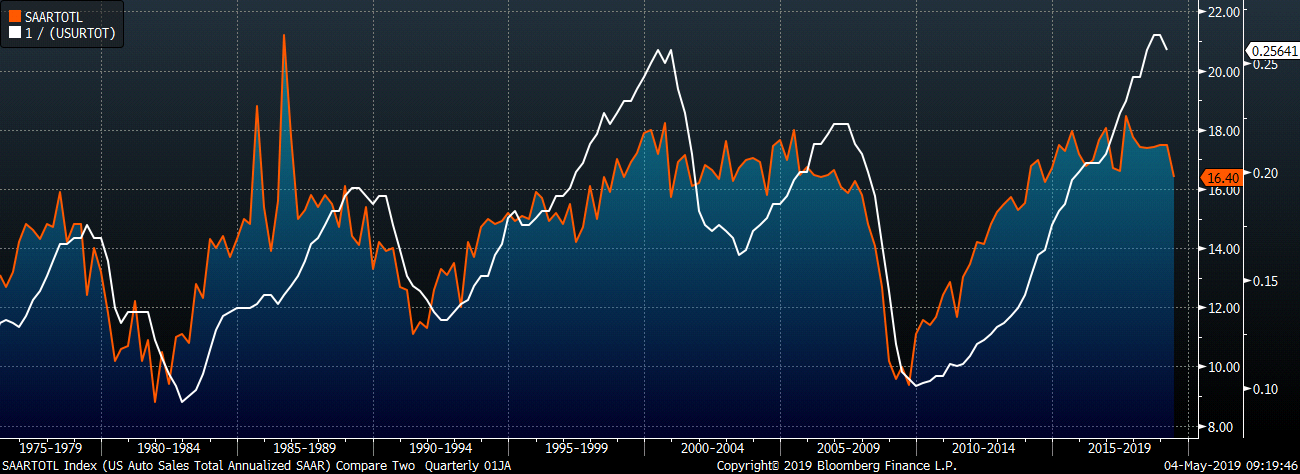
April U.S. light vehicle sales were down sharply to a 16.4m seasonally adjusted annualized rate (S.A.A.R). The April U.S. auto sales rate is the second lowest of the last 5 years. However, auto sales should remain at historically high levels as the unemployment rate remains strong.
Below are the most pertinent upside and downside price risks:
Upside Risks:
Downside Risks:
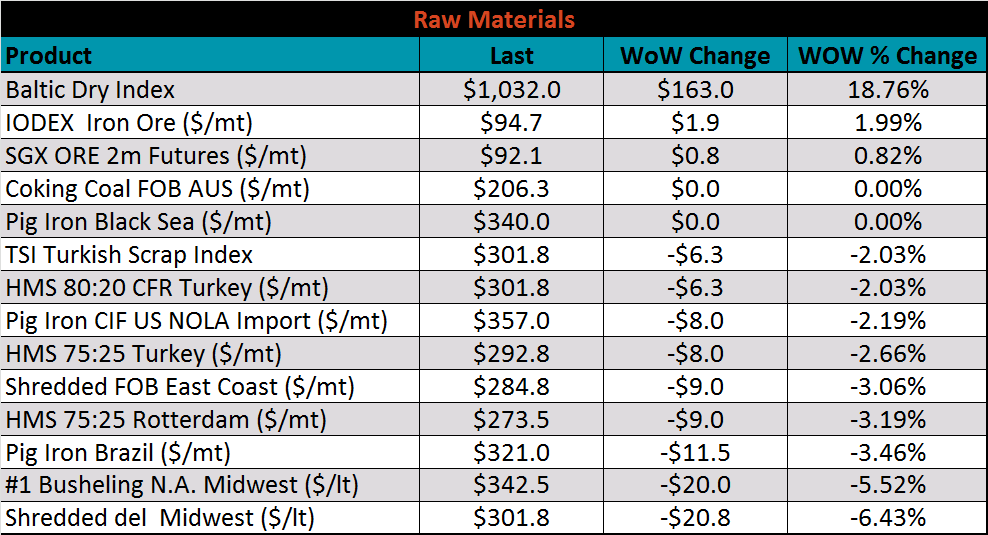
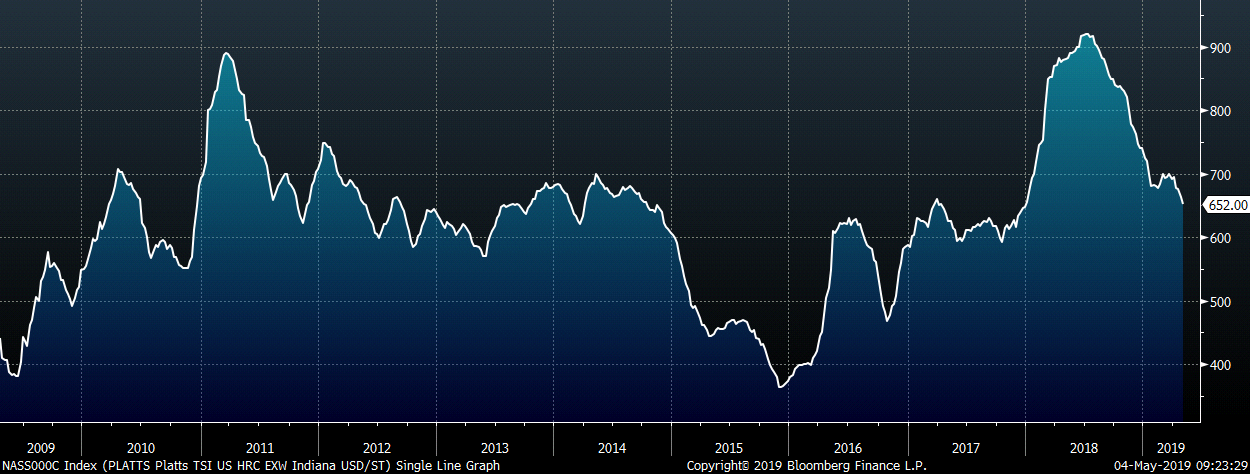
The Platts TSI Daily Midwest HRC Index was down $9.50 to $652.
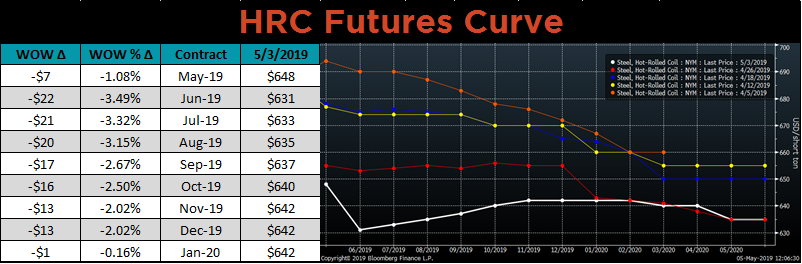
The CME Midwest HRC futures curve is shown below with last Friday’s settlements in white. The front end of the curve continued to move lower while the back end showed little change.
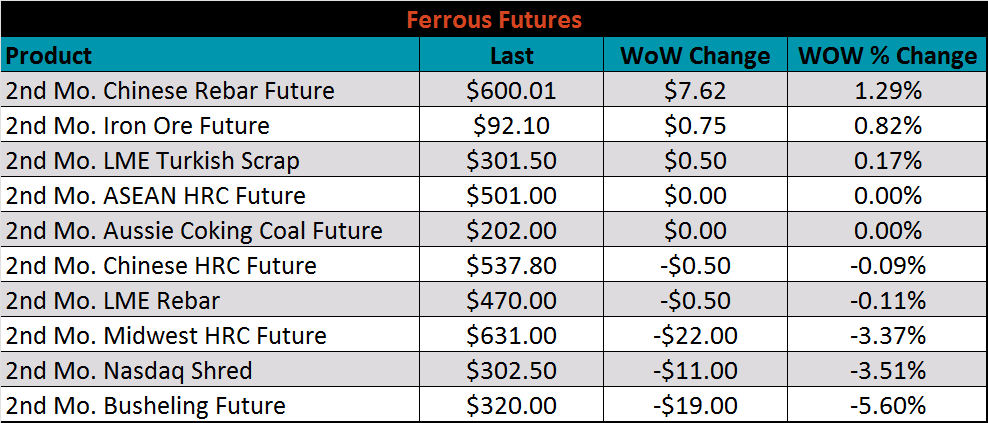
June ferrous futures were mixed. The busheling future was down 5.6%, while the Chinese rebar future was up 1.3%.
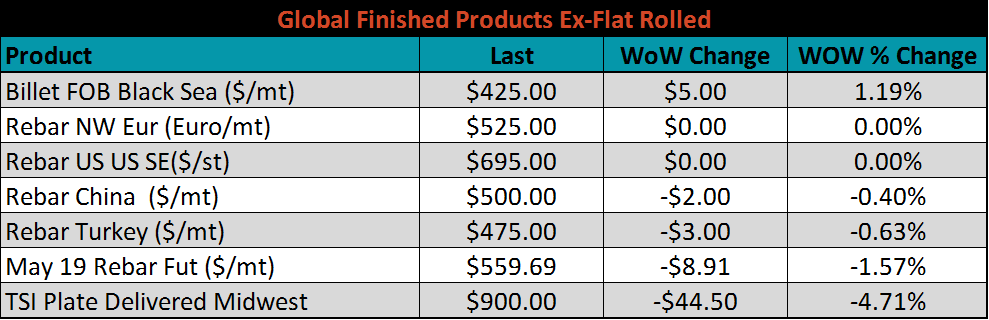
The global flat rolled indexes were mostly lower led by Platts Midwest HDG down 2.4%, while Chinese spot rose slightly.
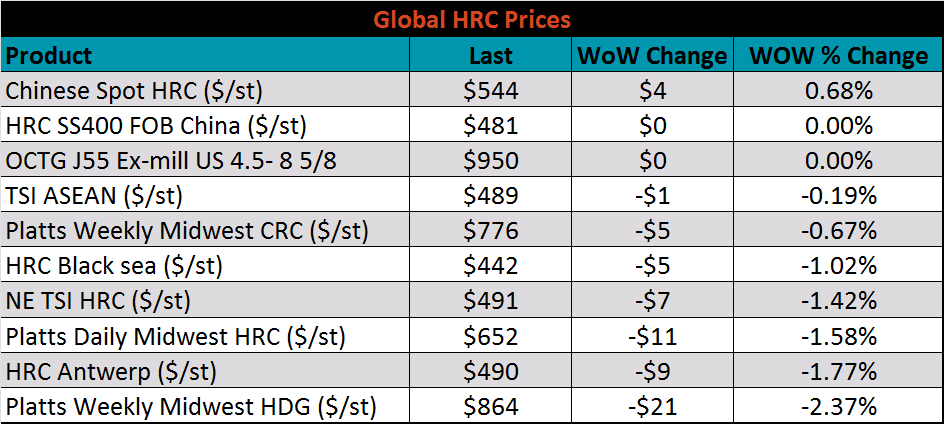
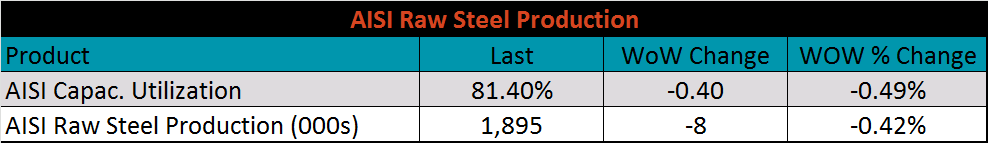
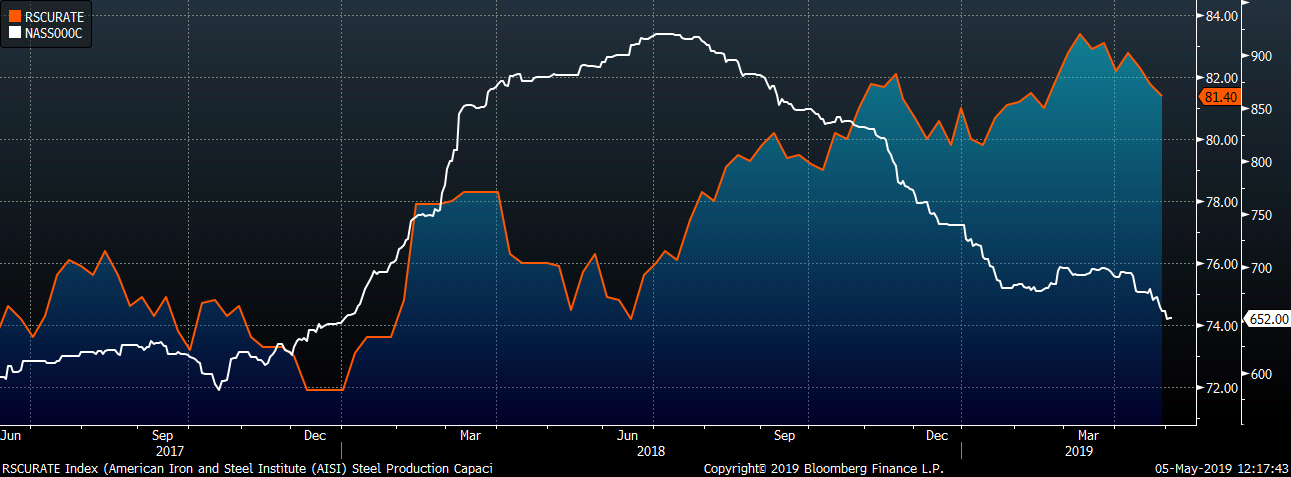
The AISI Capacity Utilization Rate is down 0.4 points to 81.4%. The Trump administration’s goal of 80% Capacity Utilization Rate has held since October 2018, but could be in jeopardy from reduced production at lower prices.
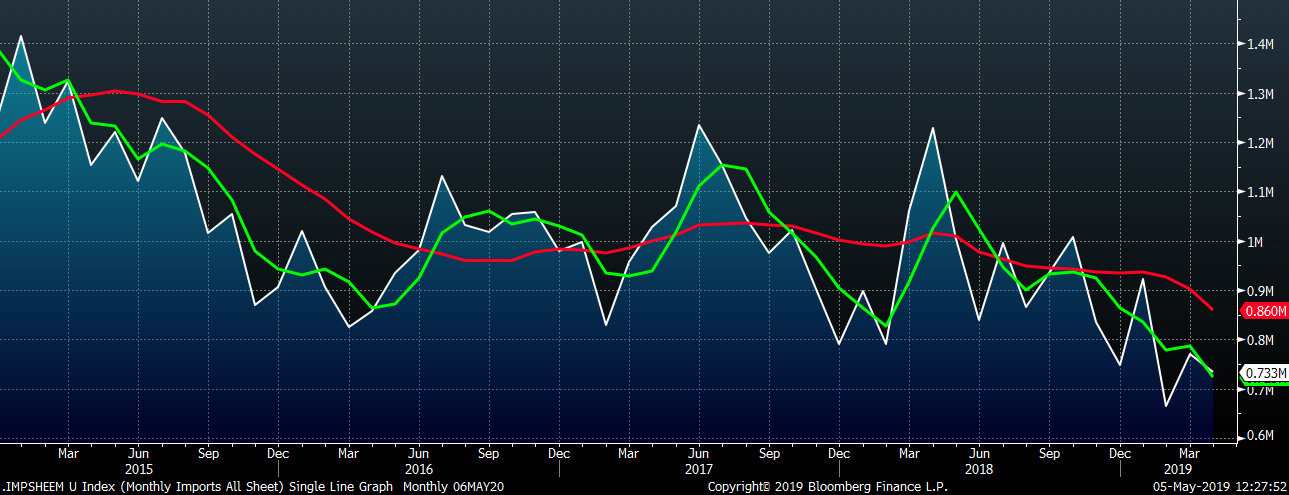
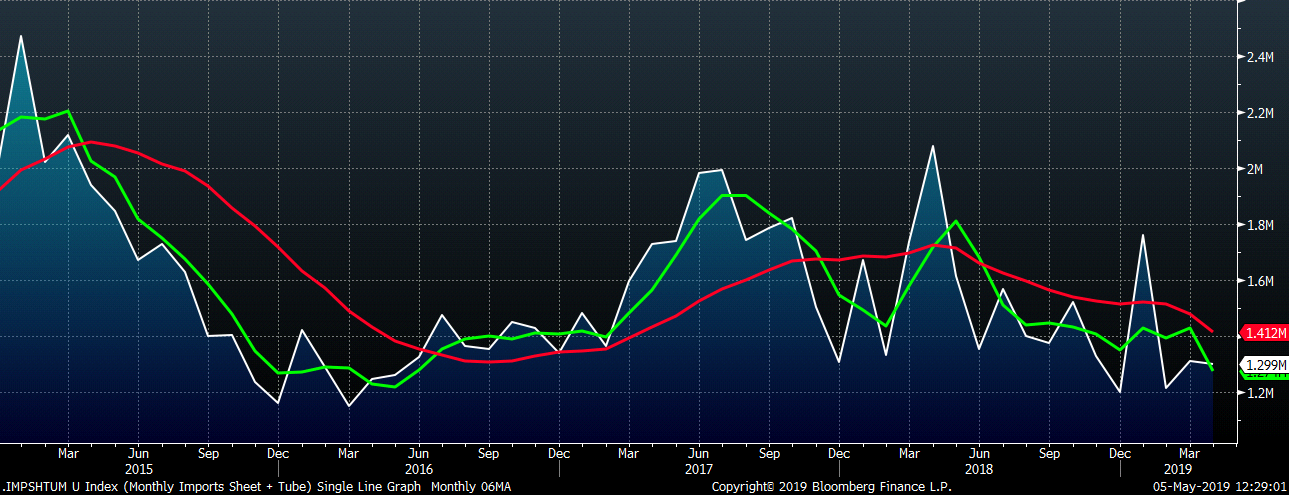
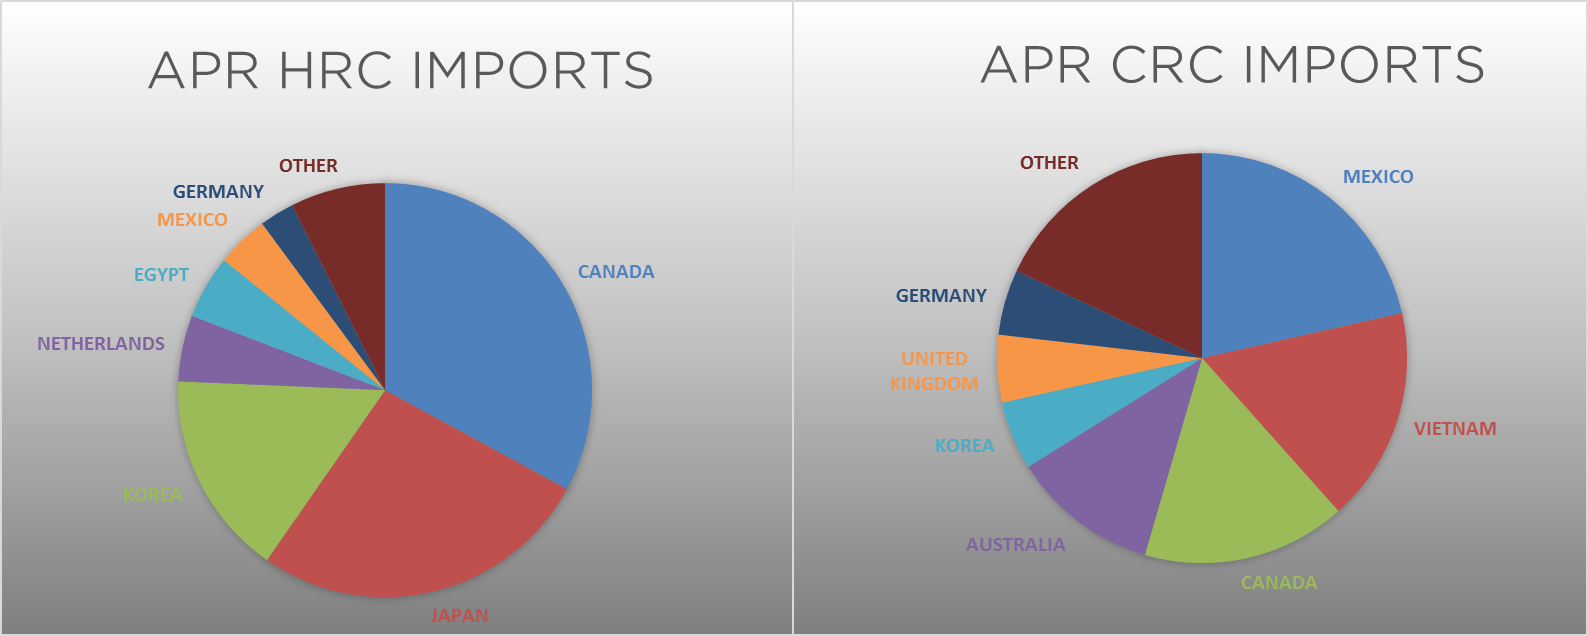
April flat rolled import license data is forecasting a decrease to 733k, down 36k MoM.
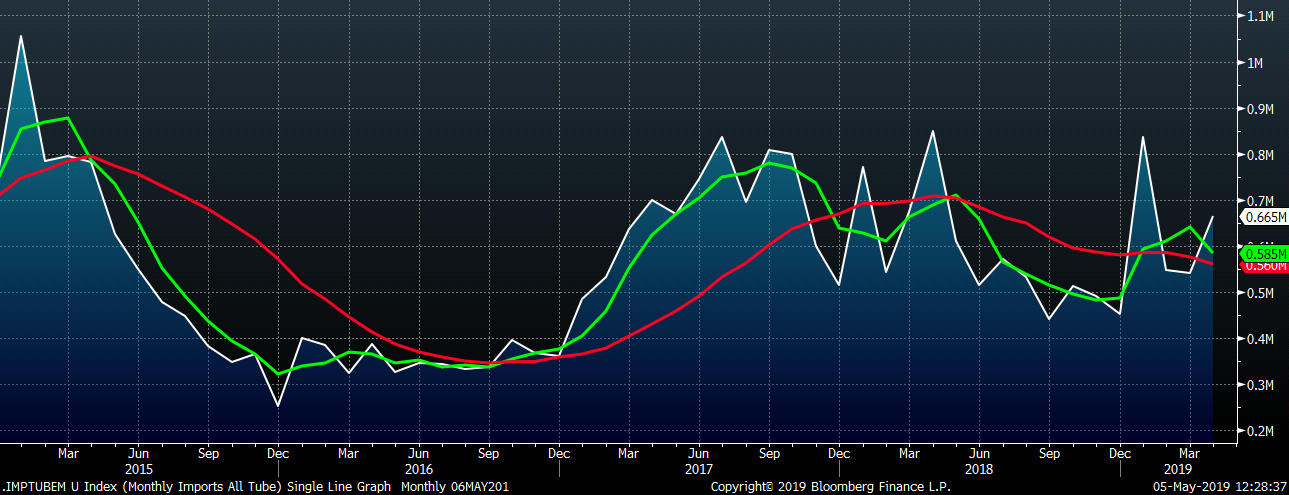
April tube import license data is forecasted to increase 24k to 565k tons after March fell slightly.
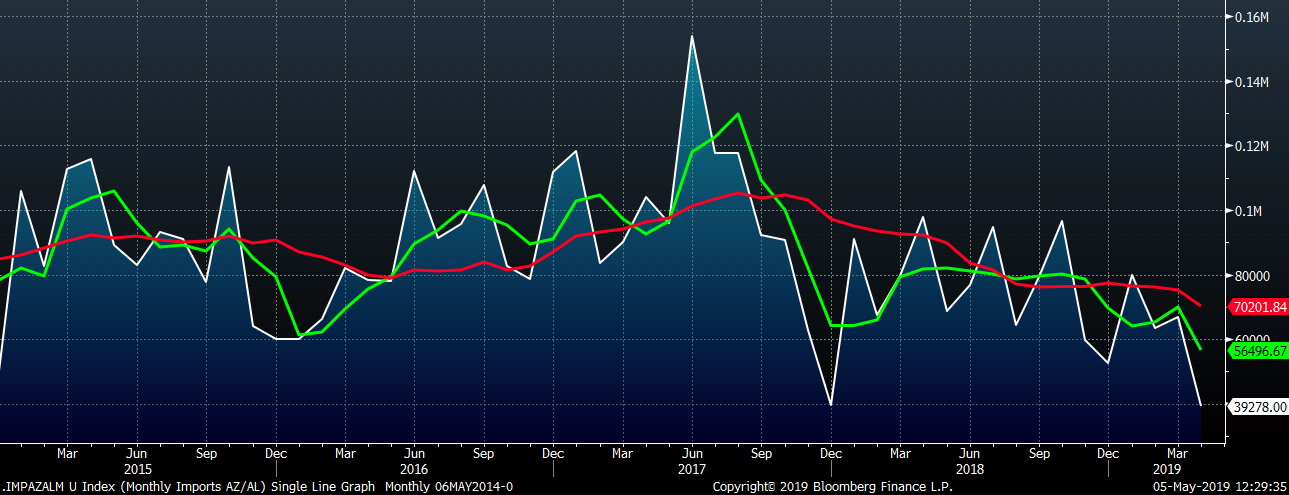
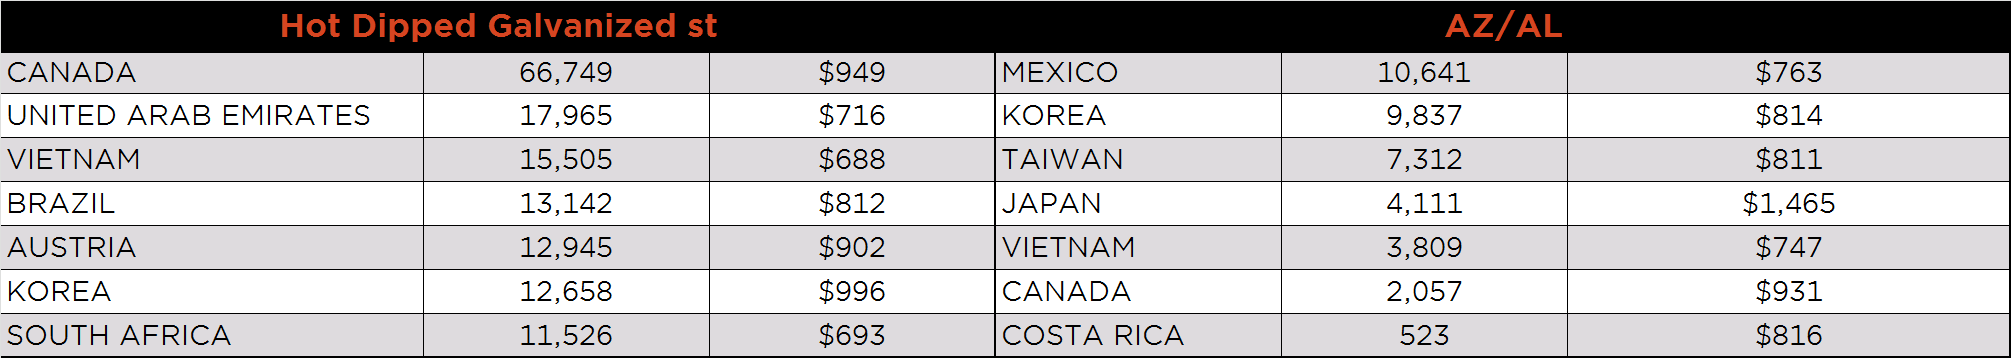
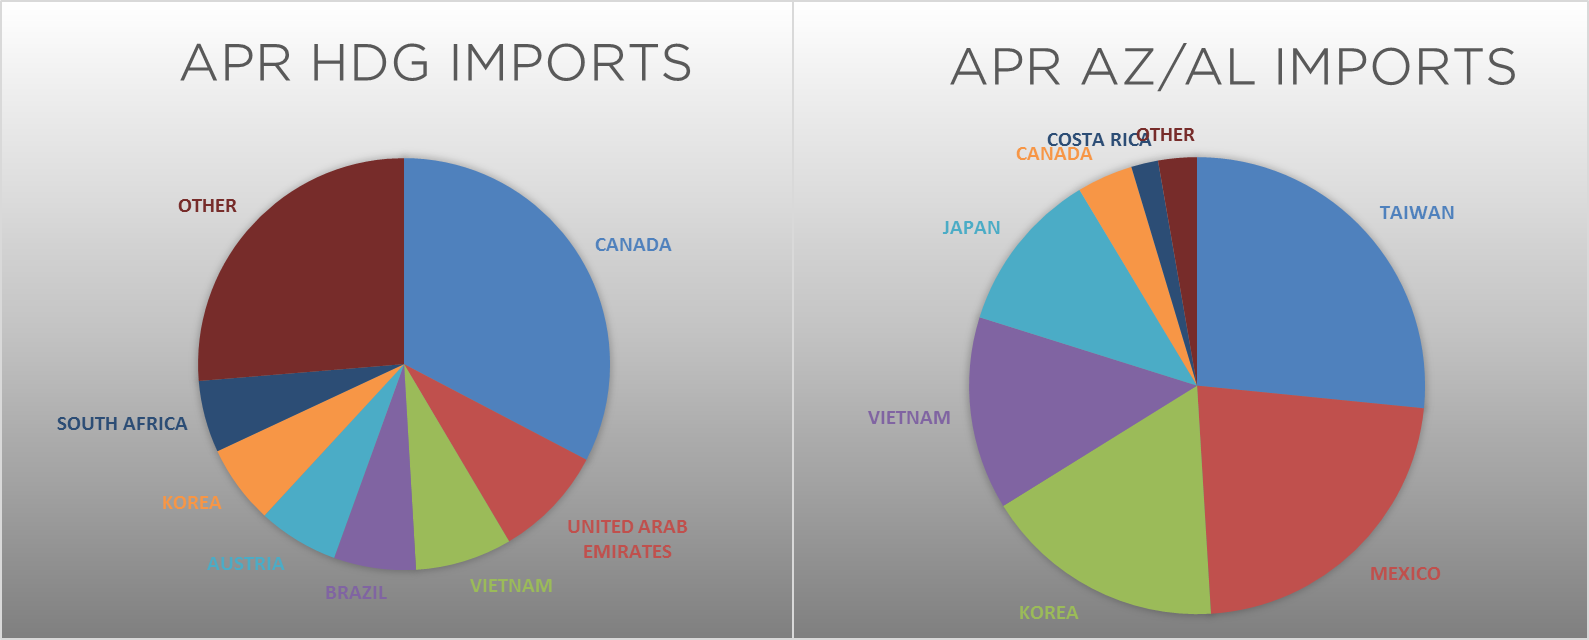
AZ/AL import licenses forecast a decrease of 27k MoM to 39k in April, the lowest monthly level since December 2017.
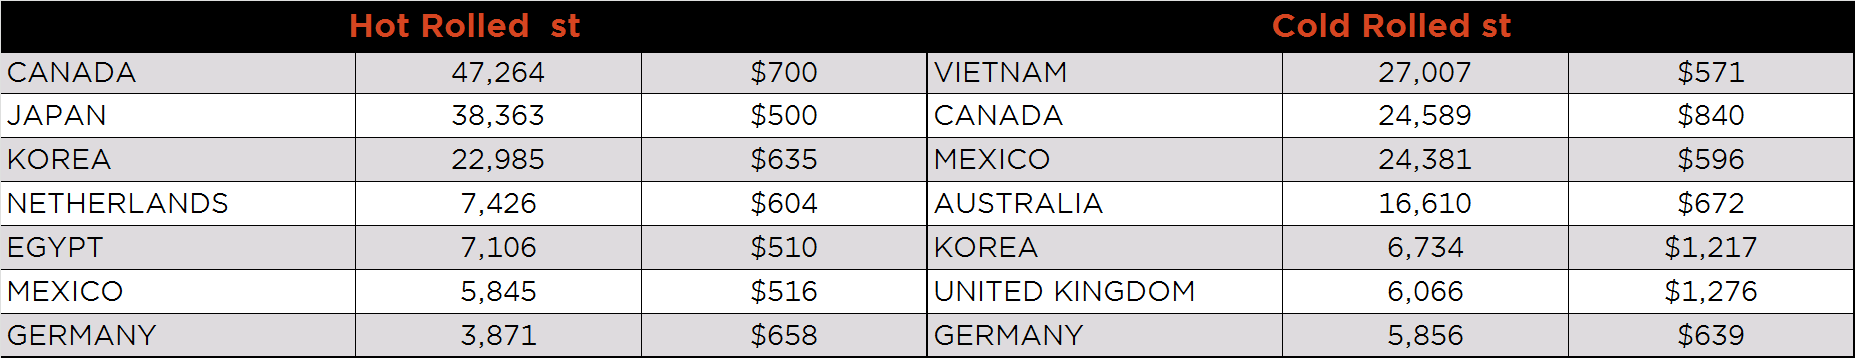
Below is April import license data through April 30, 2019.
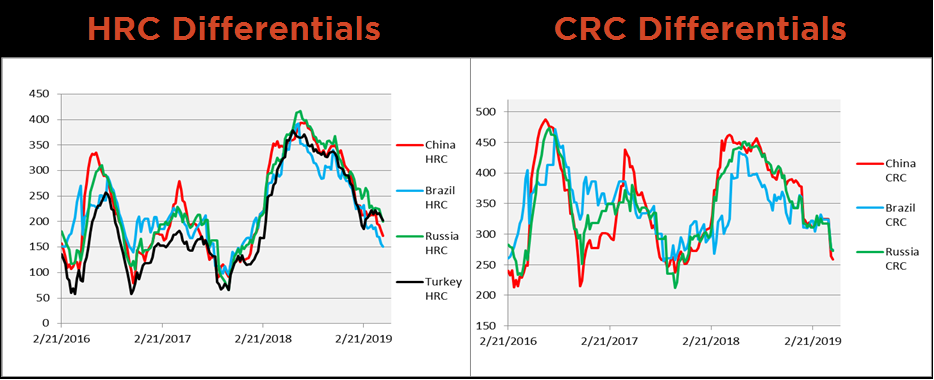
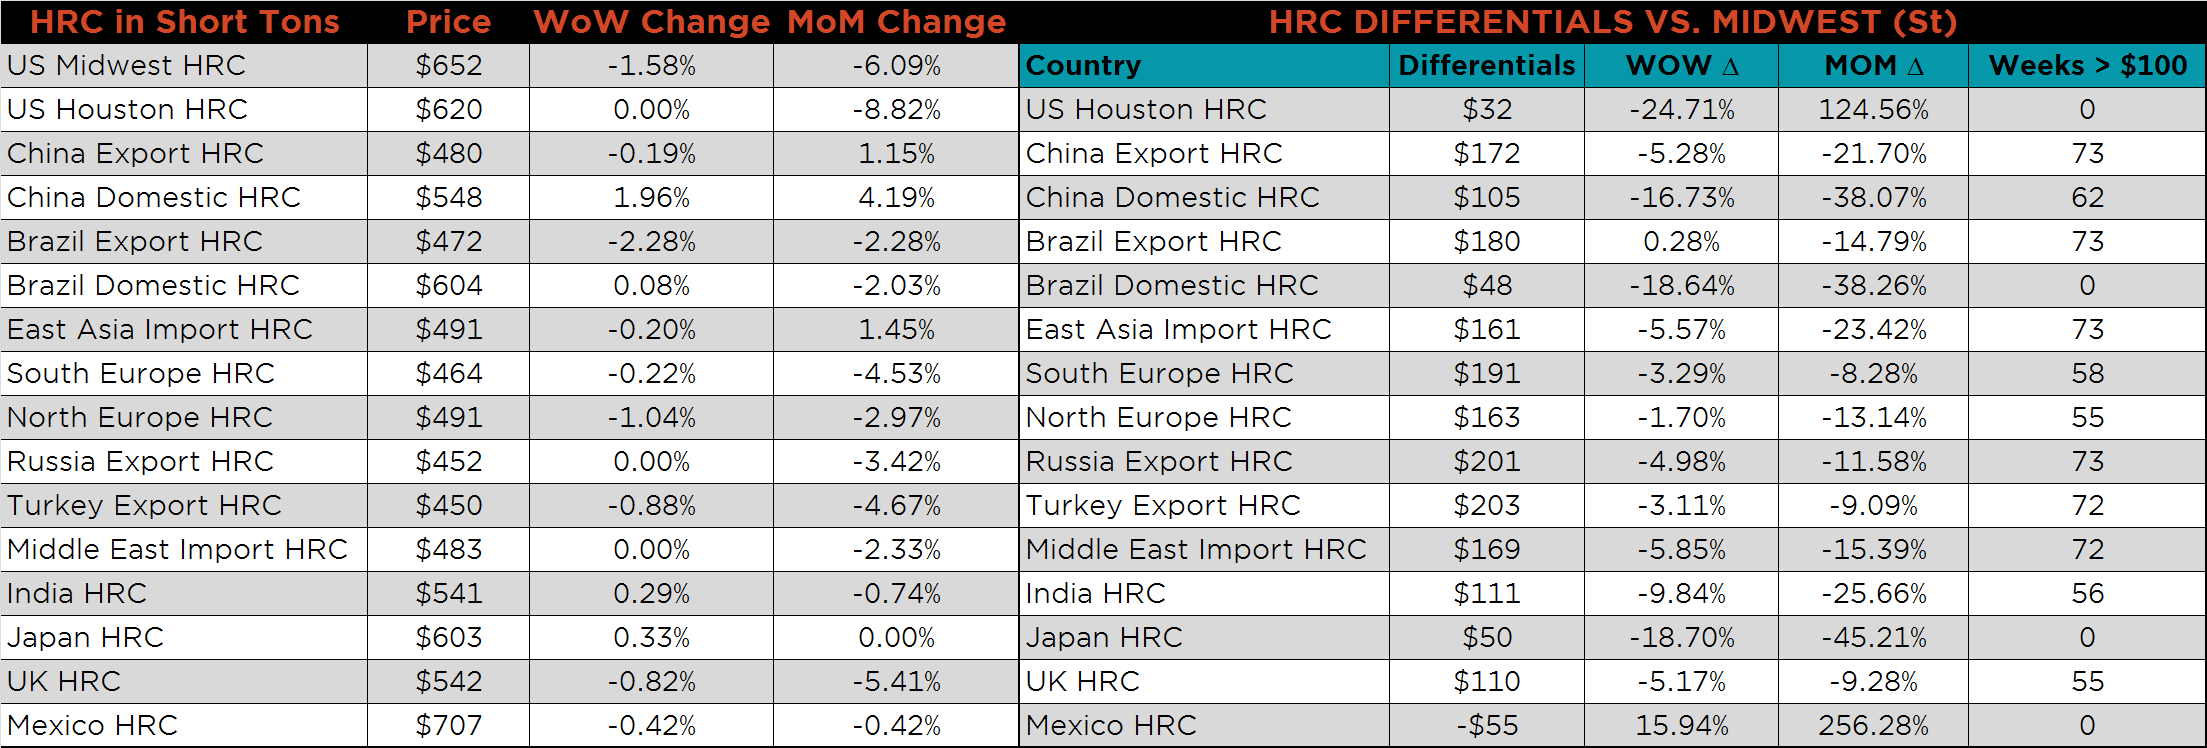
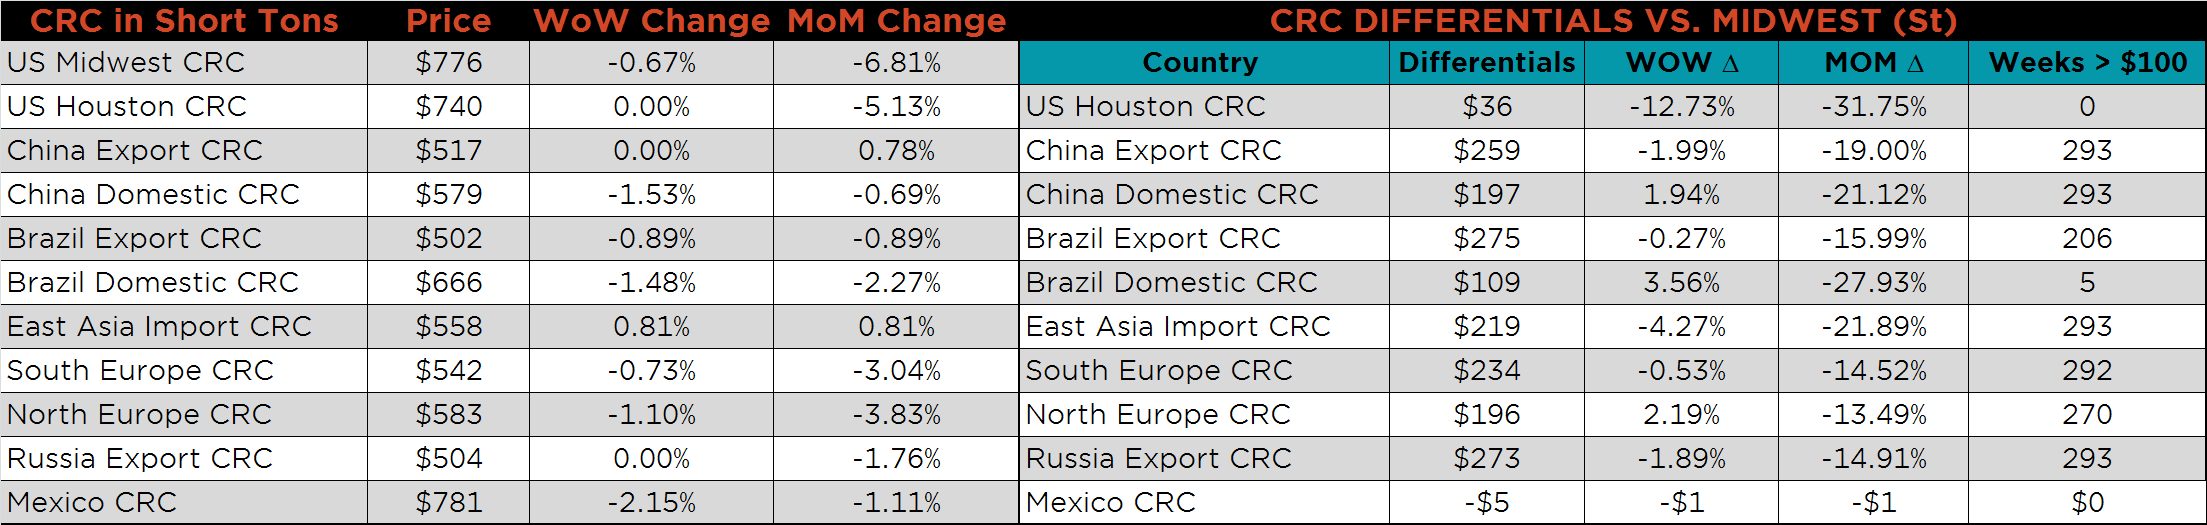
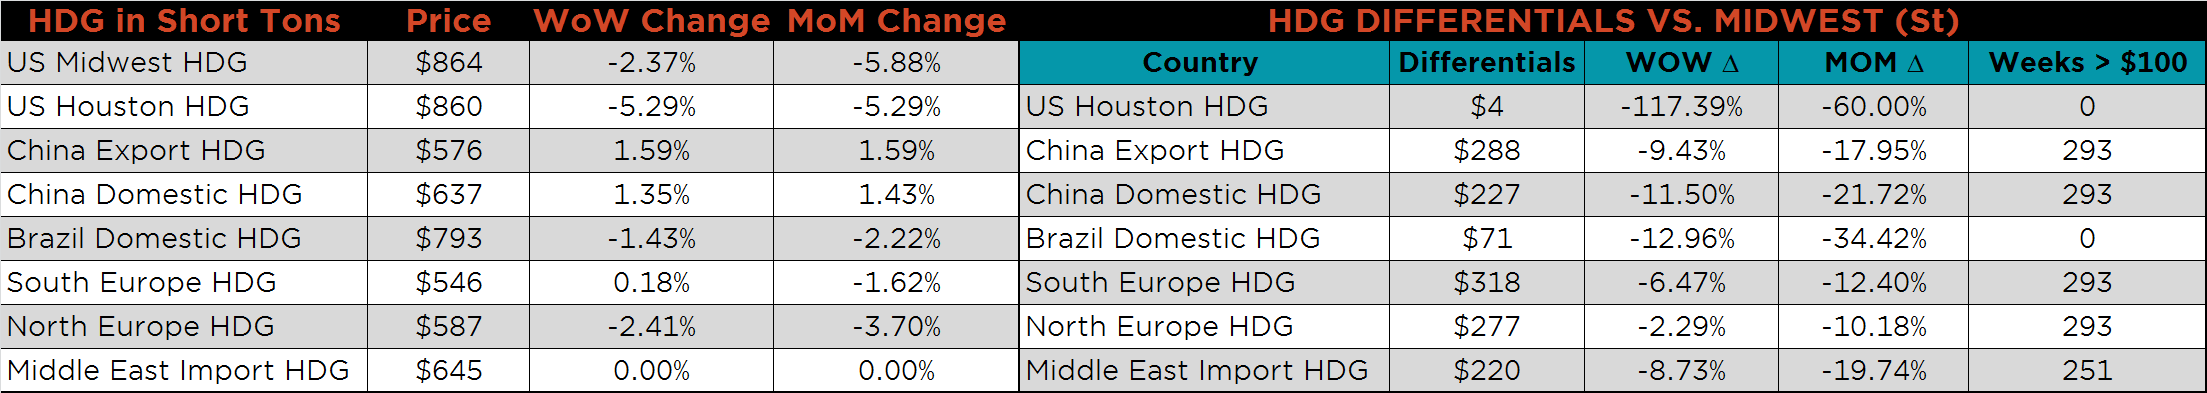
Below are HRC and CRC Midwest vs. each country’s export price differentials using pricing from SBB Platts. All of the differentials moved lower WoW, but the CRC differentials experienced a steep drop after the Platts Midwest CRC price fell by $54 over the past two weeks.
SBB Platt’s HRC, CRC and HDG pricing is below. Midwest HDG, HRC and CRC prices were all lower on the week, 2.4%, 1.6% and 0.7%, respectively. Houston HDG was also down 5.3% while Mexican CRC was down 2.2%.

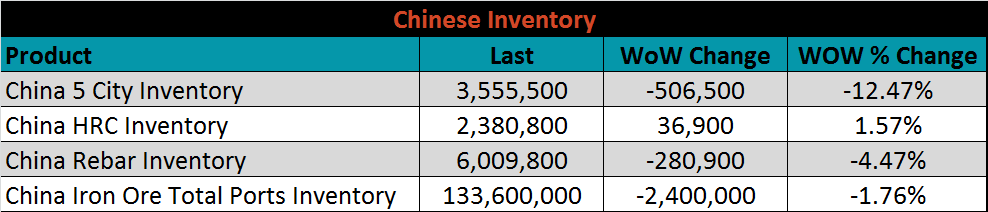
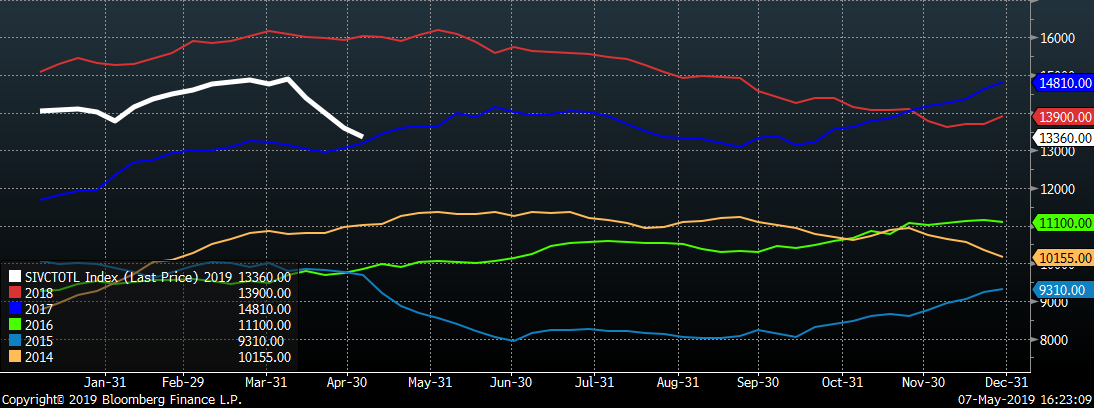
Below are inventory levels for Chinese finished steel products and iron ore. Elevated spot iron ore prices have led to the recent trend in lower total ports inventory, as steel producers look to diminish existing inventory before paying the higher prices. The 5 city inventory continues to decline as well and remains at the lowest level since 2014. Rebar inventory was down 4.5%, while HRC inventory increased for the first time since February.
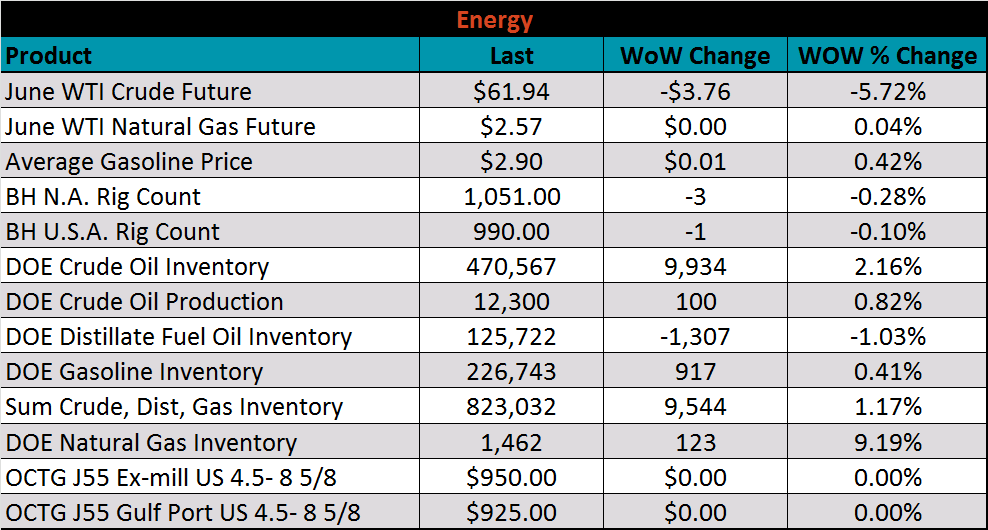
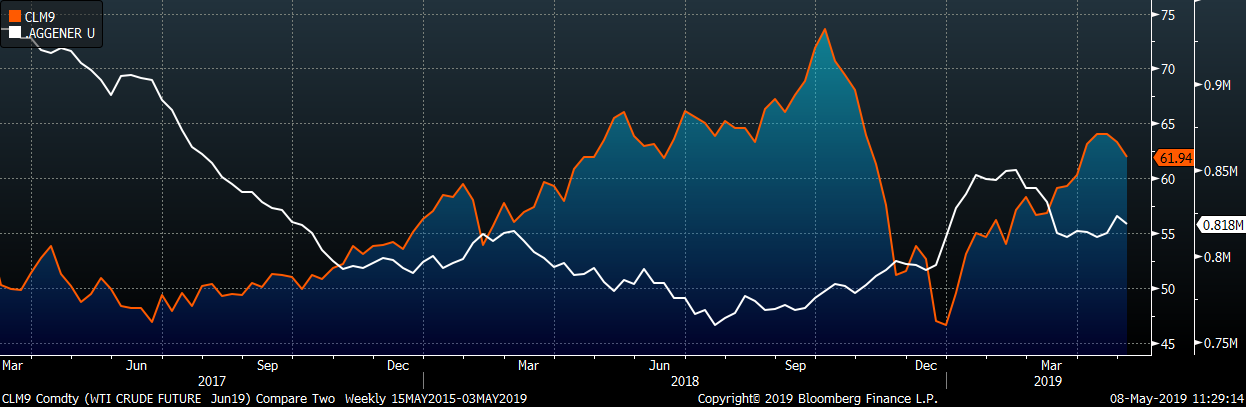
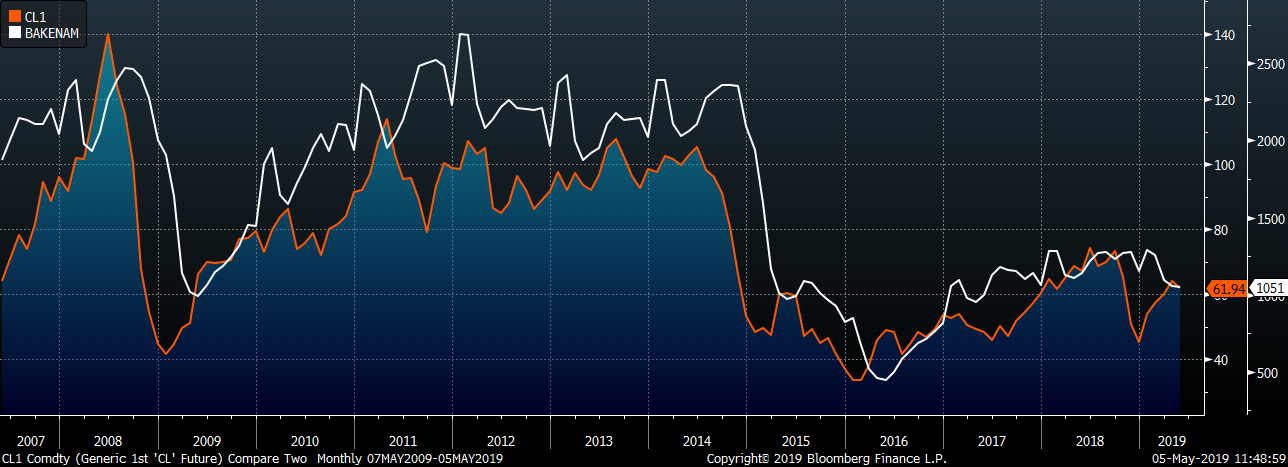
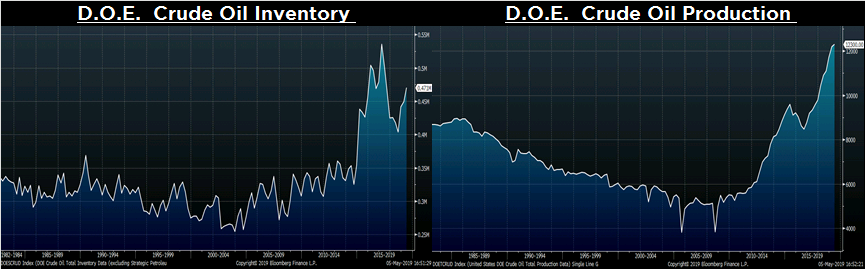
Last week, the June WTI crude oil future lost $3.76 or 5.72% to $61.94/bbl. The aggregate inventory level was up 1.2%. and crude oil production rose back to 12.3m bbl/day. The U.S. rig count lost one rig while the North American rig count lost three rigs.
The list below details some upside and downside risks relevant to the steel industry. The orange ones are occurring or look to be highly likely. The upside risks look to be in control.
Upside Risks:
Downside Risks: