Content
-
Weekly Highlights
- Market Commentary
- Risks


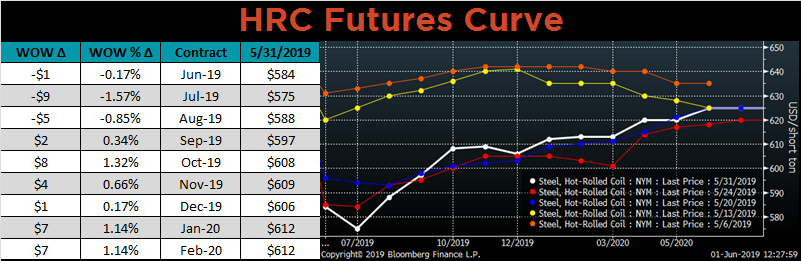
Last week the HRC Spot prices continued to fall, with the Platts TSI Daily Midwest HRC Index falling $13. Interestingly, the futures curve did not fall in the same manner. Near term expirations prices fell slightly, and longer term expirations actually rose. Based on the futures curve, the financial market thinks prices will bounce. This report has discussed producer profits on the marginal ton, which has been declining for almost a year, and reached a level that is unsustainable. In negotiations with domestic suppliers, mills have shifted their stance recently and have been less willing to negotiate lower prices. They want prices to hold these levels, or bounce. Service centers are holding high priced material, from either lagging price contracts or the inventory overhang from the beginning of the year. The falling prices are causing financial distress, through slow payments to mills or broken bank covenants. They want (and in some cases need) the price to stabilize or bounce. So with all these interests aligned in terms of price direction, why does the price continue to fall?
In the market, nothing has fundamentally changed. Prices need a catalyst in order to change direction. Declining mill profitability will not affect prices unless production is removed. Service centers have not restocked, despite low levels of inventory. Lead times continuing to decrease supports this strategy. While demand remains steady, business outlook and optimism remains uncertain among trade tensions and weak global manufacturing sectors. While price differentials have continued to decrease, global prices have slipped, lowering the price “floor” we have discussed. However, the further prices fall, the more likely each of these dynamics reverses. We continue to take a long-term practical approach, and lock in a fraction of our purchases at current prices.
Below are the most pertinent upside and downside price risks:
Upside Risks:
Downside Risks:
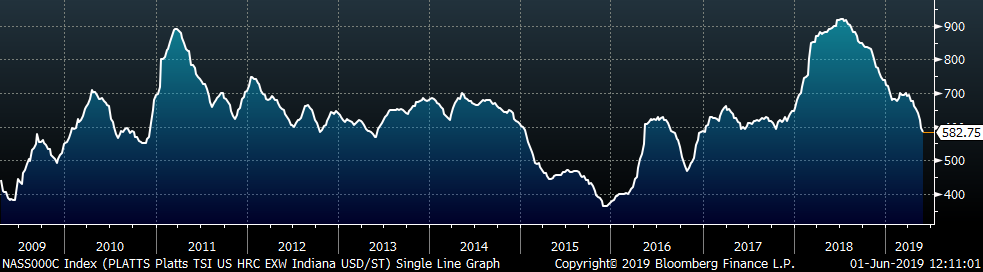
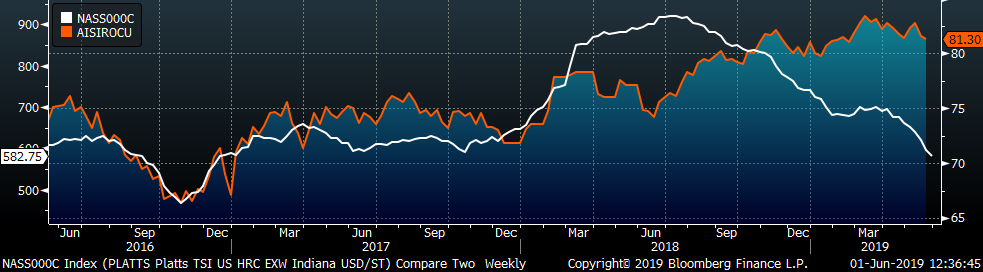
The Platts TSI Daily Midwest HRC Index was down $13 to $582.75.
The CME Midwest HRC futures curve is shown below with last Friday’s settlements in white. The curve shifted lower in both the front and higher in the back last week.
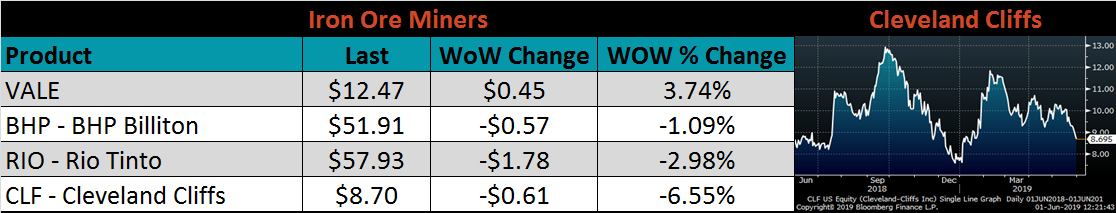
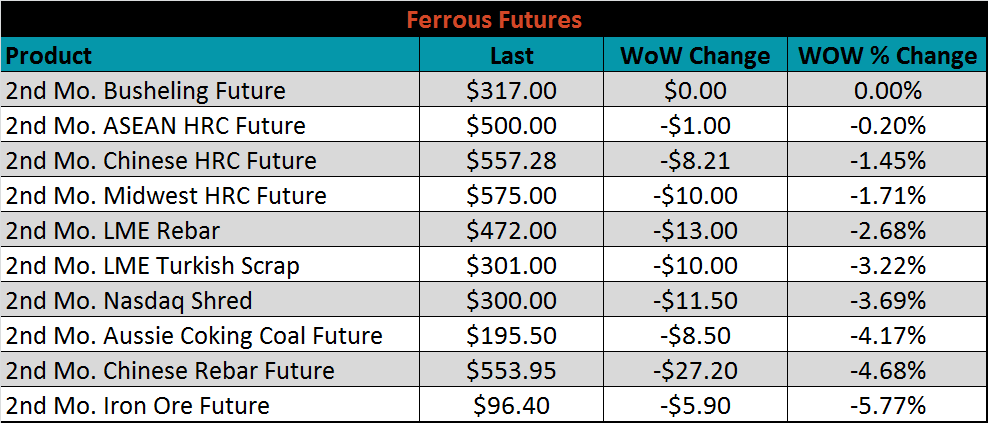
June ferrous futures were down. The iron ore future lost 5.8%.
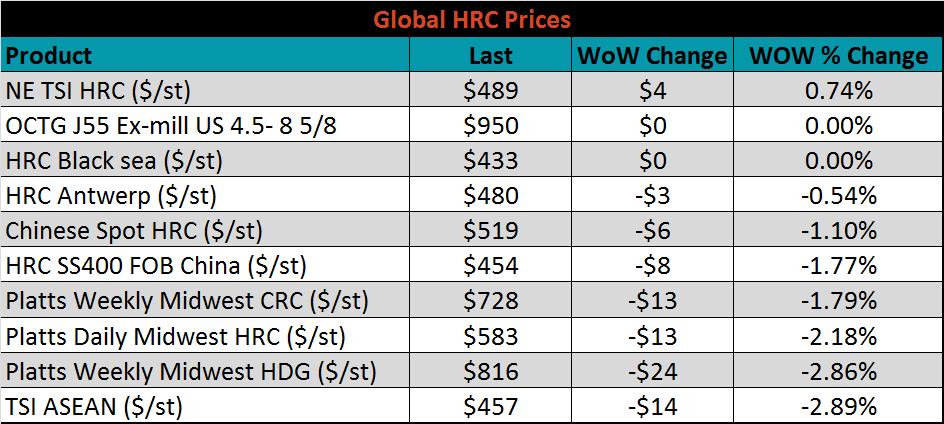
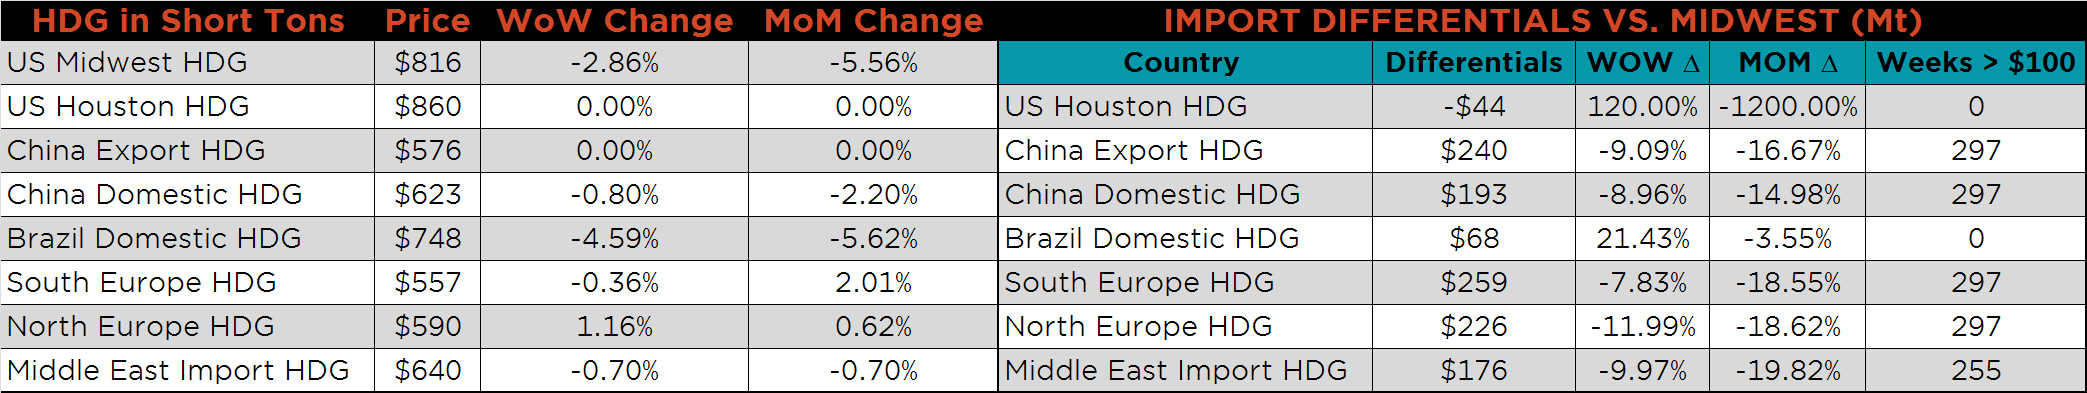
The global flat rolled indexes were mostly lower. TSI ASEAN and Platts Midwest HDG were both down 2.9%.
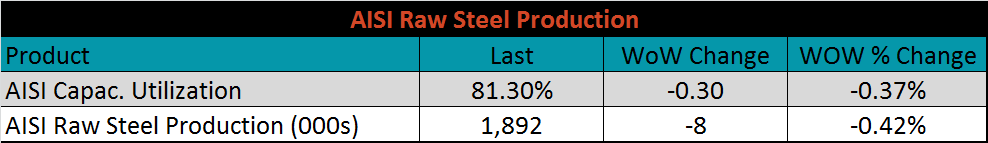
The AISI Capacity Utilization Rate was down 0.3 points to 81.3%. The Trump administration’s goal of 80% Capacity Utilization Rate has held since October 2018, but could be in jeopardy if mills cut production due to low prices. Politically, the mills are in a tough position, with profitability falling and low levels of imports. Any attempt to remove capacity will be scrutinized by the administration.
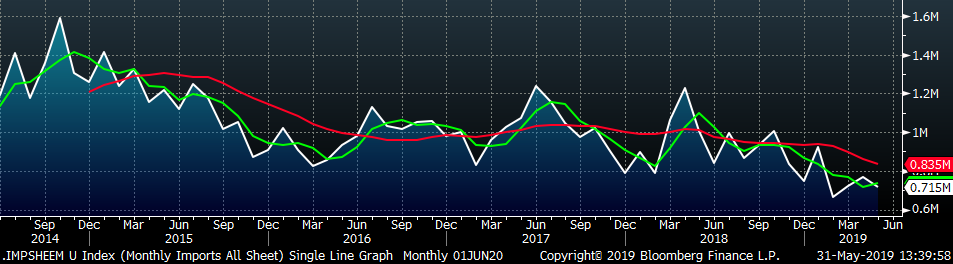
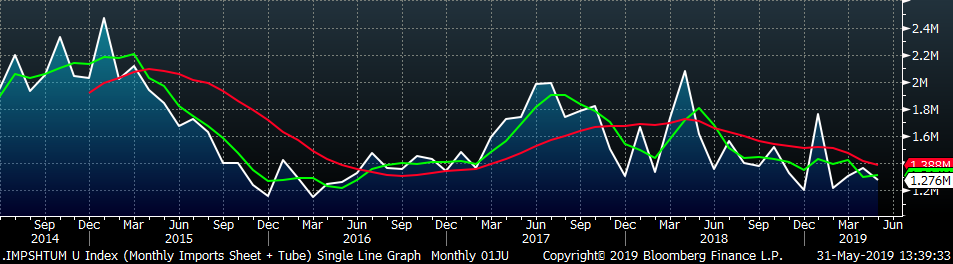
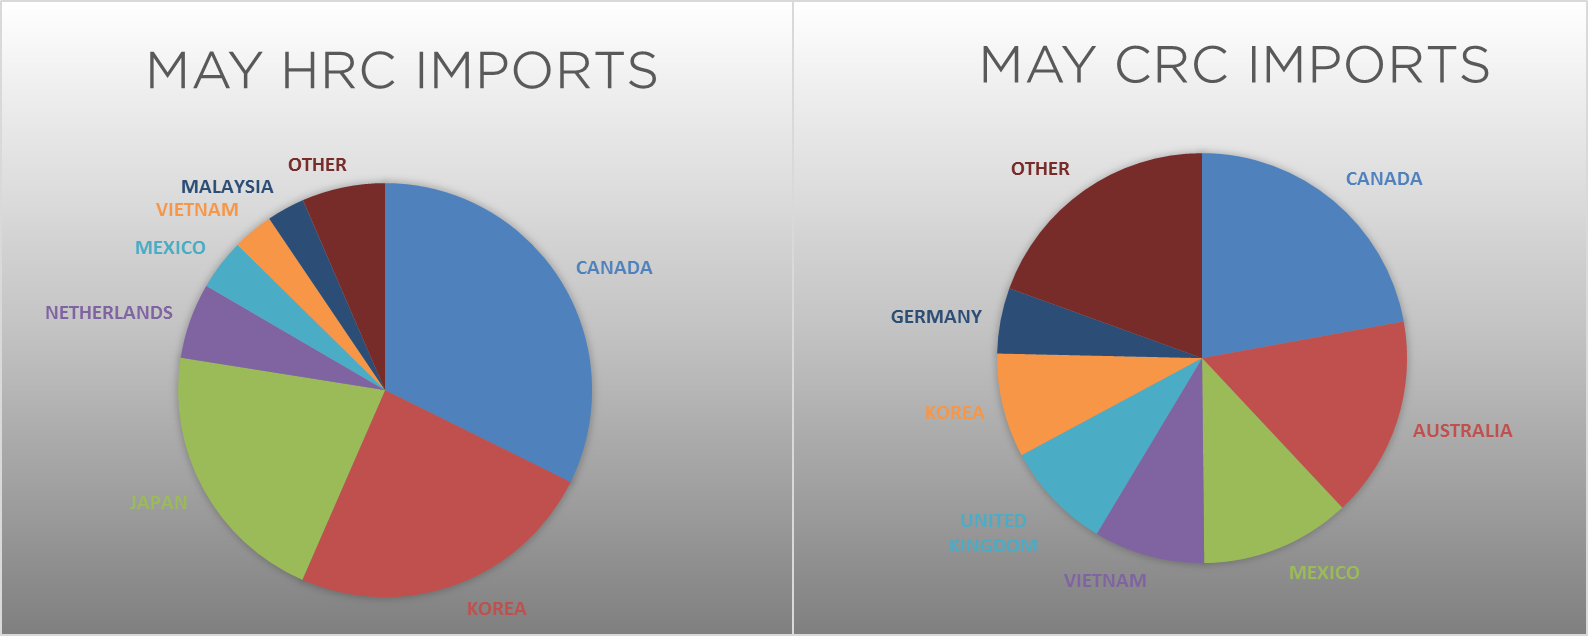
May flat rolled import license data is forecasting a decrease to 715k, down 55k MoM.
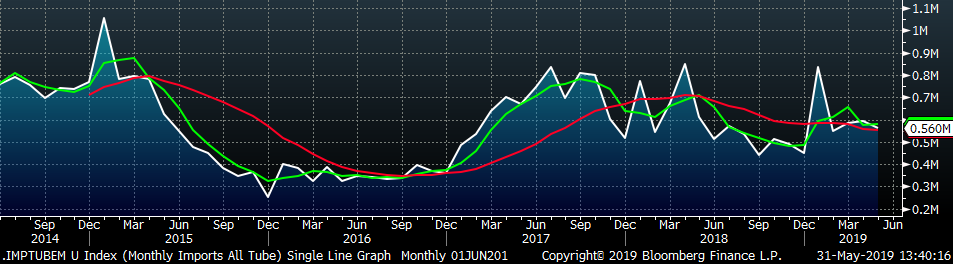
May tube import license data is forecasting a MoM decrease of 32k to 560k tons.
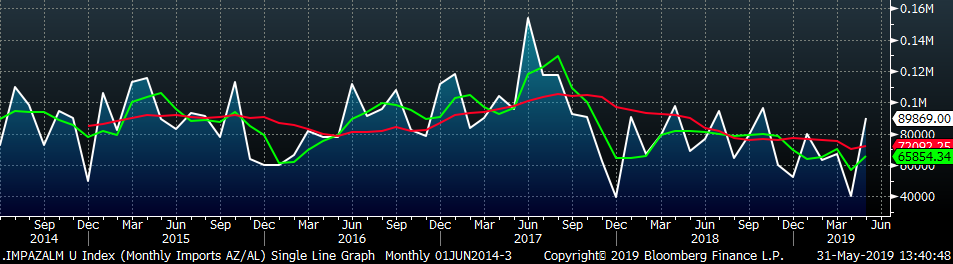
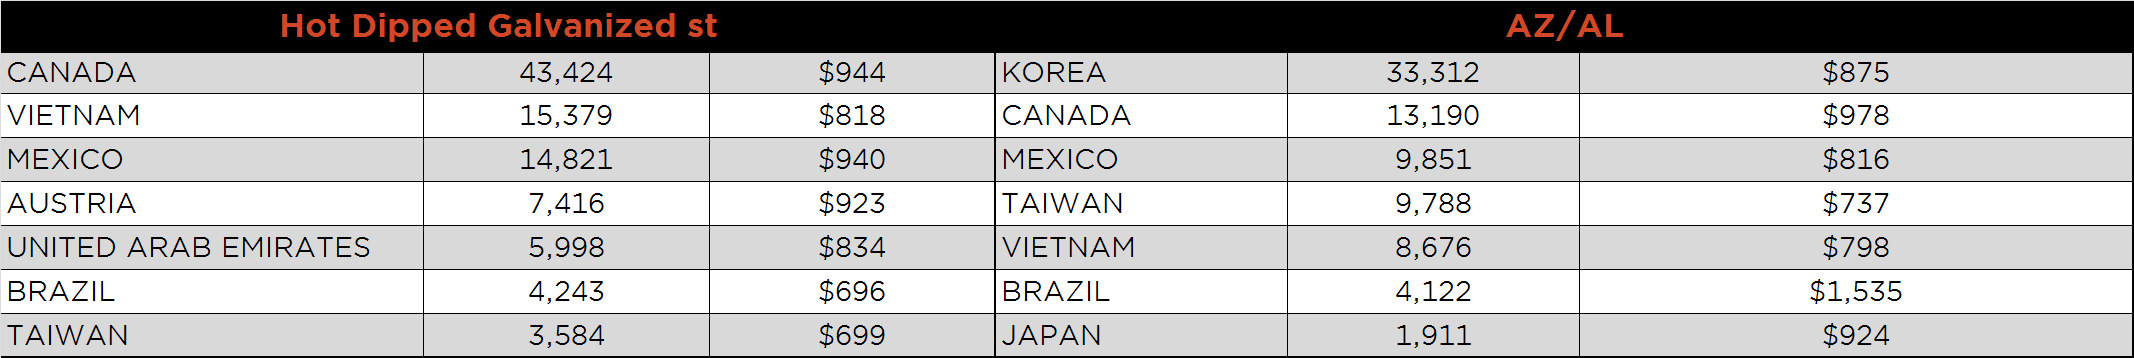
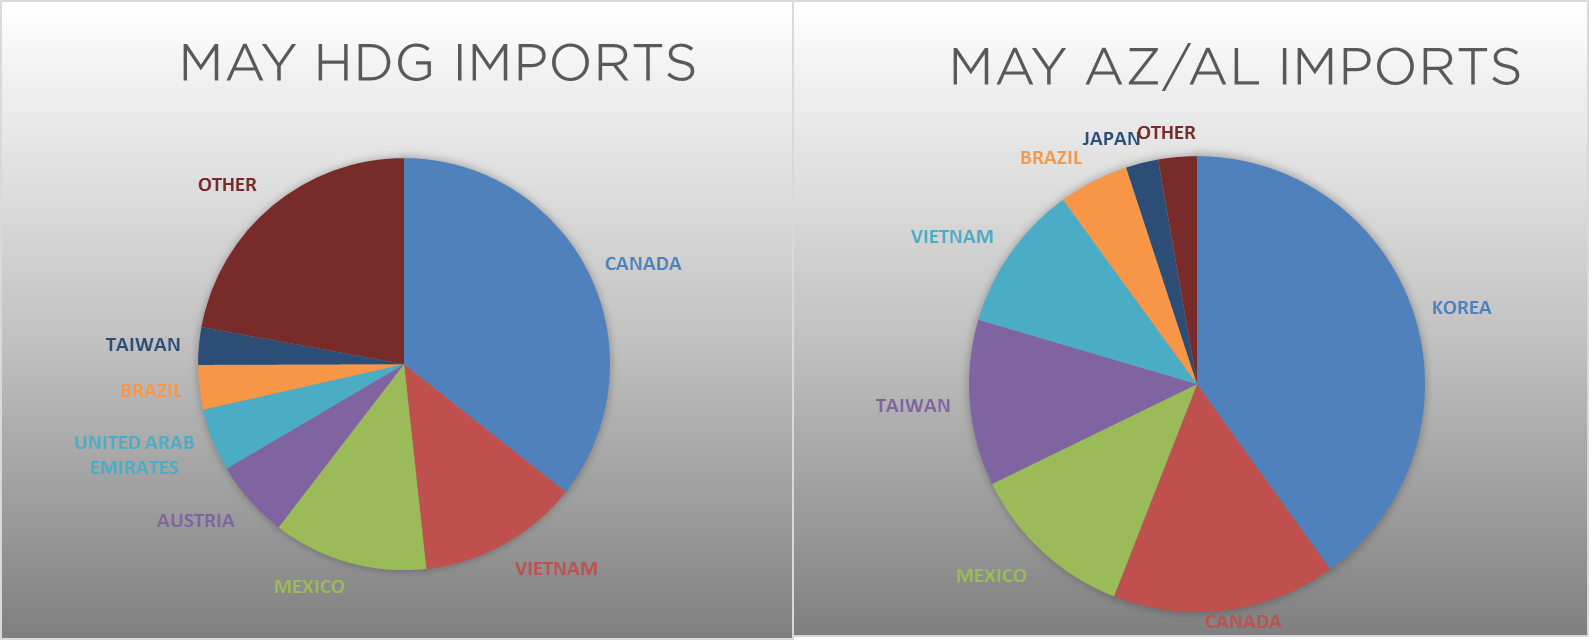
AZ/AL import licenses forecast an increase of 50k MoM to 90k in May.
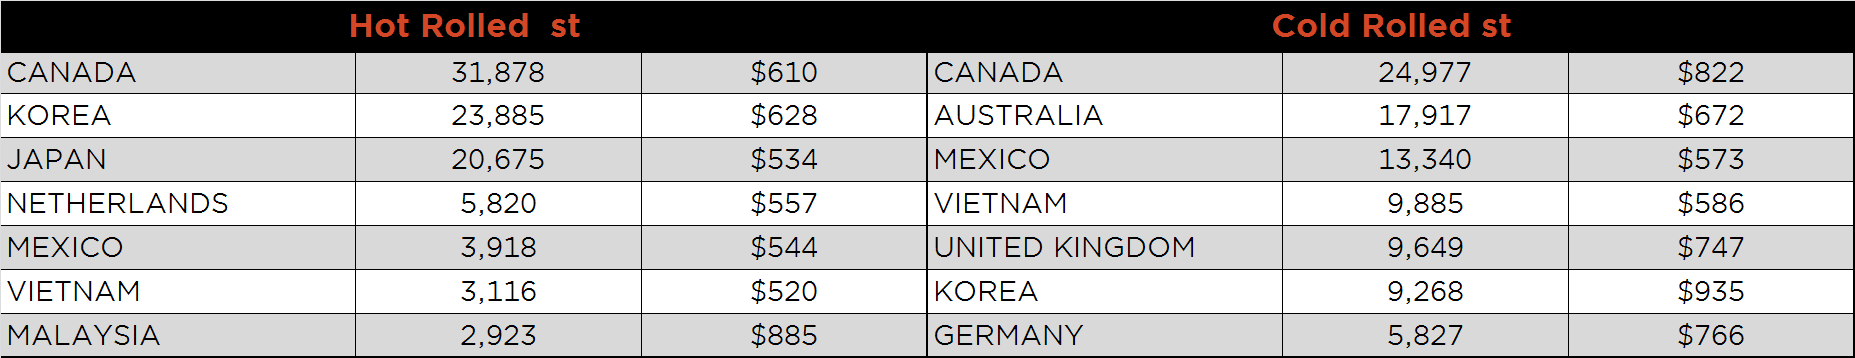
Below is April import license data through May 28, 2019.
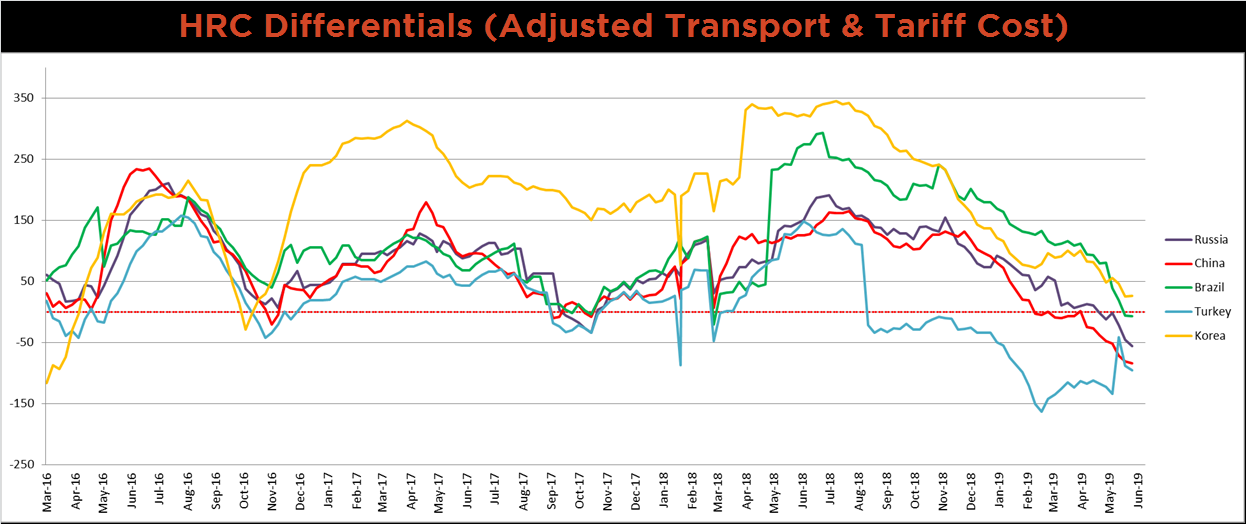
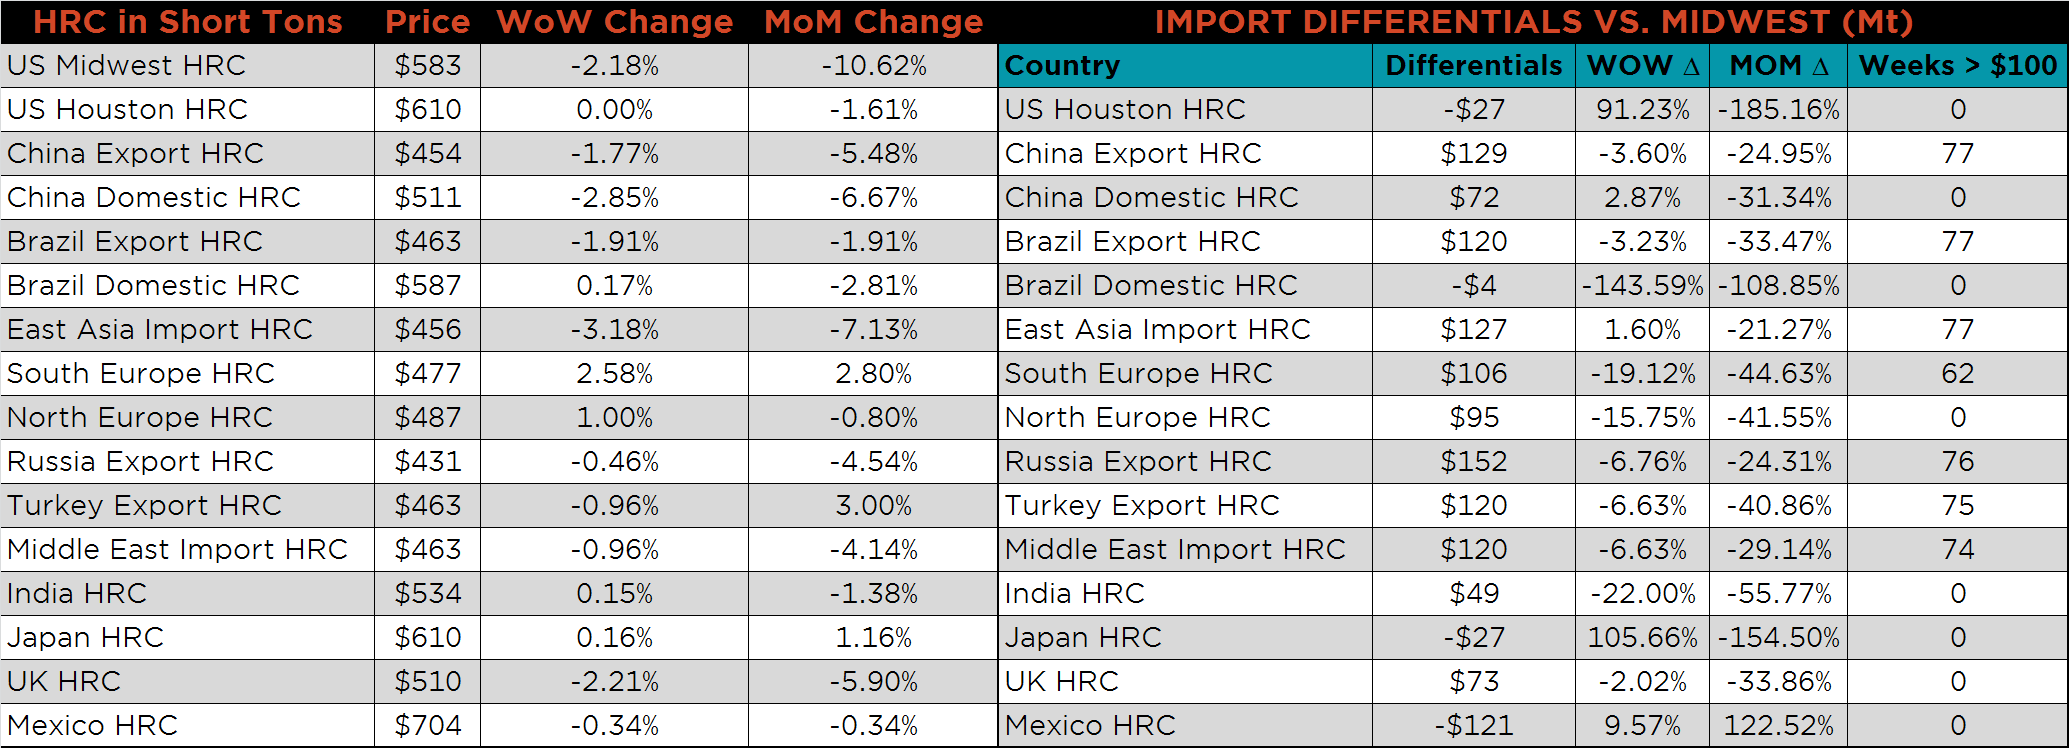
Below is HRC Midwest vs. each listed country’s export price differential using pricing from SBB Platts. We have adjusted each export price to include any tariff or transportation cost to get a comparable delivered price. The Turkish, Russian, Chinese and Brazilian price differentials moved lower last week, while Korea’s price differential rose slightly. Korea is still the only country with a price differential that is not negative. Historically, the zero price differential level has acted as a bottoming signal for domestic HRC prices.
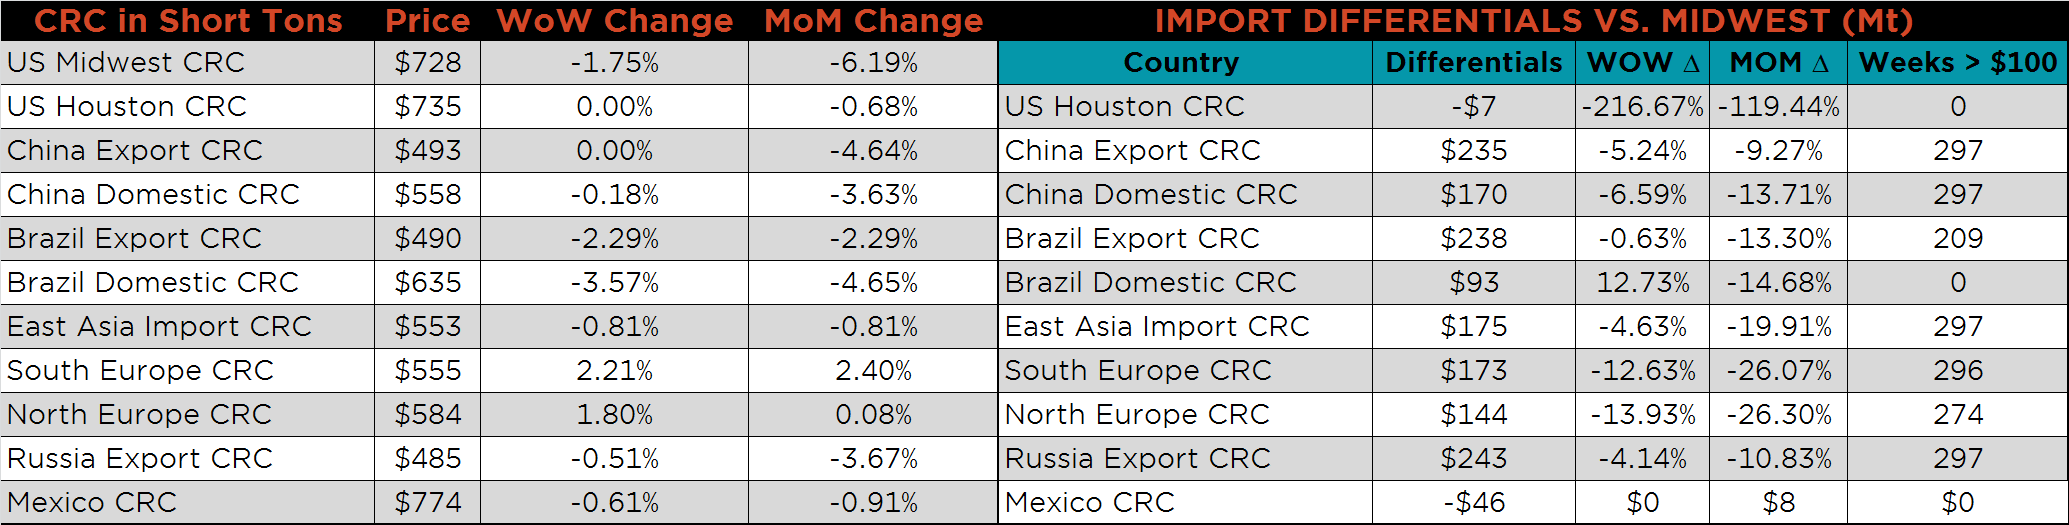
SBB Platt’s HRC, CRC and HDG pricing is below. Midwest HDG, HRC and CRC prices were lower on the week, 2.9%, 2.2% and 1.8%, respectively. The East Asian HRC Export price was down 3.2%, while the South Europe HRC Export price was down 2.6%.
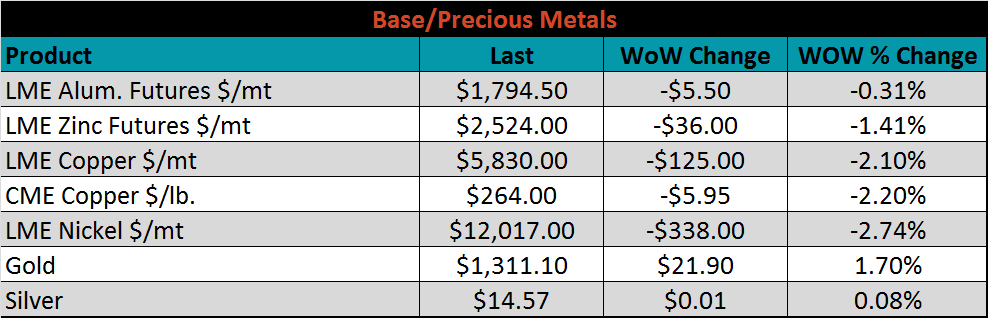
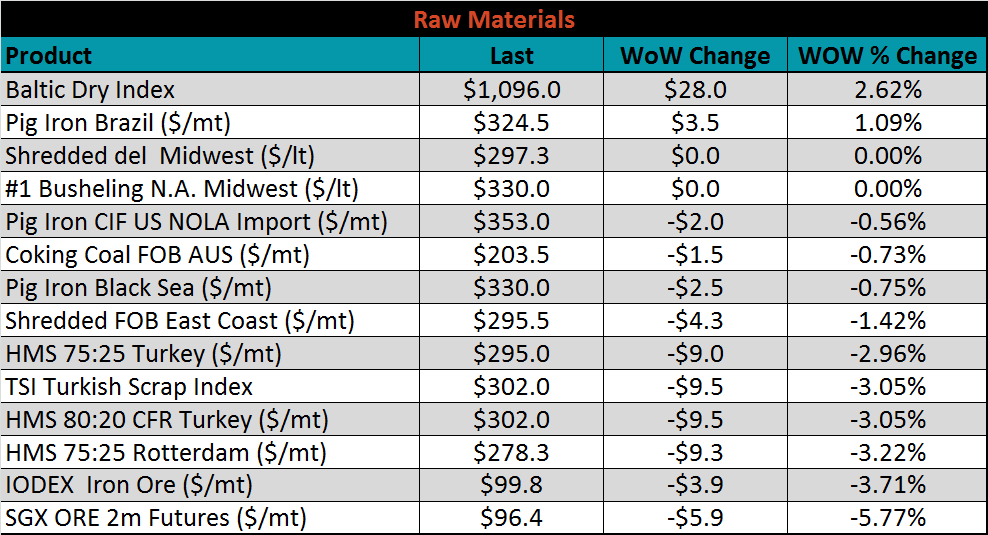
Raw material prices are listed below. Brazilian pig iron was up 1.1%, while most the remaining tracked materials were all down, led by SGX ore, down 5.8%.
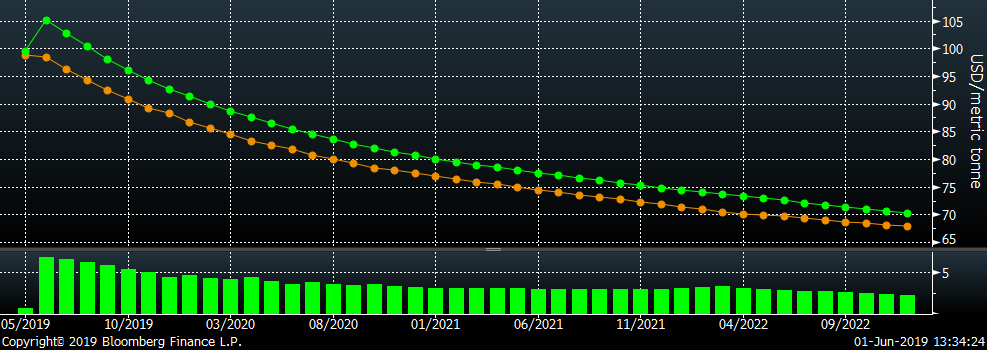
Below is the iron ore future curve with Friday’s settlments in orange, and one week prior’s settlements in green.
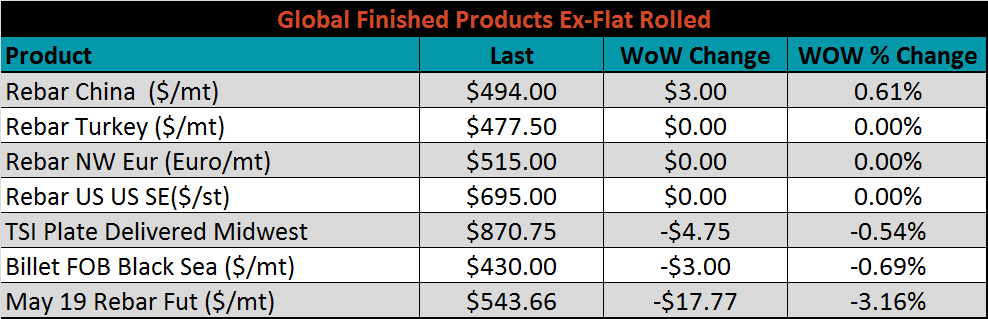
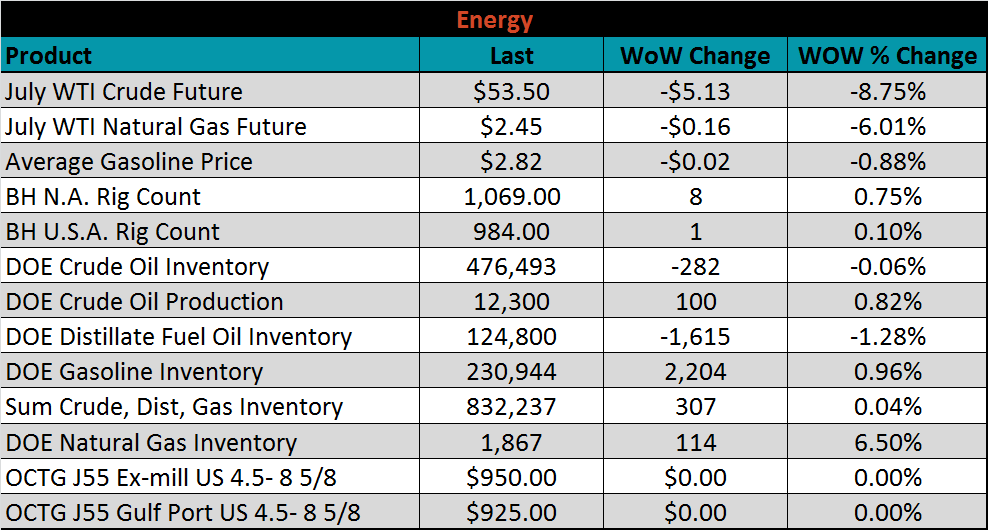
The ex-flat rolled prices are listed below.

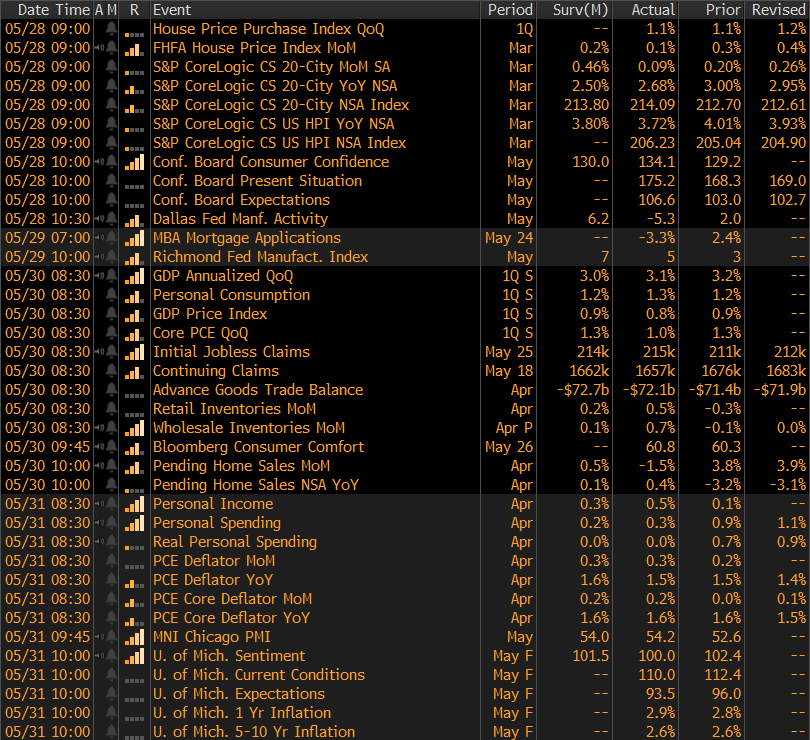
Below is the remainder of the economic data. The May Chicago PMI rose 1.6 points to 54.2 printing firmly in expansionary territory. The Dallas FED manufacturing index printed down to -5.3, and well below expectations of 6.2. A printing this low is likely impacted by unusually bad weather in Texas and the middle of the U.S. Finally, the University of Michigan May Sentiment Survey printed below the record high of April at 100, down 2.4 points.
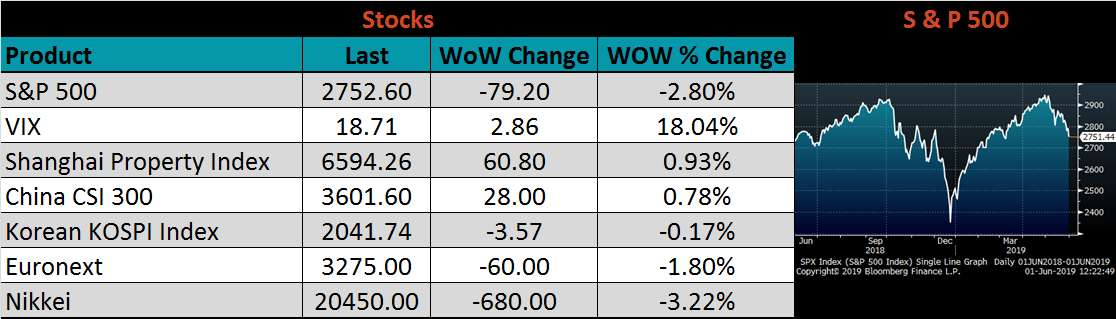
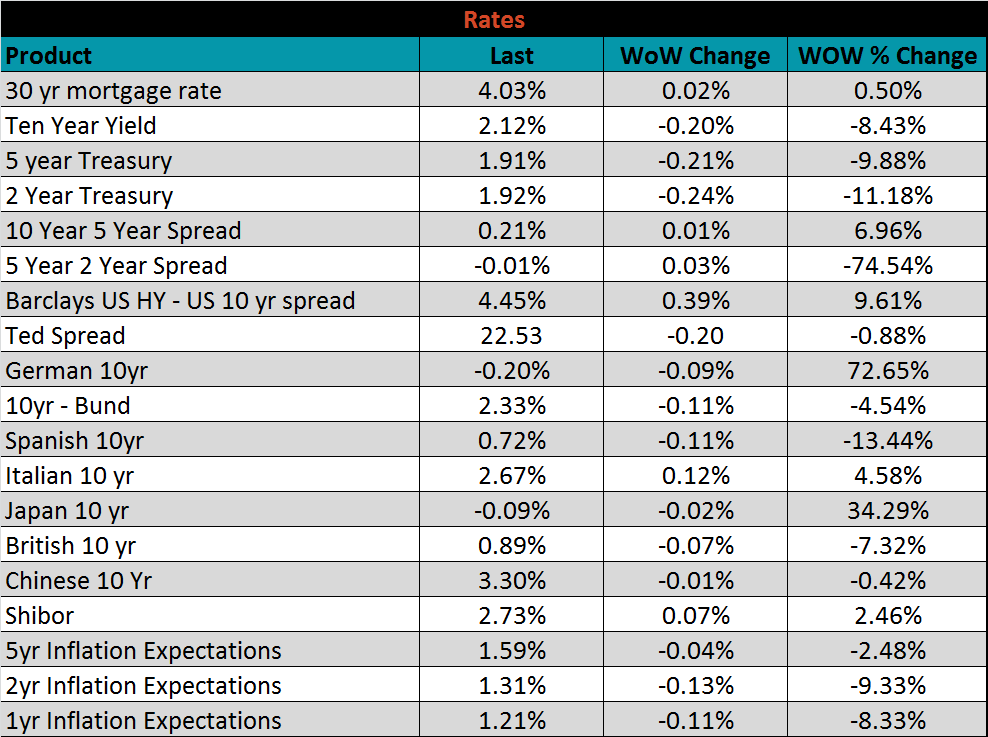
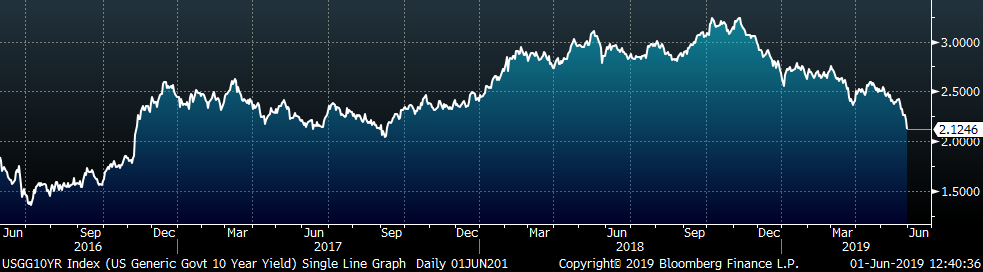
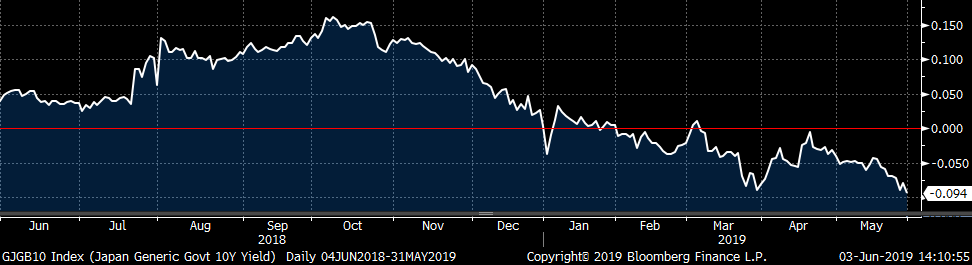
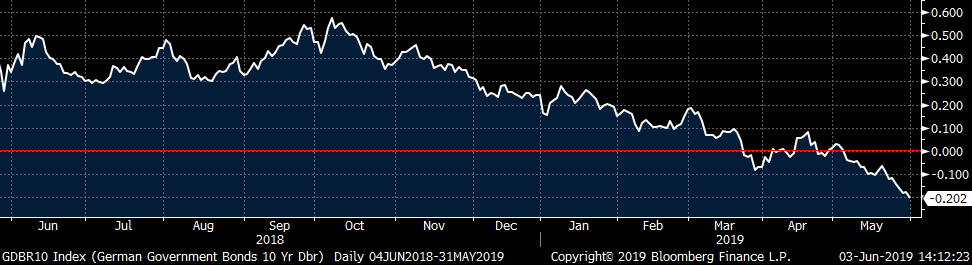
The U.S. 10-year treasury yield was down twenty basis points, closing the week at 2.12%. The Japanese 10-year yield was down two basis points to -0.09%. The German 10-year yield was down nine more basis points to -0.20%.
The U.S. 10-year treasury yield was down seven basis points, closing the week at 2.32%. The Japanese 10-year yield was down two basis points to -0.07%. The German 10-year yield was down one more basis points to -0.10%.
The list below details some upside and downside risks relevant to the steel industry. The orange ones are occurring or look to be highly likely. The upside risks look to be in control.
Upside Risks:
Downside Risks: