Content
-
Weekly Highlights
- Market Commentary
- Durable Goods
- Auto Sales
- Risks


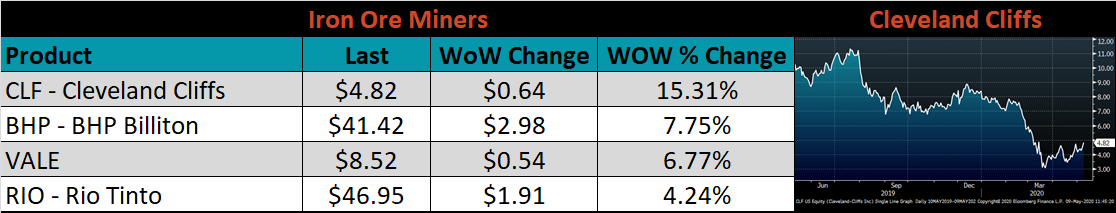
The week after a round of price increases from the mills, there were very few spot transactions as the market digested the new offer prices. Additionally, there were rumors that mills were looking to push a second price increase, which if successful, would push the spot HRC price firmly above $500/st. However, a more pressing concern for producers is their contract book’s discounted pricing, which is based on a lagging spot price index that currently sits in the mid $400s. Most of the contracted material’s price is based on index readings from this week, and the likely readings are pushing the mills to implement a unique structure to support their selling price – price floors.
Contract prices usually include a discount to the index, and the discounted price based on current index levels is below integrated mill’s cost of production. Due to strength in both the scrap and iron ore markets, the cost to produce has not dropped as much as the finished steel price. Rather than sell their contract tons – the majority of their order book for the month – at a loss, mills will put a floor on their selling price. Mills have the pricing power to do this because, as discussed last week, there is a shortage of supply in the market. Additionally, most contract buyers did not buy enough to meet their minimum threshold for tons over the past two months, and mills are not allowing them to take advantage of lower priced tons. A systematic hedging program could have helped buyers navigate these changing pricing dynamics!
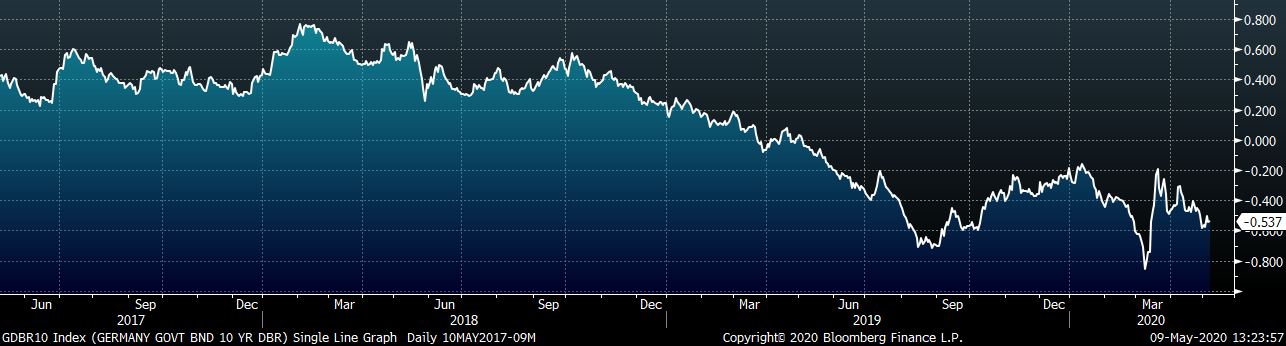
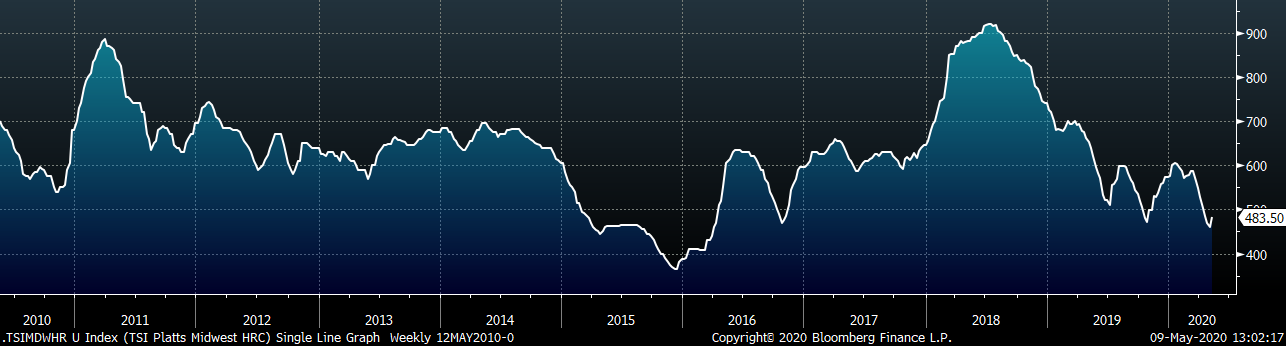
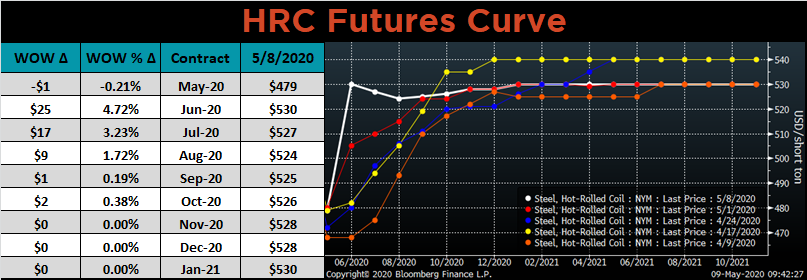
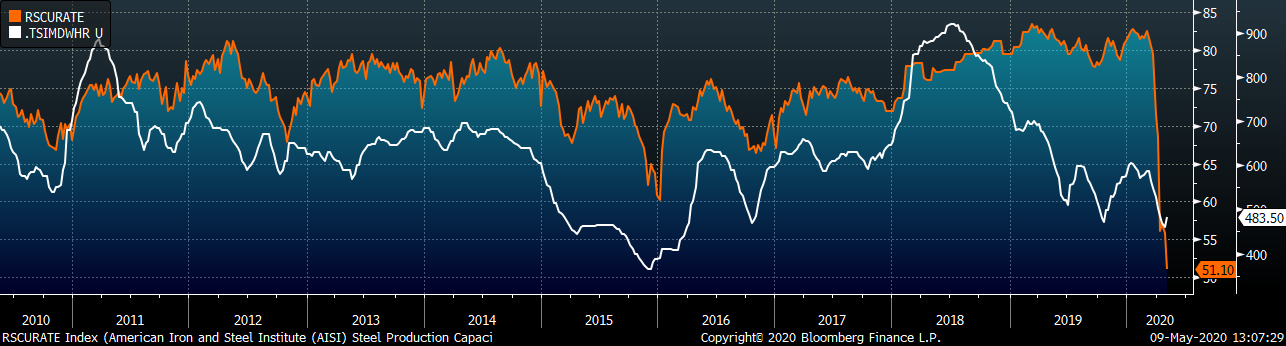
Moving to pricing outlook over the next few months, further upside in pricing is expected as mandated shutdowns end and economic recovery begins. The scrap market for next month continues to look strong as the tightness in supply persists. Additionally, prices in China continue to grind higher, giving an indication of the expected recovery in other countries. As the coronavirus outbreak hit both the population’s health and financial markets in China a month before it spread globally, the economic recovery around the world should lag China by about 30 days. The below chart shows the USD price in short tons for both the domestic Chinese HRC price in orange and a 30 day lagged Platts TSI Midwest HRC index in white.
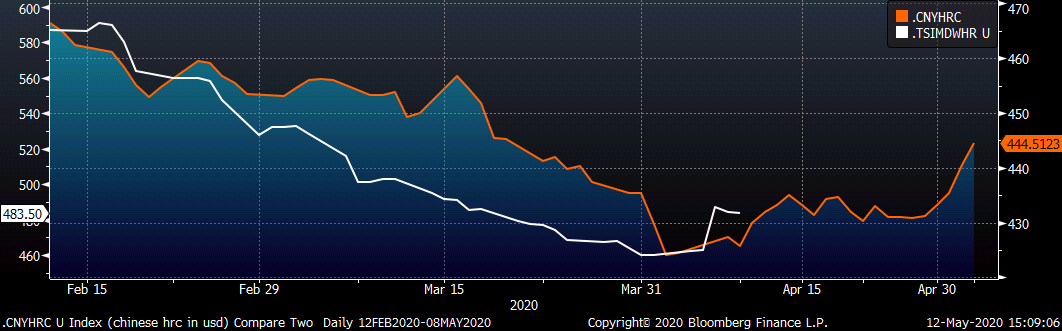
The recent bottom in domestic HRC spot prices aligns with when the China price bottomed 30 days prior. If the domestic price continues to follow the Chinese price recovery, spot prices should move above $520/st by next month. Interestingly, the forward curve moved last week to a flat structure at $520 starting in the June expiration back into 2021. With the curve expecting a similar price rally over the next month, we will be focusing on where the domestic China price goes for an indication on the next domestic price direction. Additionally, we will likely need to see lead times extend for prices to continue this price rally. While mills have raised their offer prices, we have not yet seen buyers come in at those higher levels. Lead times pushing out will indicate that mills are filling their order book at those higher prices.
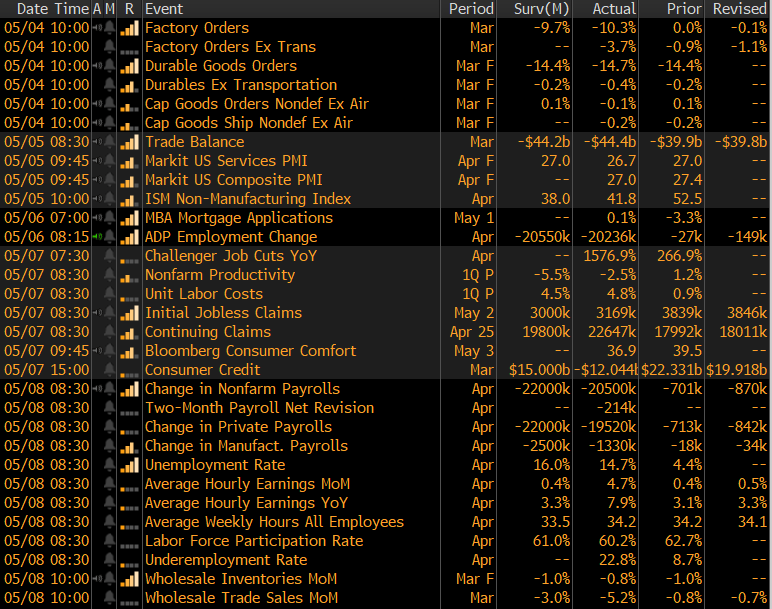
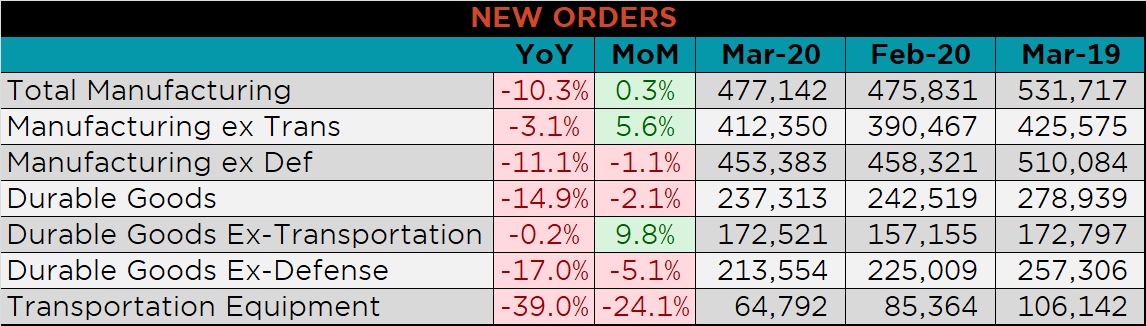
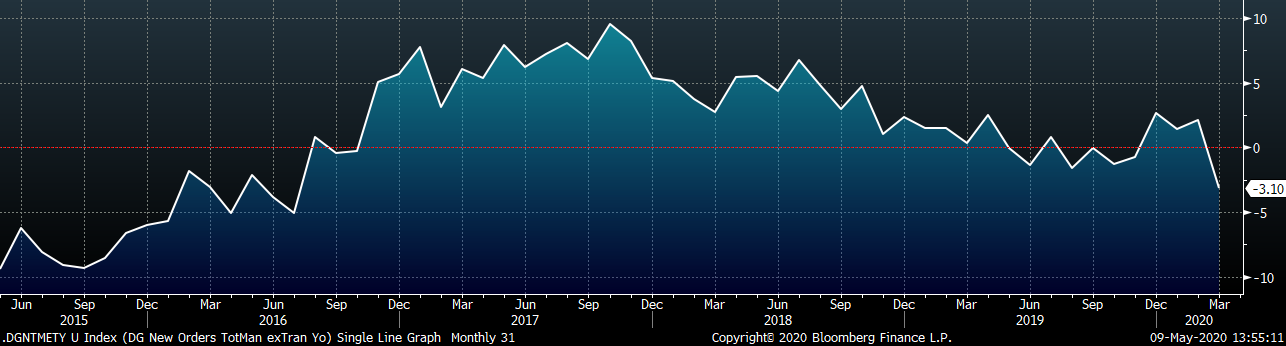
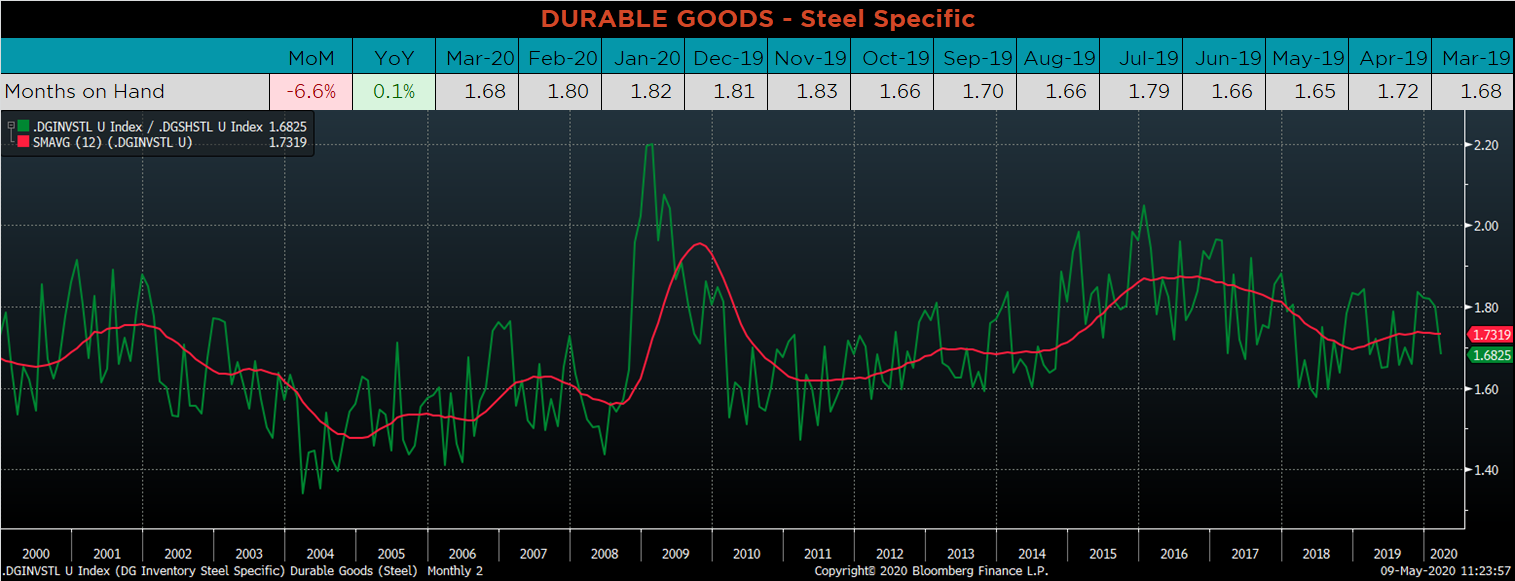
Below are final March new orders from the Durable Goods report. Overall, new orders for manufactured goods were slightly higher MoM, while they were significantly lower YoY. Manufacturing new orders ex-transportation decreased 3.1% compared to March 2019. The final chart looks at the months on hand (inventory divided by shipments) for durable goods categories that are steel intensive. MOH decreased, as monthly inventories were essentially unchanged compared to increasing shipments.
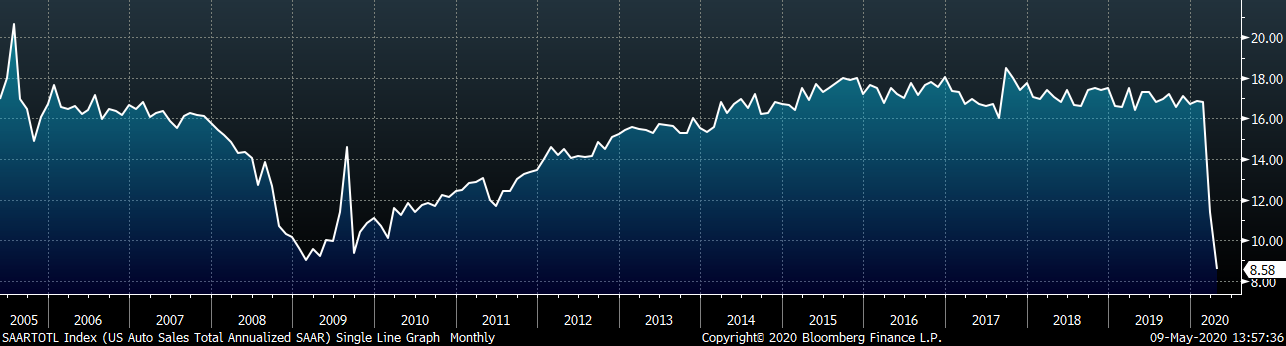
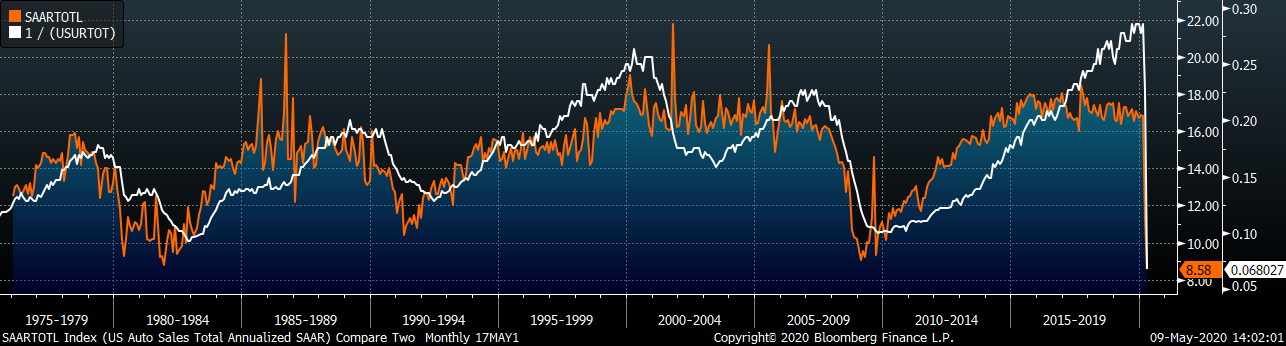
April U.S. light vehicle sales decreased significantly, to a 8.58m seasonally adjusted annualized rate (S.A.A.R), just below the low seen in 2009. The second chart shows the relationship between the unemployment rate and auto sales. The unemployment rate is inverted to show that declining unemployment typically leads to increasing auto sales. Due to the shelter-in-place orders, annualized auto sales and the labor market suffered significantly. While this reaction was all but expected, the question of “What will the recovery look like?” looms large against this backdrop.
Below are the most pertinent upside and downside price risks:
Upside Risks:
Downside Risks:
The Platts TSI Daily Midwest HRC Index was up $14.75 to $483.50.
The CME Midwest HRC futures curve is below with last Friday’s settlements in white. The front of the curve spiked higher. From June on, the curve is essentially flat between $525/$530.
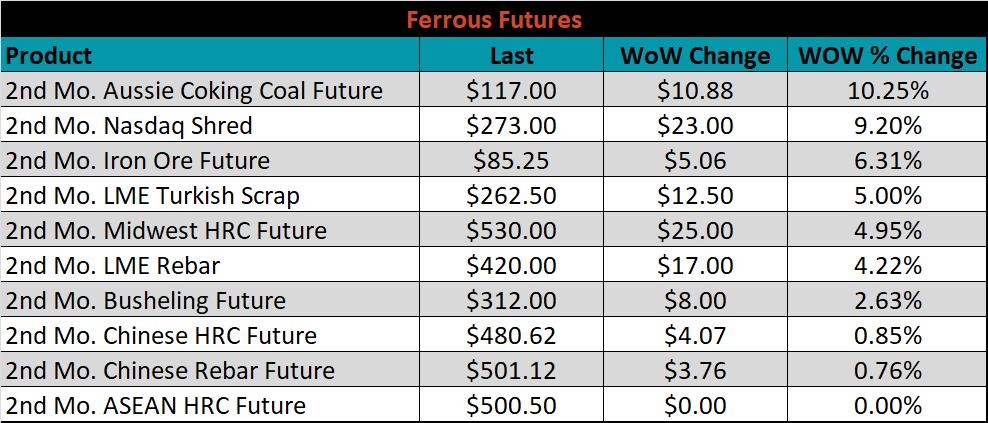
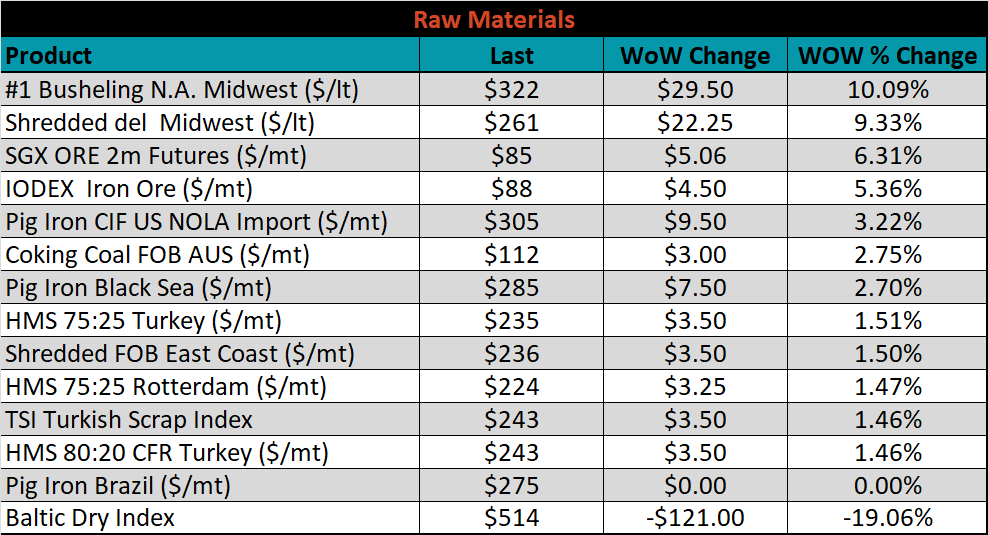
May ferrous futures were mostly higher, led by Aussie coking coal and Nasdaq shred, each gaining 10.3% and 9.2%, respectively.
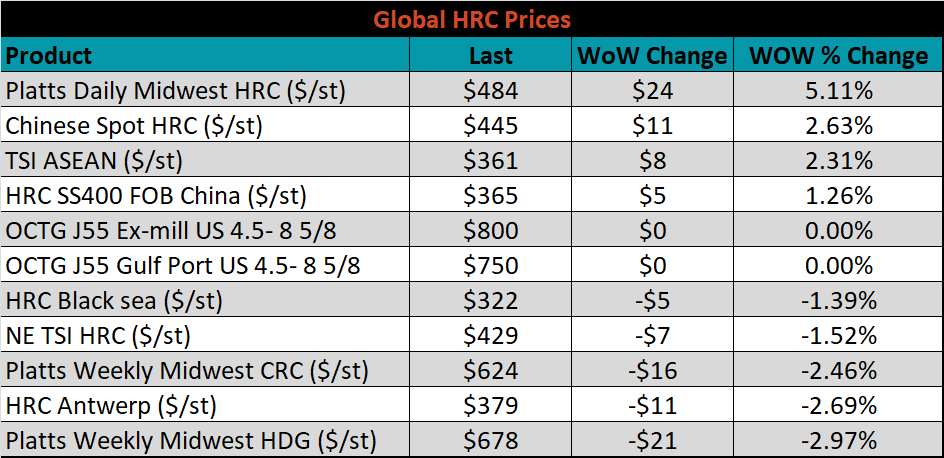
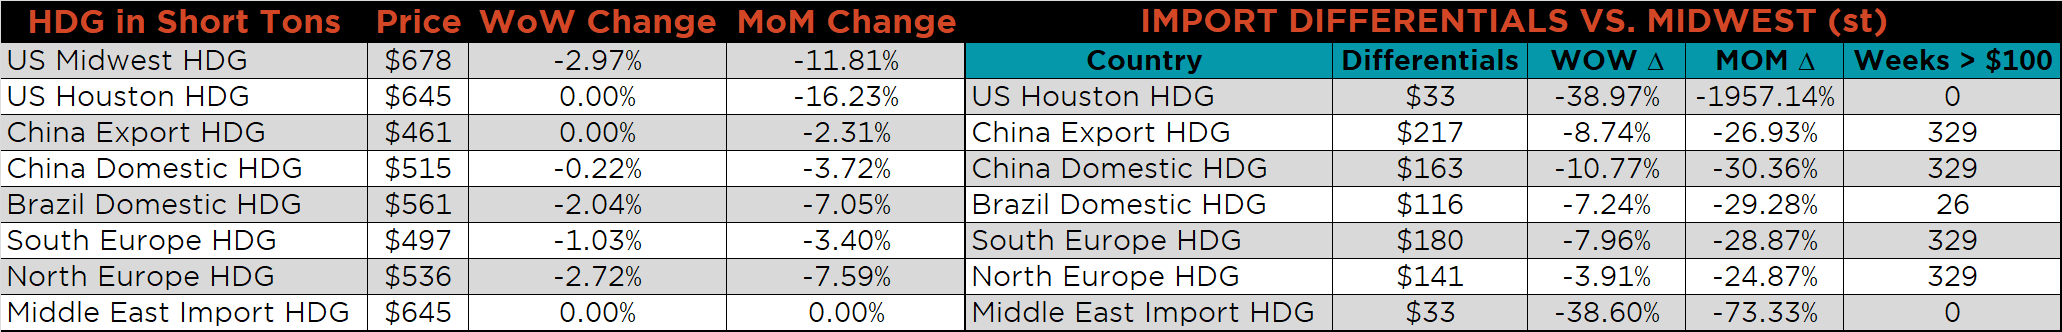
The global flat rolled indexes were mixed. Platts Midwest HRC was up 5.1%, while Platts Midwest HDG was down 3%.
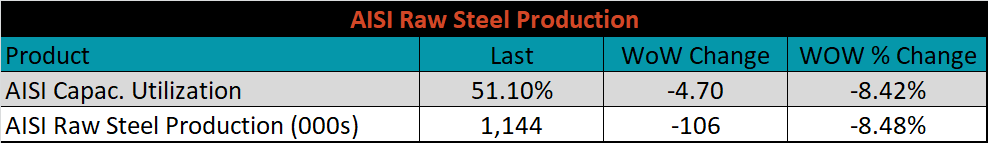
The AISI Capacity Utilization Rate was down another 4.7% to 51.1%.
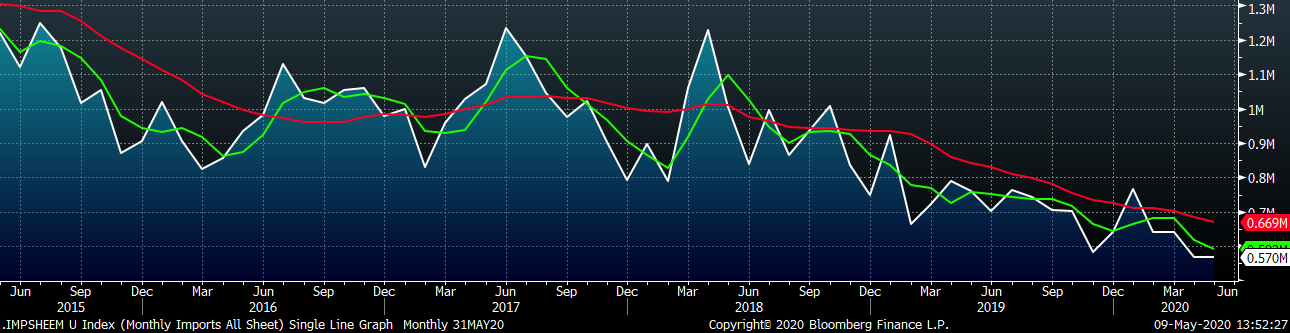
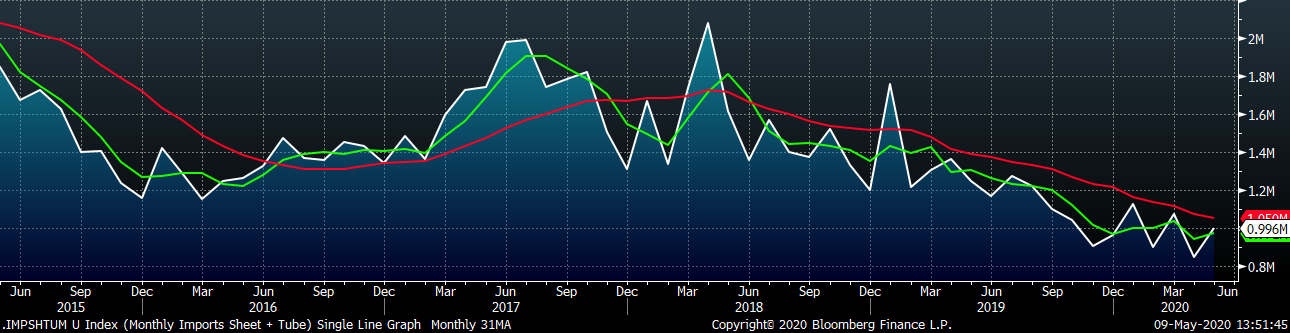
April flat rolled import license data is forecasting a slight increase of 1k to 570k MoM.
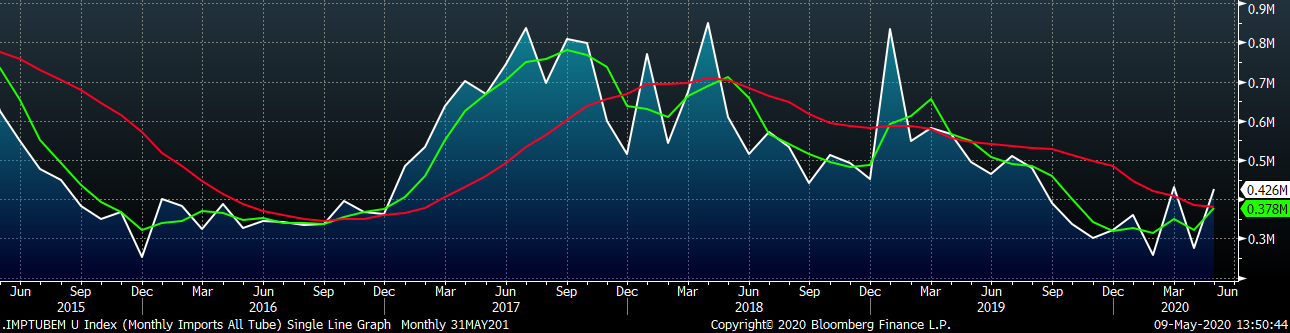
Tube imports license data is forecasting a MoM increase of 150k to 426k tons in April.
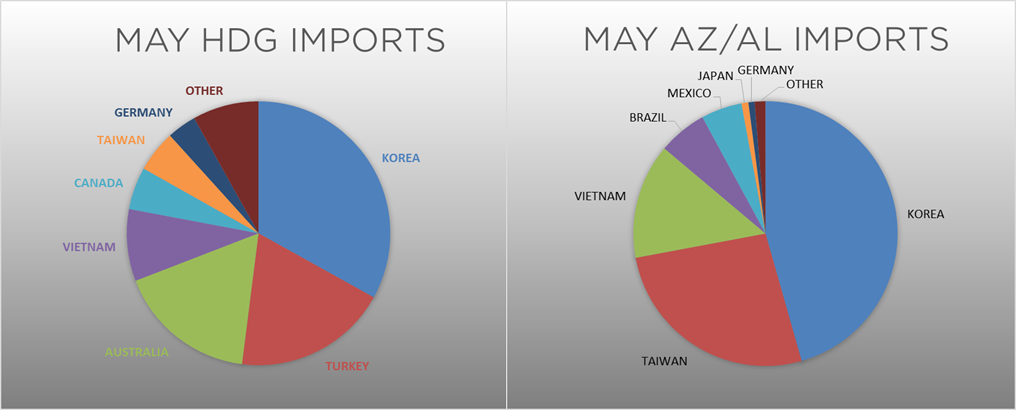
AZ/AL import license data is forecasting an increase of 18k in April to 62k.
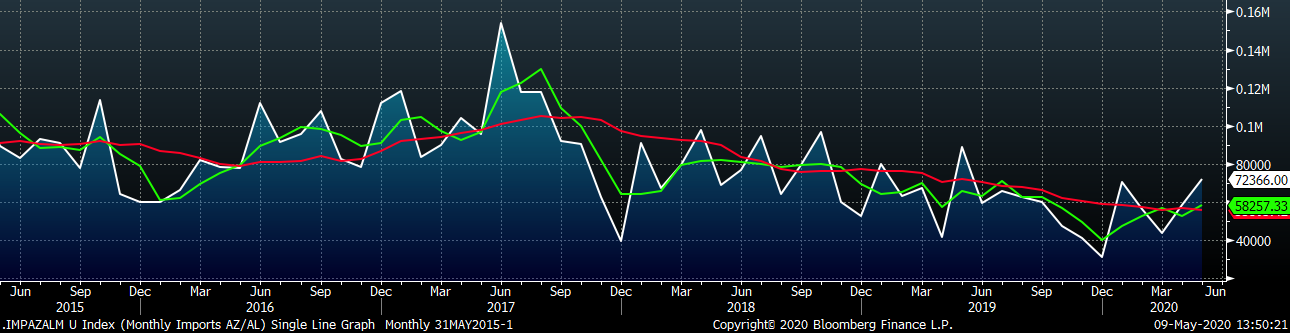
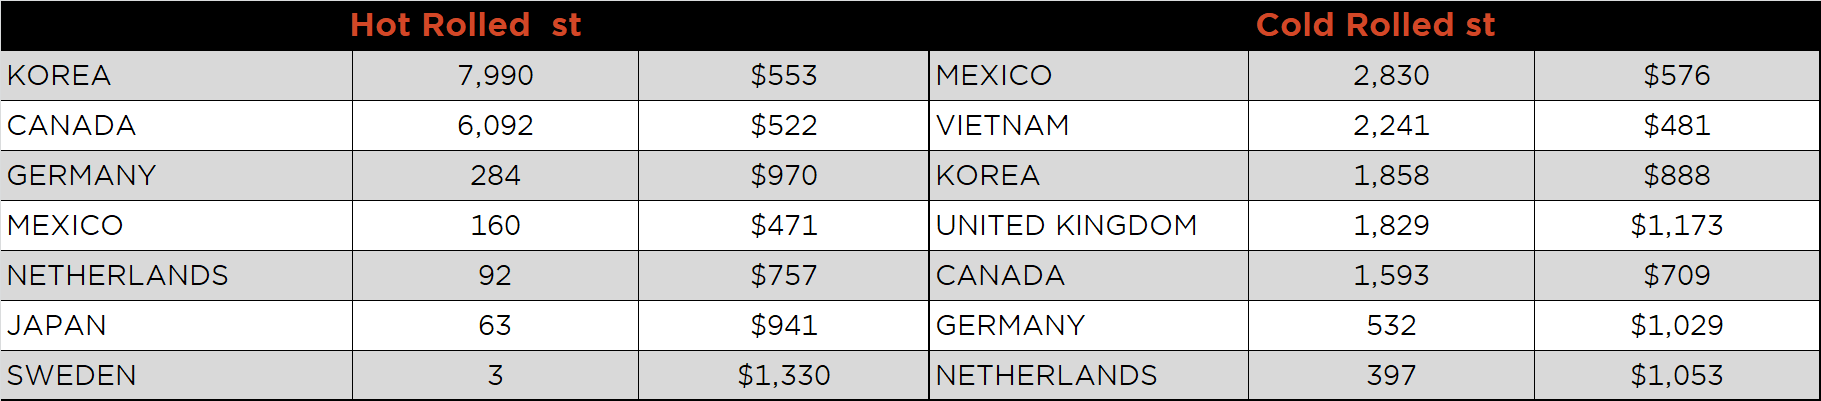
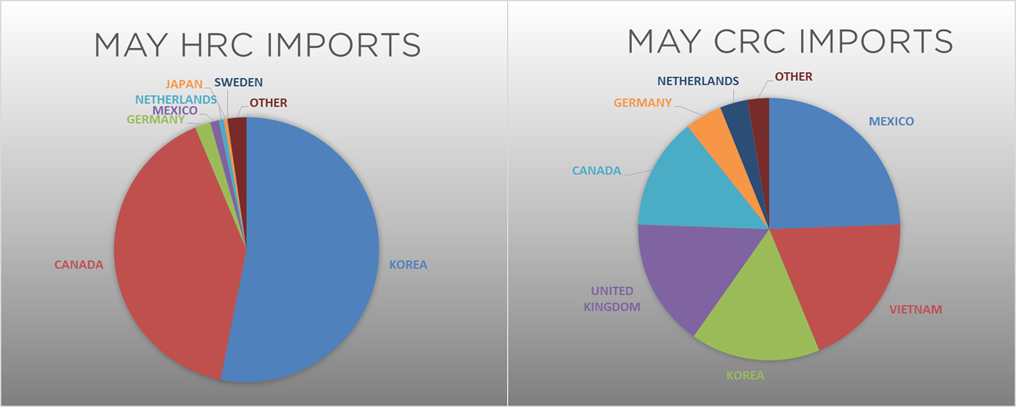
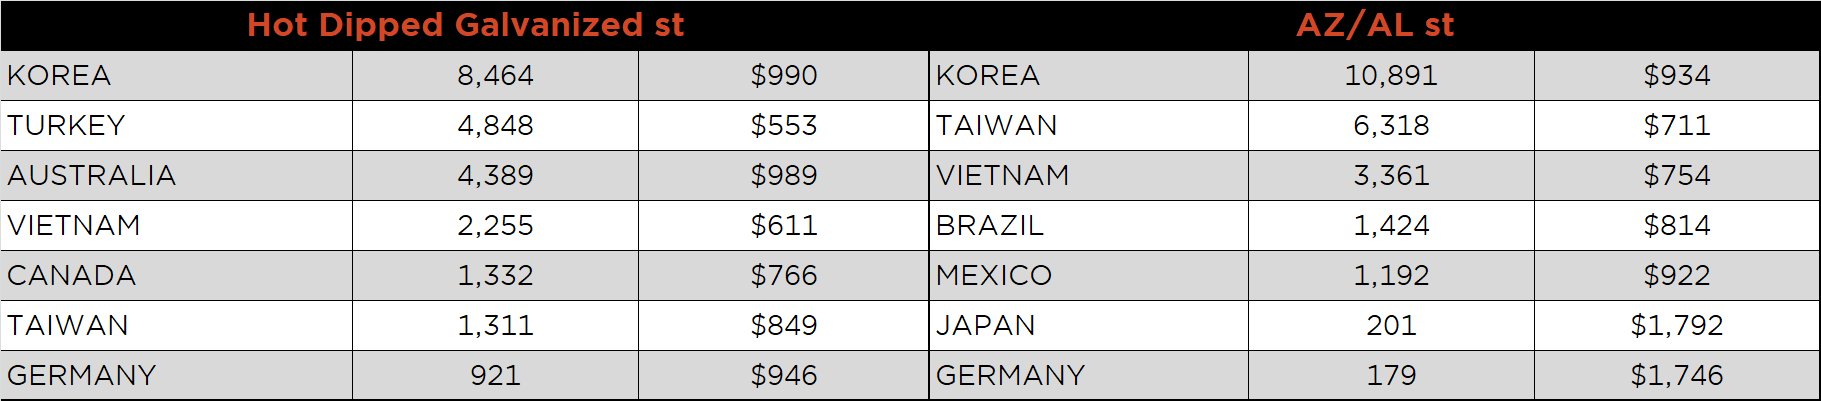
Below is May import license data through May 5, 2020.
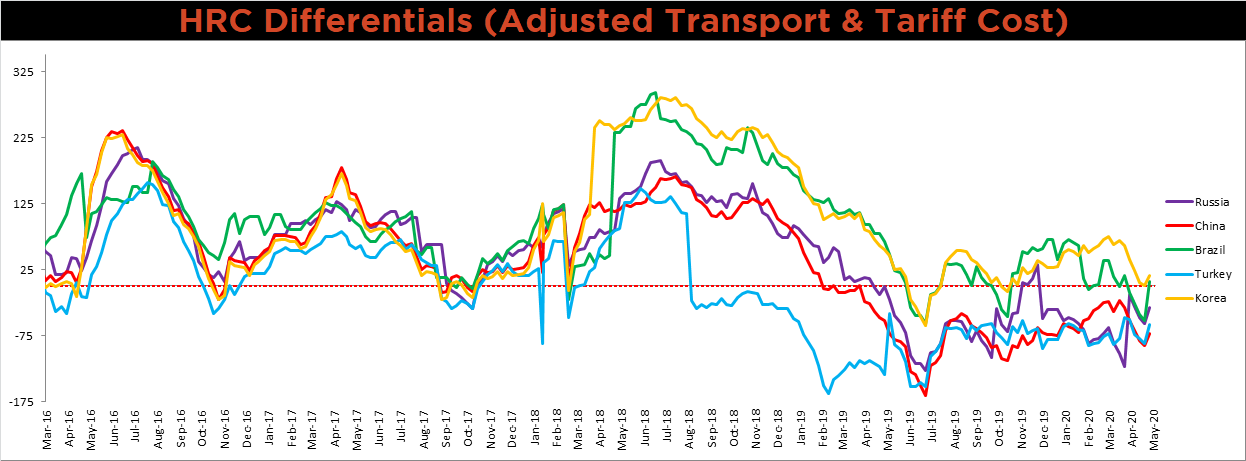
Below is the Midwest HRC price vs. each listed country’s export price using pricing from SBB Platts. We have adjusted each export price to include any tariff or transportation cost to get a comparable delivered price. All five countries differentials increased dramatically as the U.S. domestic price ended its 8-week decline.
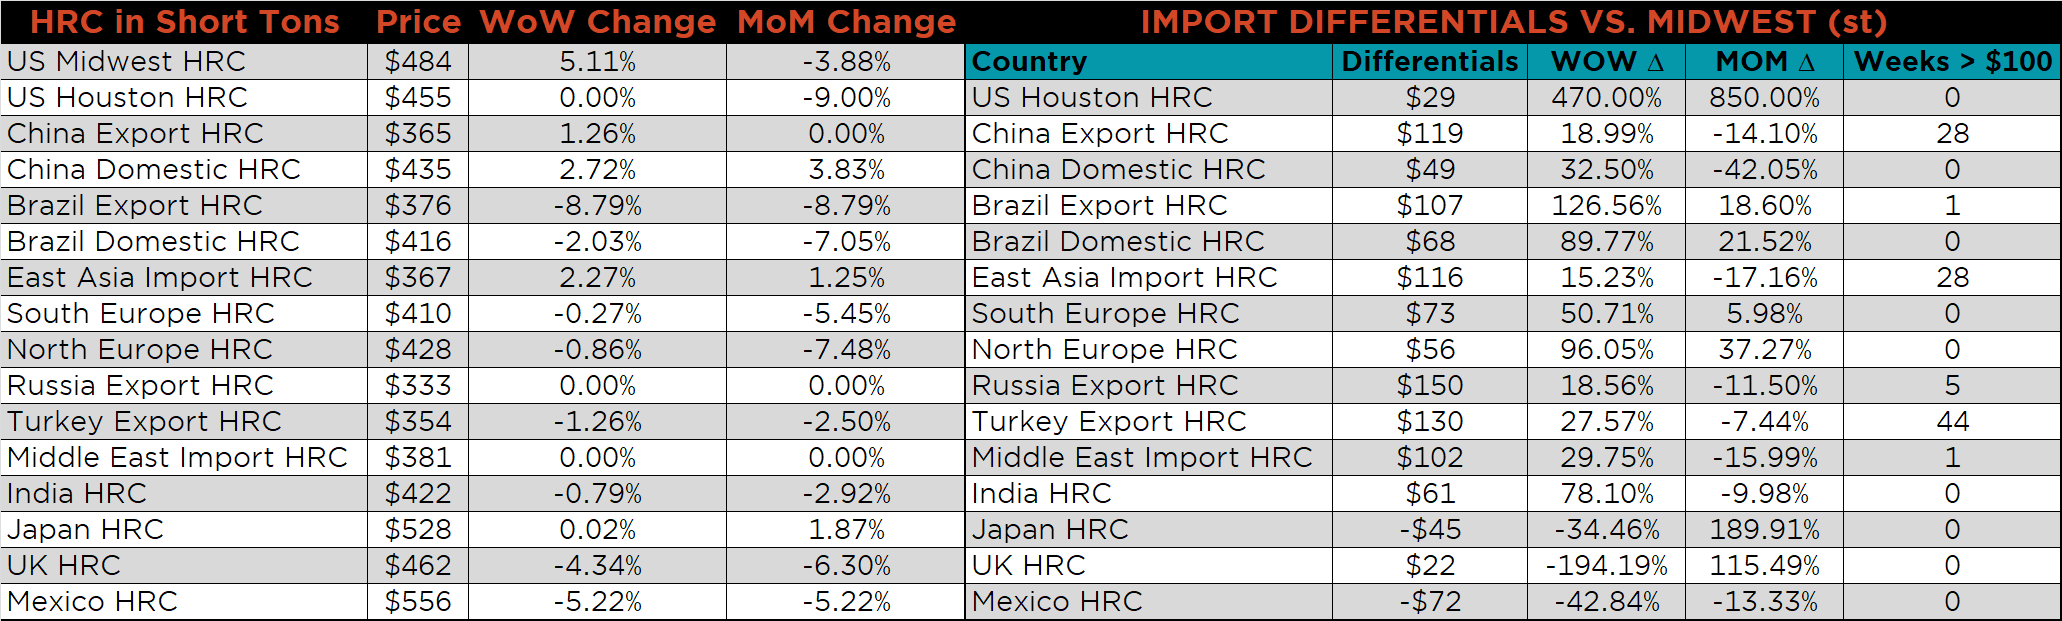
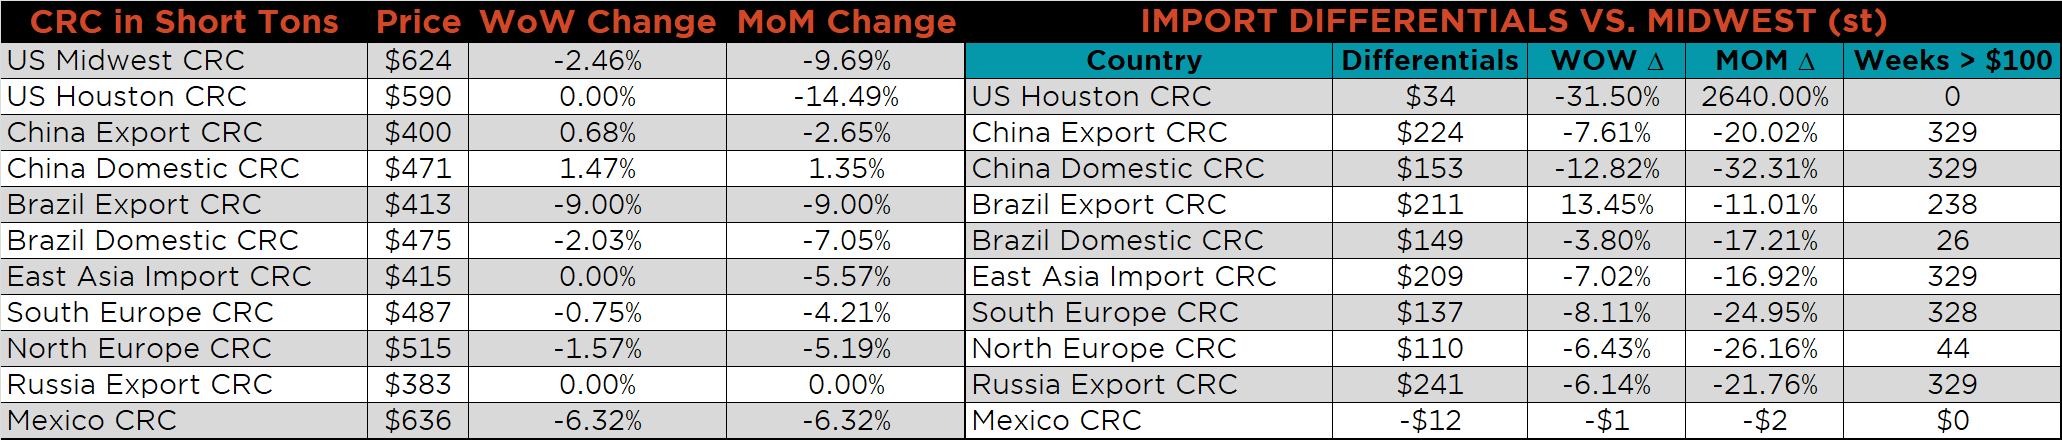
SBB Platt’s HRC, CRC and HDG pricing is below. The Midwest HRC price was up 5.1%, while the HDG and CRC prices were down 3% and 2.5%, respectively. Globally, the Brazilian export CRC and HRC prices were down, 9% and 8.8%, respectively.
Raw material prices were mostly higher. Midwest Busheling was up 10.1%, while the Baltic Dry Index was down 19.1%.
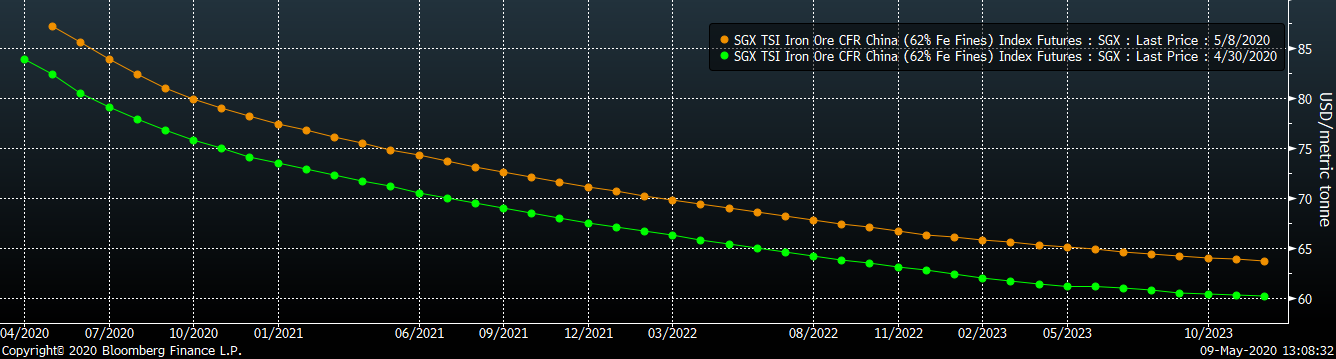
Below is the iron ore future curve with Friday’s settlments in orange, and the prior week’s settlements in green. The entire curve shifted higher.
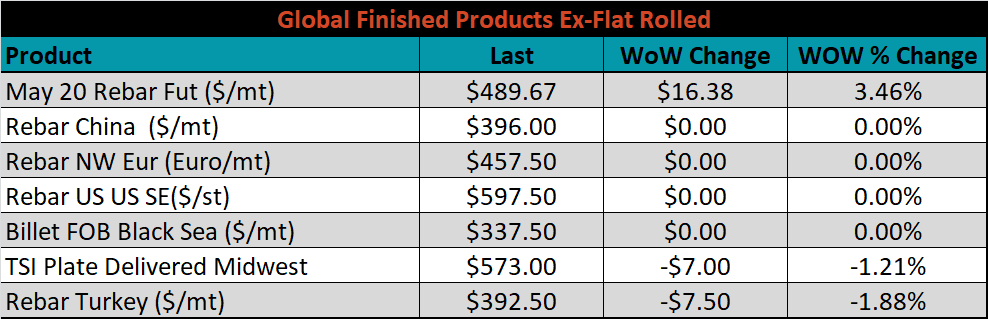
The ex-flat rolled prices are listed below.

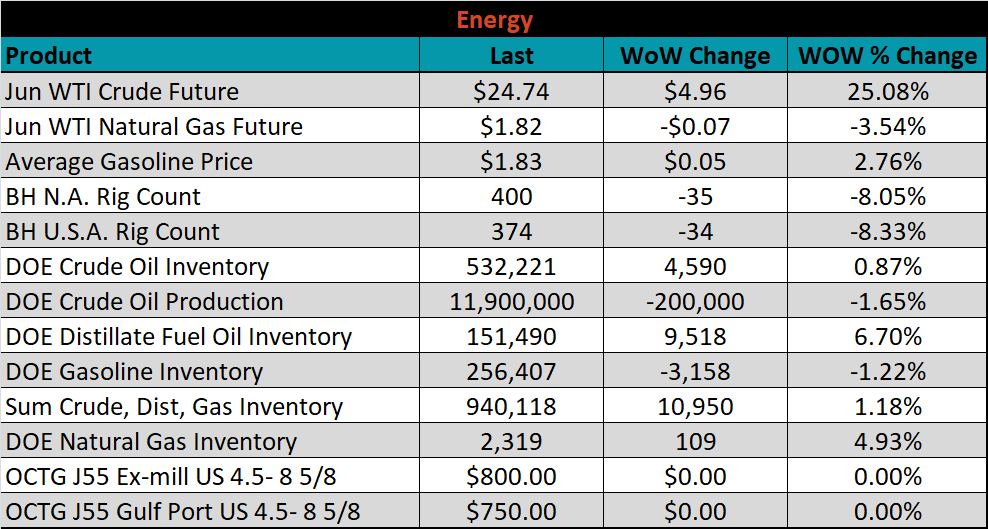
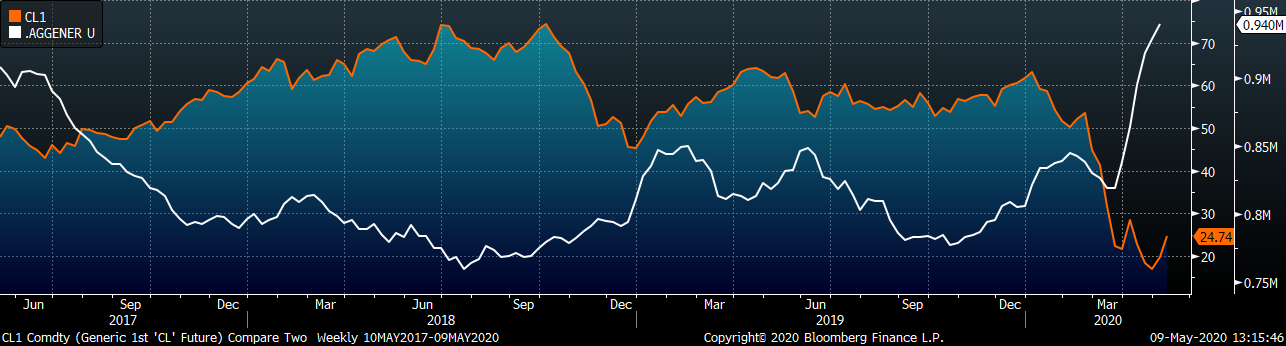
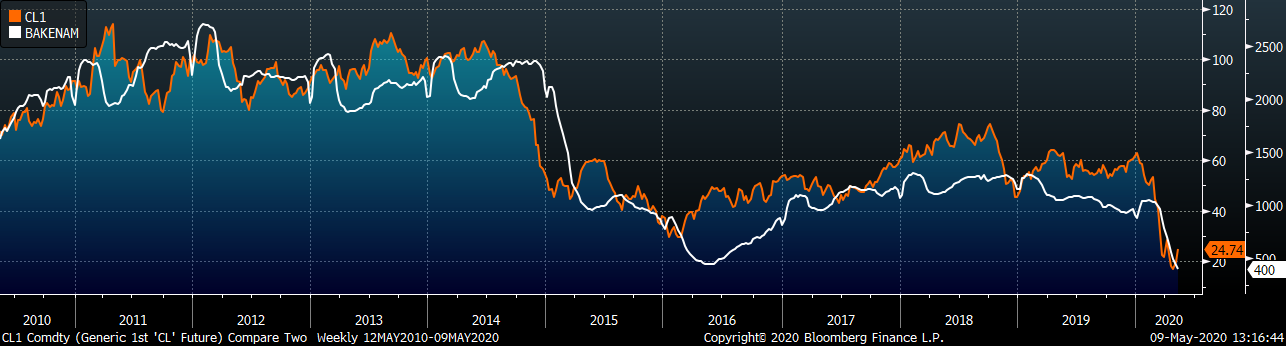
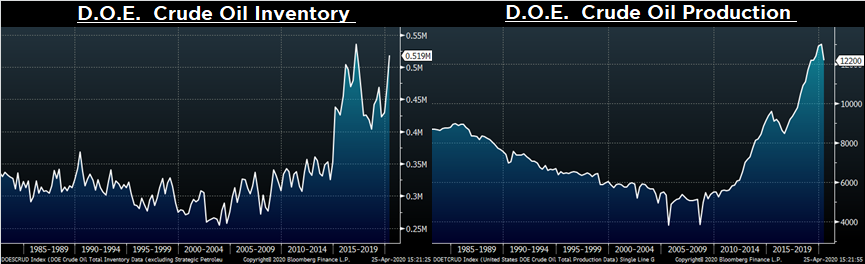
Last week, the June WTI crude oil future gained $4.96 or 25.1% to $24.74/bbl. The aggregate inventory level was up 1.2% and crude oil production was down to 11.9m bbl/day. The Baker Hughes North American rig count was down another 35 rigs, below the recent bottom in 2016, and the U.S. rig count was down 34 rigs.
The list below details some upside and downside risks relevant to the steel industry. The orange ones are occurring or look to be highly likely. The upside risks look to be in control.
Upside Risks:
Downside Risks: