

November 5, 2021

Market Commentary
Last week, was a quiet week in the physical and financial steel markets. The trend lower in spot prices continued, and while transactions are rare, they are clearly happening at lower prices than mills initial offerings and leading to a wide range in the assessments. At this point, most mills have closed their orderbooks for December and are sitting tight before offering spot tons in January. In the remainder of this report, we will dig into the economic data points released early last week.
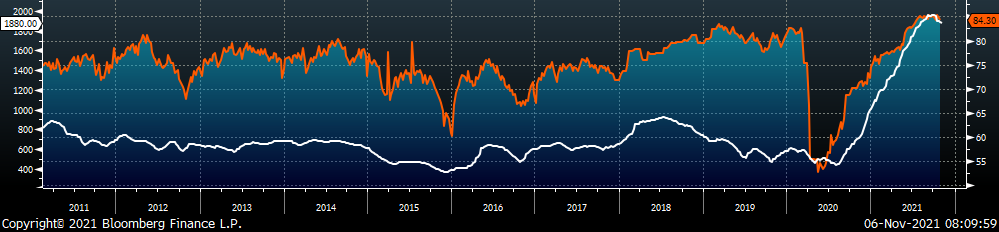
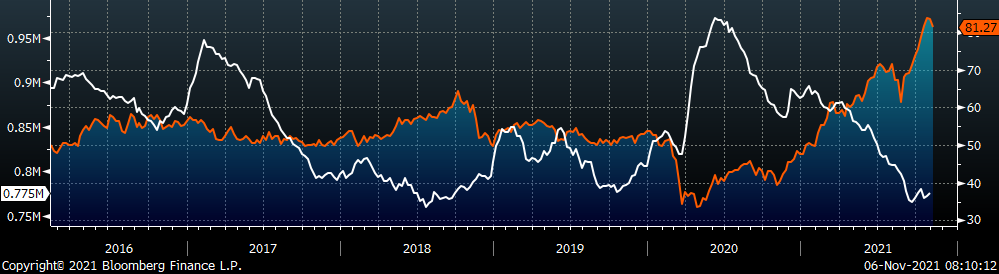
While the overarching trend of strong demand within steel intensive sectors continued, some signals suggest the original drivers of growth may have recently peaked and the lagging industries have yet to hit their stride. First, inventories remain low but are increasing. Second, the slowing YoY growth in residential construction is not being made up for by improvements in non-residential construction spending yet. Finally, the ISM Manufacturing new orders subindex, while still elevated, increased at its slowest pace since the initial recovery began. To be clear, none of these signals are “red alerts” and are likely more illustrative of seasonality and logistics problems rather than precursors of major demand problems. However, this has allowed mills to catch up on orders, operate more efficiently and brought the price off record highs. On the other side, the energy sector, has remained on the sideline for most of the pandemic recovery. This is largely due to the expressed desire from the Biden administration to move away from oil and gas energy sources, however this sector is shaping up to be a potential bridge for steel demand going into next year. The chart below shows the Oil and Gas Rig Counts in the U.S (white) and the 2nd month crude oil future (orange).
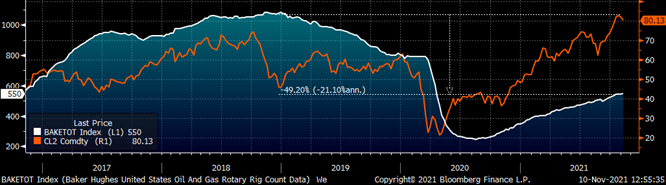
Demand for oil and gas is above pre-pandemic levels, while supply has been slow to react. The current rig count is nearly 50% below the recent peak in late 2018 and consolidation among drillers has increased their discipline in bring new rigs online. Prices have been well above the breakeven level for an extended period and there is a strong outlook going forward. While the rate of change and ceiling are dependent upon whether the administration explicitly stands down, the current number of rigs are far below fundamental values based on the crude oil price. The last thing to keep in mind is that the order and purchase of steel will occur approximately 6 months before increases to the rig count data is reported, meaning orders would be placed right now for late-2Q22.
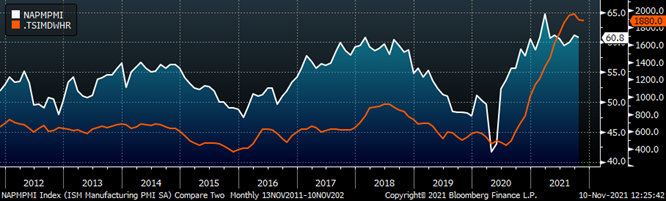
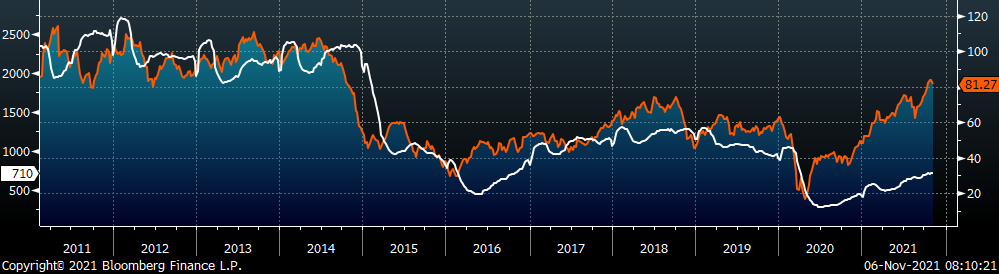
The chart below is the Platts Midwest HRC index (orange) and the ISM Manufacturing PMI (white). While the overall ISM Manufacturing PMI printed slightly lower than last month, it remains well in expansion territory. This level of sustained expansion (prints above 50) continues to be unprecedented, with 9 prints above 60 in one period. These staggering levels continue to buoy demand for steel and the record high prices.
ISM PMI
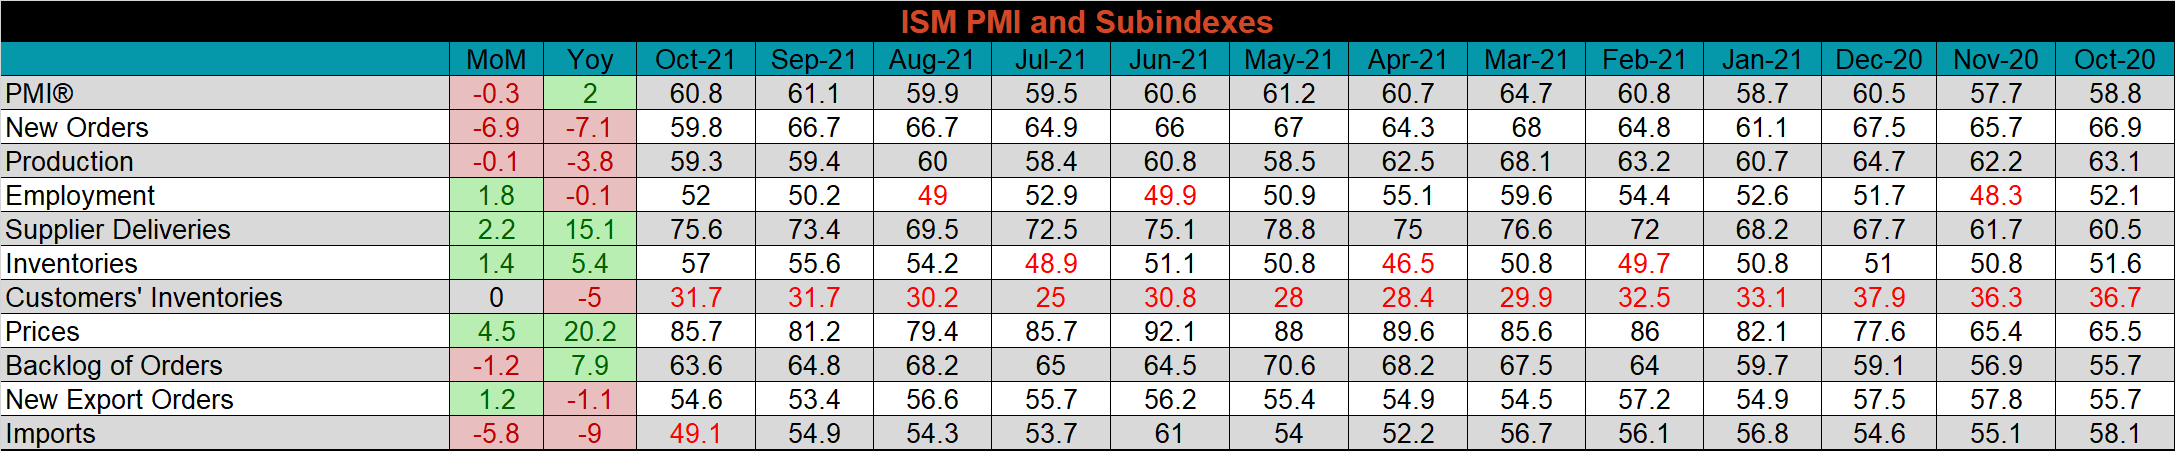
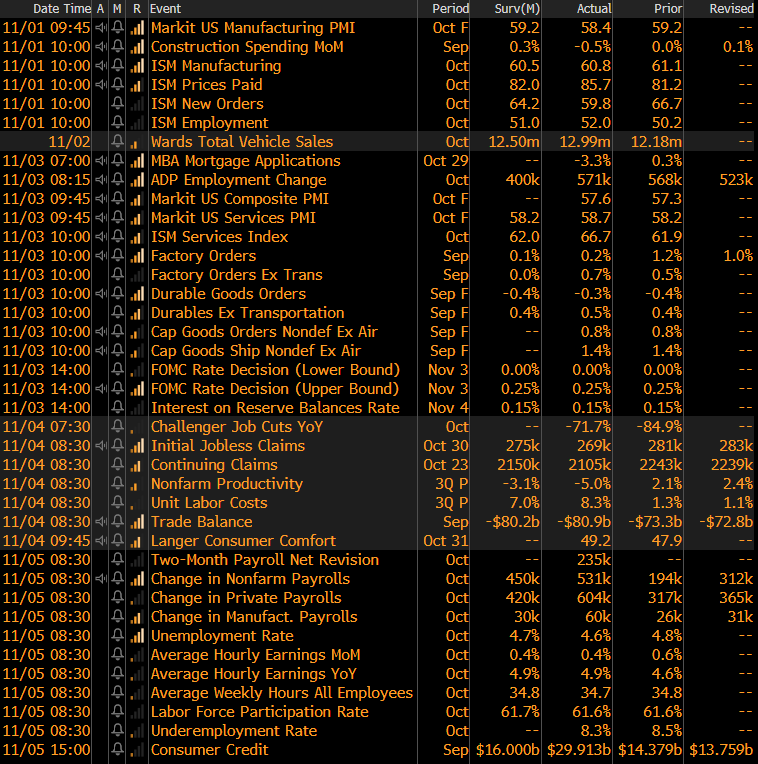
The October ISM Manufacturing PMI and subindexes are below.
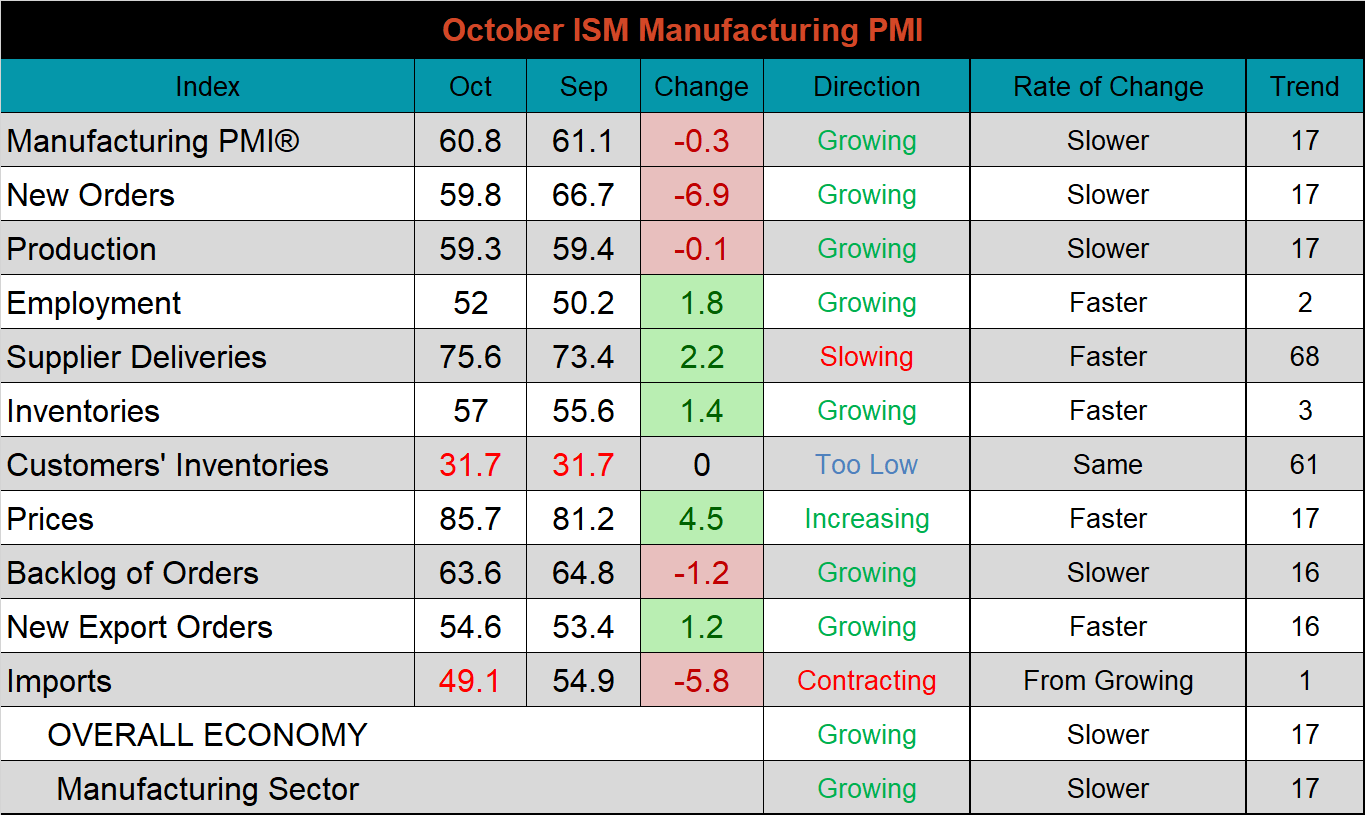
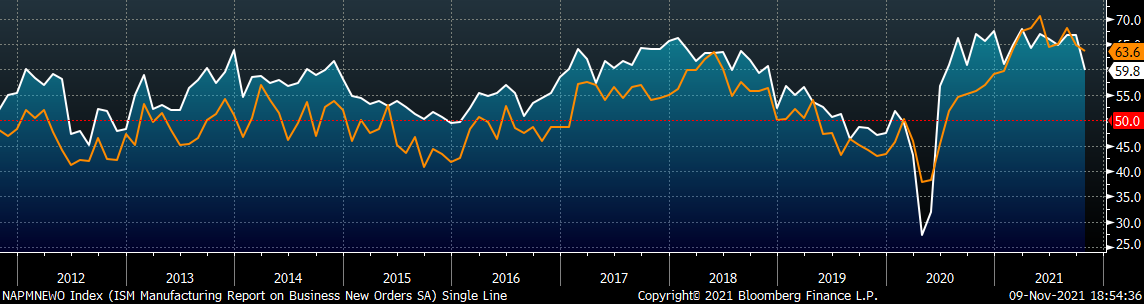
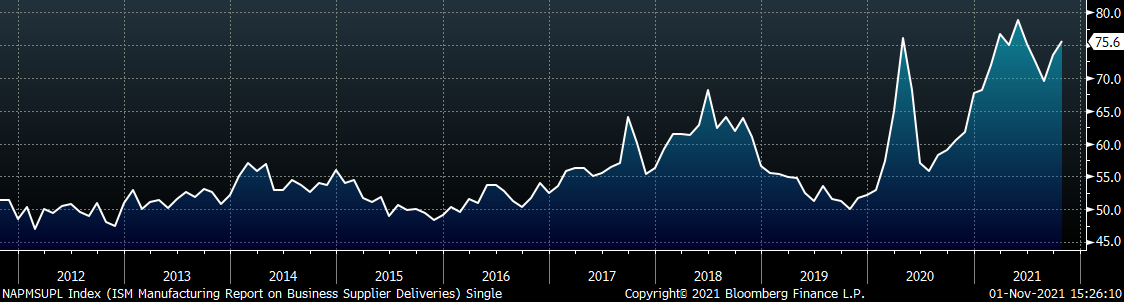
As mentioned above in the market commentary, the new orders subindex is currently printing at its lowest level of expansion since June 2020. With the additional context of a slightly lower backlog that remains over 60, we retain an optimistic perspective that this move is more caused by logistics problems (final chart below), than reduced demand. The final chart shows the supplier deliveries subindexes, which pushed higher for the second month in a row, another clear signal that the higher logistic costs will likely remain well into the beginning of 2022.
ISM Manufacturing PMI New Orders Subindex (white) & Backlog Subindex (orange)
ISM Manufacturing Supplier Deliveries
The table below shows the historical values of each subindex over the last year.
Global PMI
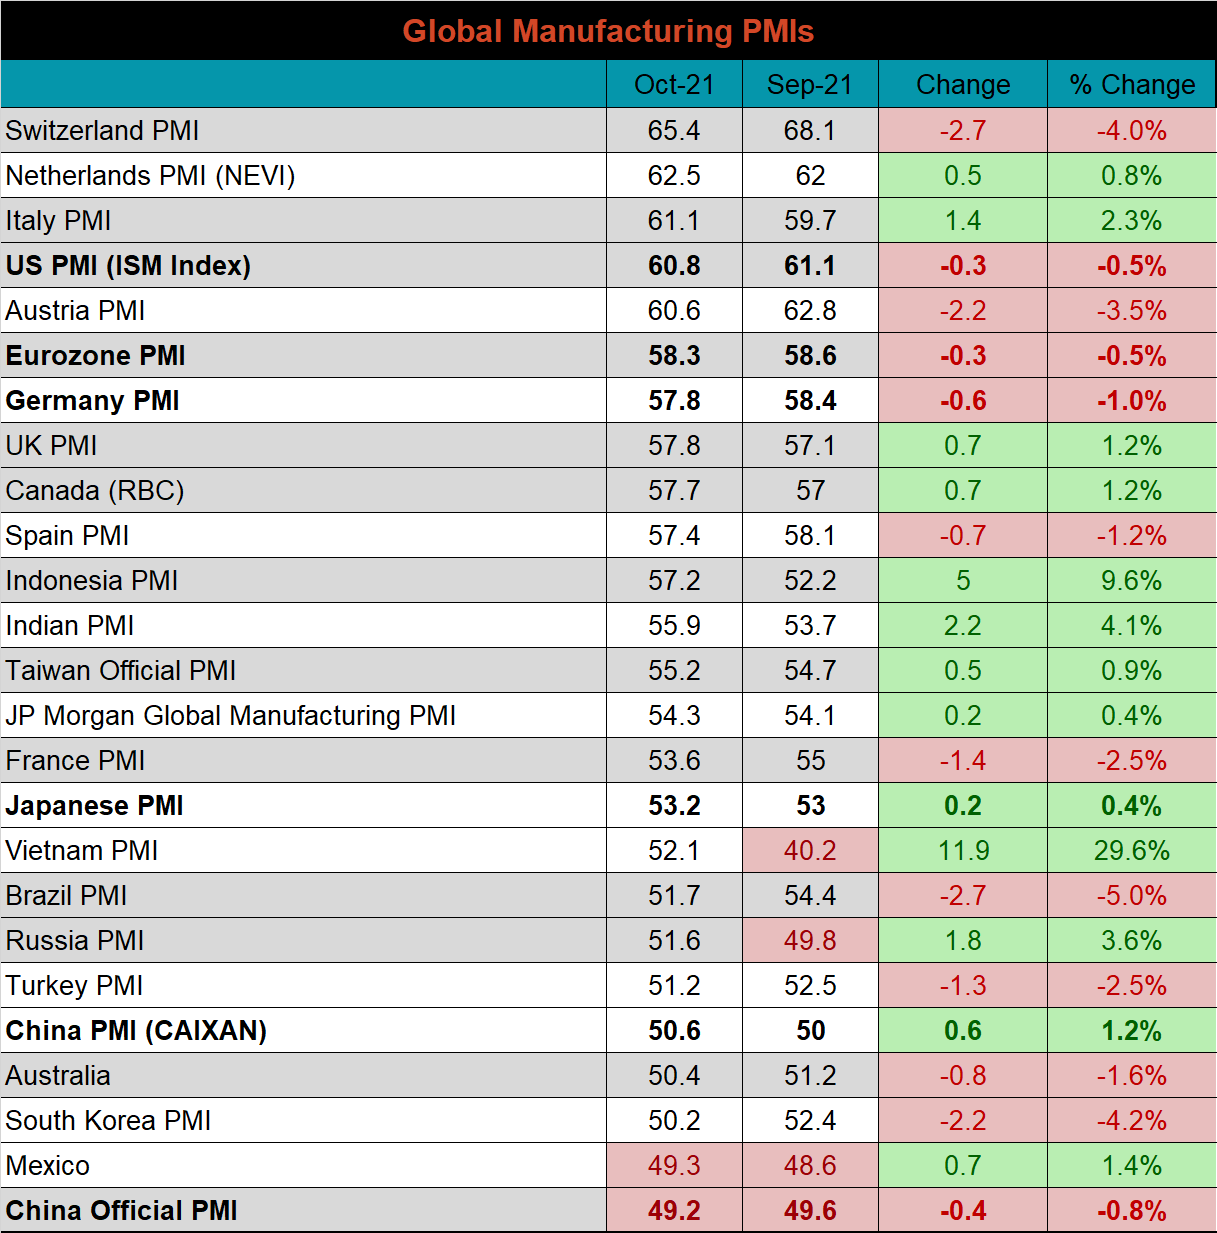
The October global PMI printings were mostly lower; however, 22 of the 23 watched countries saw growth from their respective manufacturing industries. The five most significant countries (bold) continue to expand, except for the Chinese (Official) PMI.
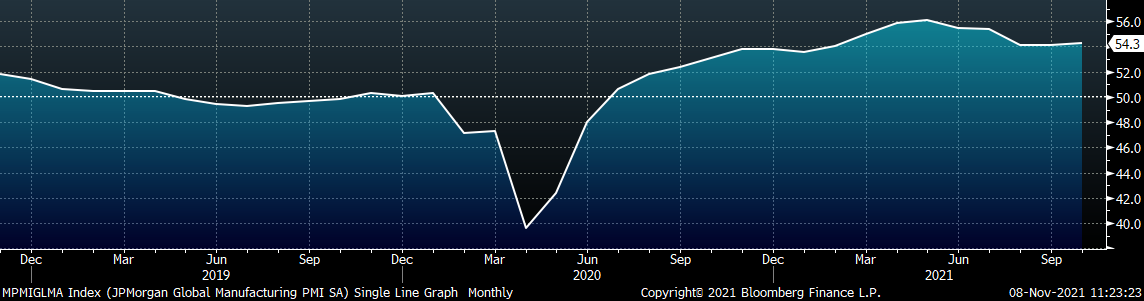
J.P. Morgan Global Manufacturing
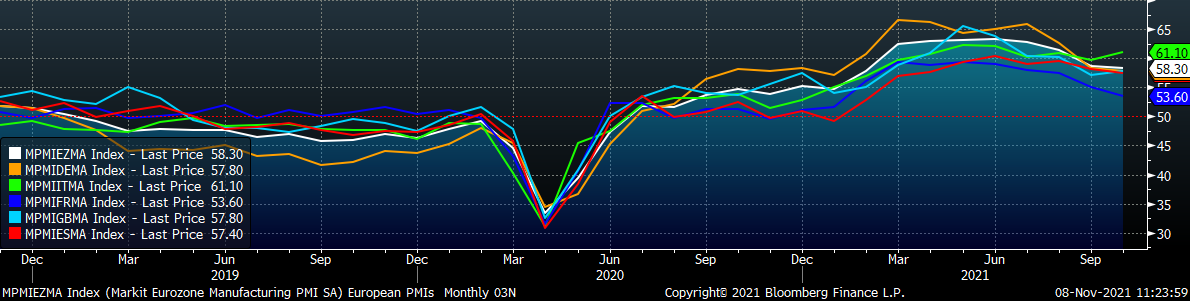
Eurozone (white), German (orange), Italian (green), Spanish (red), and French (blue), U.K. (teal) Manufacturing PMIs
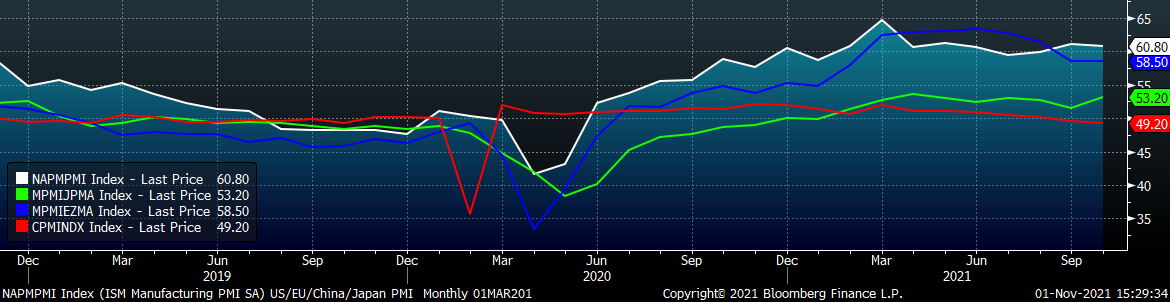
US (white), Euro (blue), Chinese (red) and Japanese (green) Manufacturing PMIs
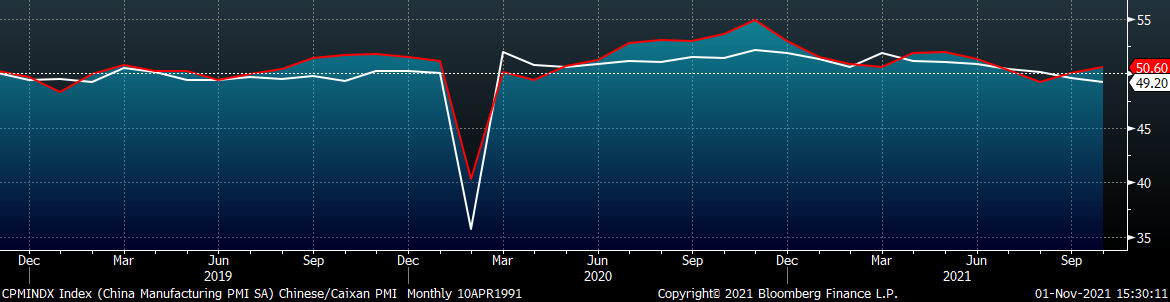
China’s official manufacturing PMI fell further into contraction, while the Caixan PMI increased and moved into expansion.
China Official (white) and Caixan (red) Manufacturing PMIs
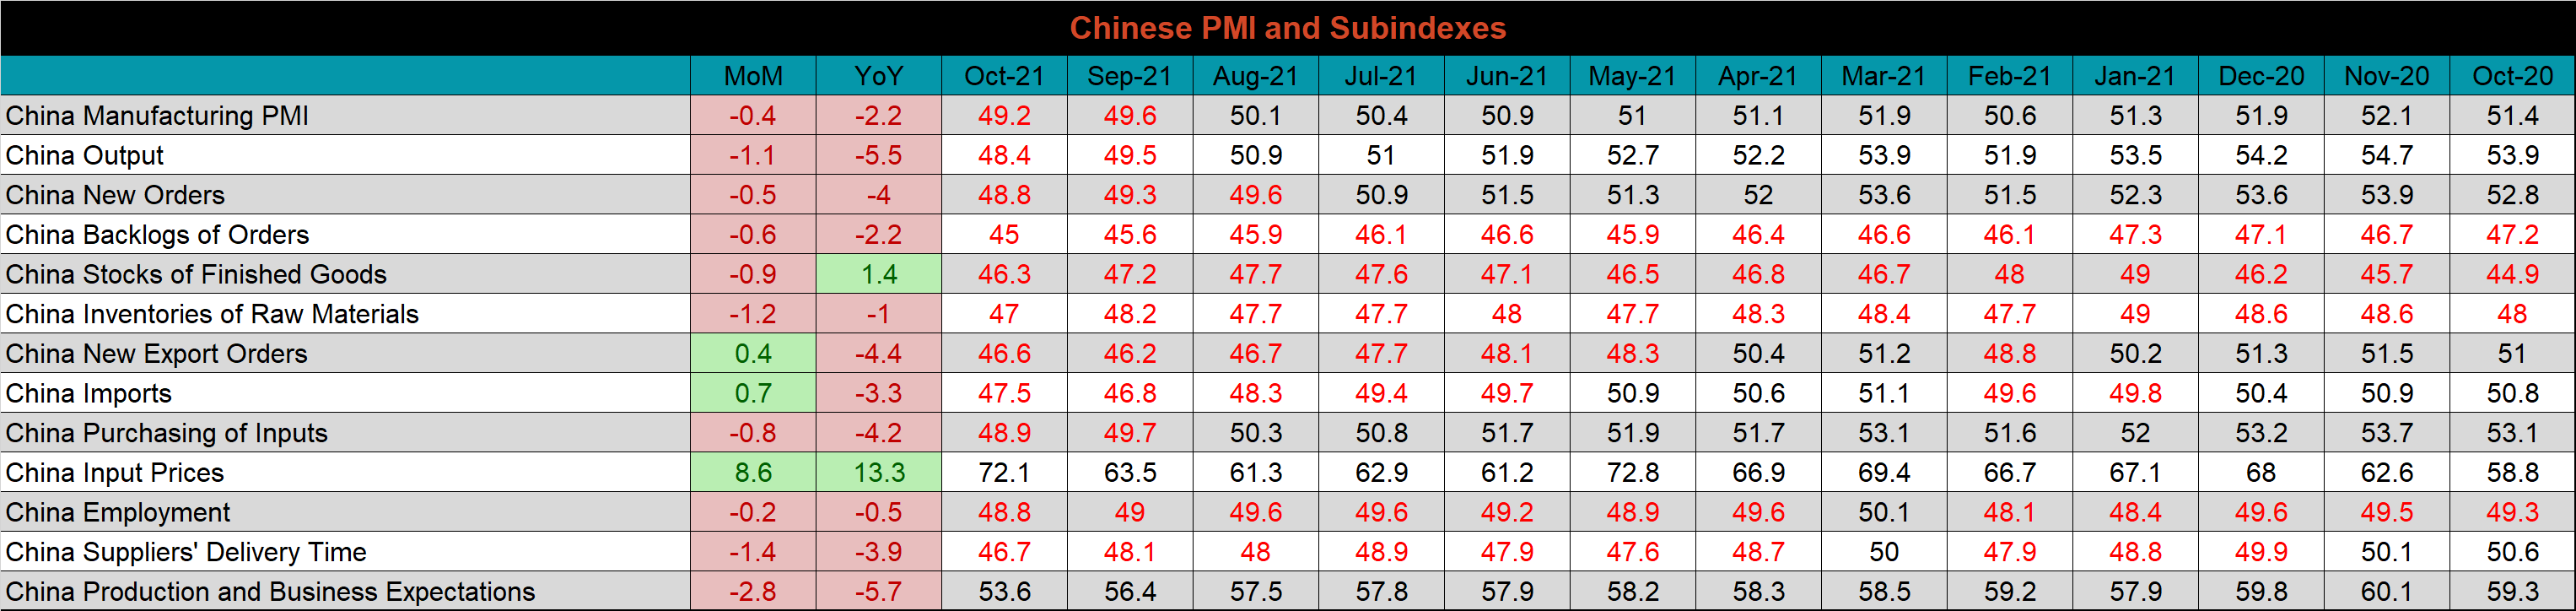
The table below breaks down China’s official manufacturing PMI subindexes. October’s subindexes continue to show the significant pressure on China, where they are uniquely impacted on higher input prices.
Construction Spending
September seasonally adjusted U.S. construction spending was down 0.5% compared to August, but 7.8% higher than September 2020.
September U.S. Construction Spending
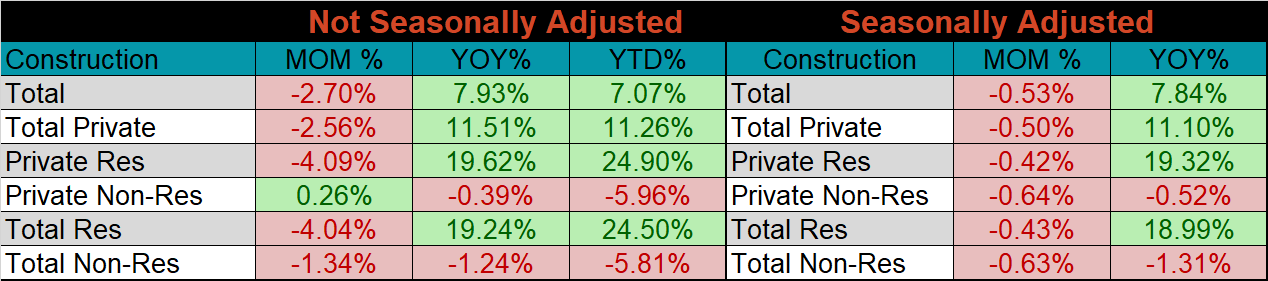
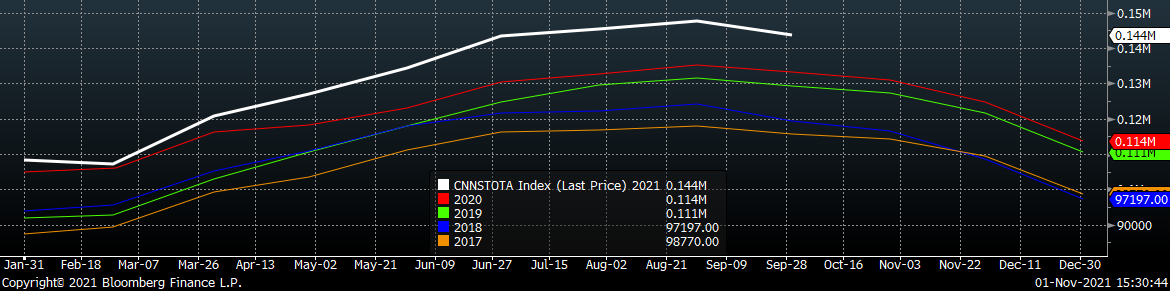
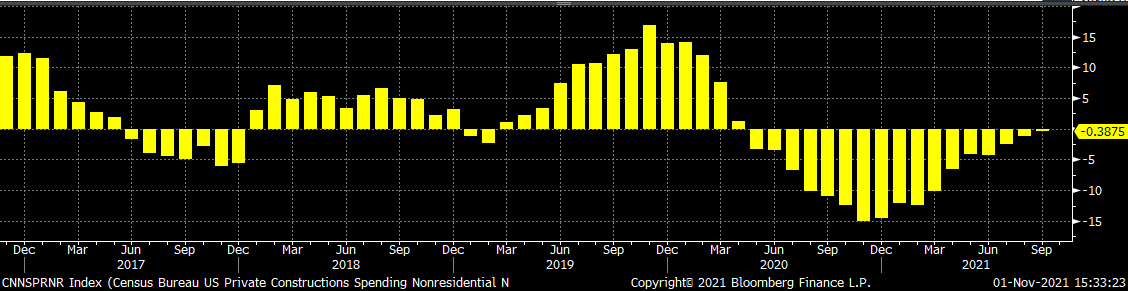
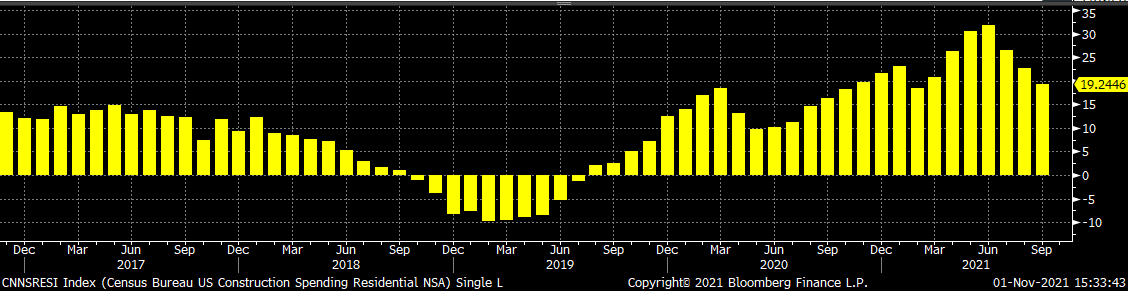
The white line in the chart below represents not seasonally adjusted construction spending in 2021 and compares it to the spending of the previous 4 years. Total spending continues to expand and is at its highest level in the last 4 years. The last two charts show the YoY changes in construction spending. Private non-residential spending decreased in September but continues to trend closer to year-over-year growth. Residential spending remains strong, with 25 straight months of YoY growth.
U.S. Construction Spending NSA
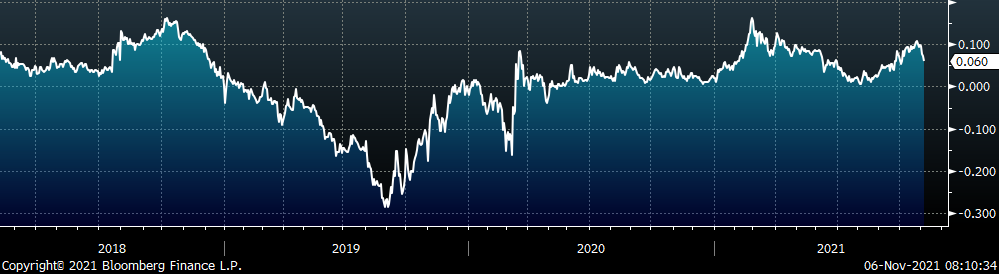
U.S. Private Nonresidential Construction Spending NSA YoY % Change
U.S. Residential Construction Spending NSA YoY % Change
Durable Goods
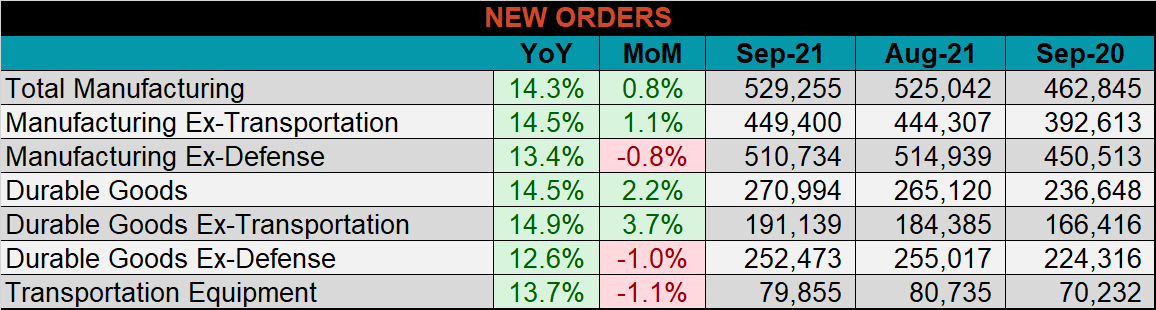
Below are final September new orders from the Durable Goods report. New orders for manufactured goods were up 14.3% compared to September 2020 and up 0.8% compared to August. Manufacturing ex-transportation new orders were up 14.5% compared to August 2020 and 1.1% higher than in August.
September U.S. Durable Goods New Orders NSA
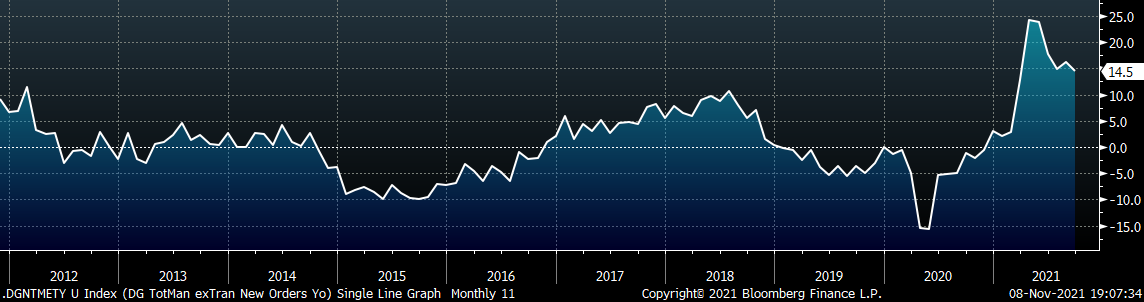
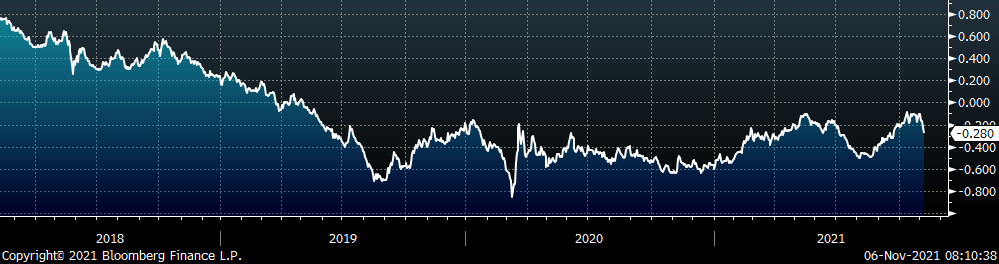
U.S. Total Manufacturing New Orders Ex-Transportation NSA YoY % Change
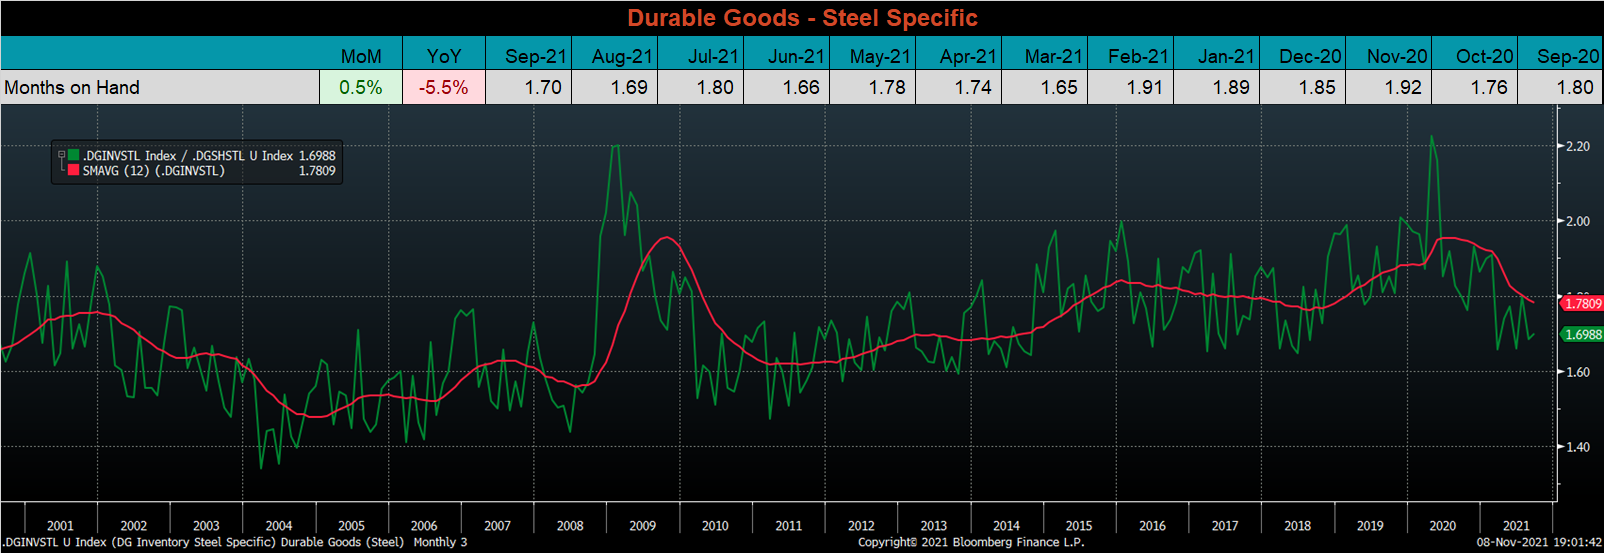
The chart looks at the months on hand (inventory divided by shipments) for durable goods categories that are steel intensive. MOH ticked slightly higher but remains depressed compared to the last 2 years. The 12-month moving average continues to decrease and is approaching the recent low found late in 2018. This is emblematic of the fact that most manufacturers have been buying to fulfill orders rather than to stock material.
Auto Sales
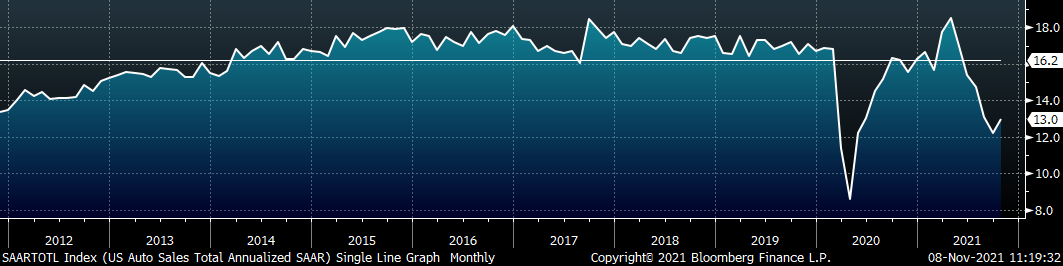
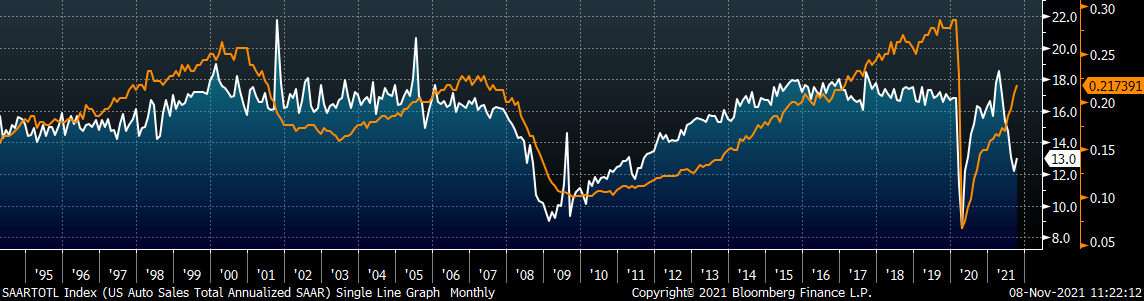
October U.S. light vehicle sales ended a 5-month slide and were slightly higher, at a 13m seasonally adjusted annualized rate (S.A.A.R). The second chart shows the relationship between the unemployment rate and auto sales. The unemployment rate is inverted to show that declining unemployment typically leads to increasing auto sales. The labor market recovery continued improved significantly in October, but the unemployment rate remains well above pre-pandemic levels.
October U.S. Auto Sales (S.A.A.R.)
September U.S. Auto Sales (orange) and the Inverted Unemployment Rate (white)
Risks
Below are the most pertinent upside and downside price risks:
Upside Risks:
- Inventory at end users and service centers below normal operational levels
- Higher share of discretionary income allocated to goods from steel intensive industries
- Changes in China’s policies regarding ferrous markets, including production cuts and exports
- Unplanned & extended planned outages, including operational issues leaving mills behind
- Energy & construction industry rebound
- Prolonged 2022 contract negotiations creating availability concerns in the short term
- Easing labor and supply chain constraints allowing increased manufacturing activity
- Mills extending outages/taking down capacity to keep prices elevated
- Global supply chains and logistics restraints causing regional shortages
Downside Risks:
- Increased domestic production capacity
- Increasing price differentials and hedging opportunities leading to sustained higher imports
- Steel consumers substitute to lower cost alternatives
- Steel buyers and consumers “double ordering” to more than cover steel needs
- Tightening credit markets, as elevated prices push total costs to credit caps
- Supply chain disruptions allowing producers to catch up on orders
- Limited desire to restock at elevated prices, causing a “Buyer’s Strike”
HRC Futures
All of the below data points are as of November 5, 2021.
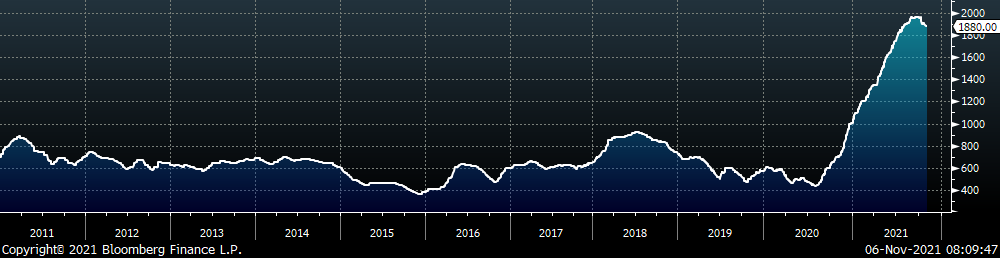
The Platts TSI Daily Midwest HRC Index decreased by $10 to $1,880.
Platts TSI Daily Midwest HRC Index
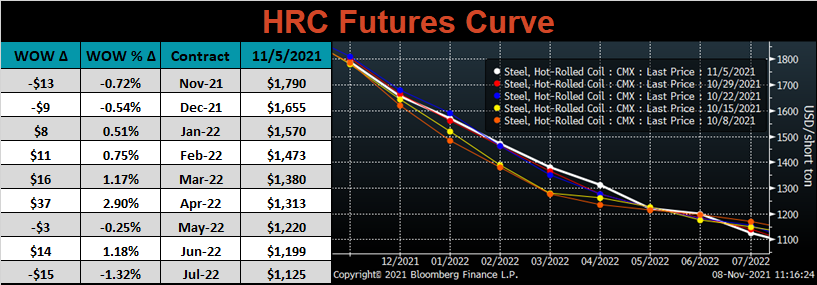
The CME Midwest HRC futures curve is below with last Friday’s settlements in white. Last week, the curve was mixed, with the April expiration up most significantly.
December ferrous futures were mostly lower, led by iron ore which lost another 10%, while shredded gained 14%.
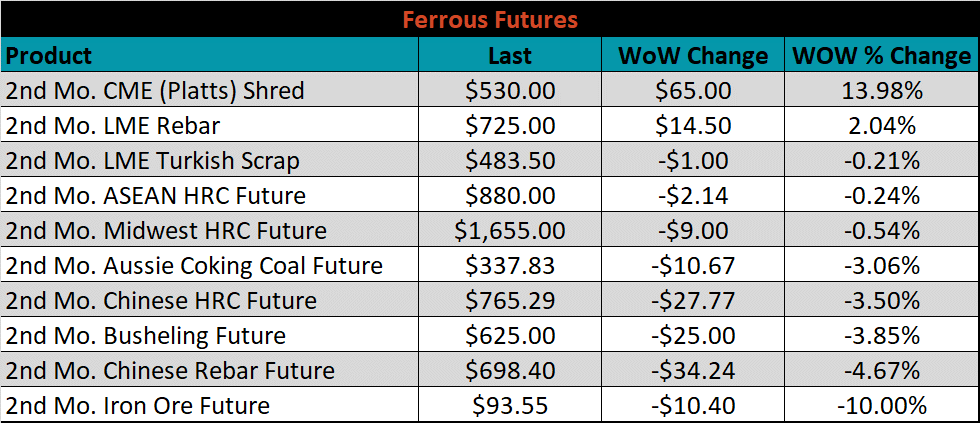
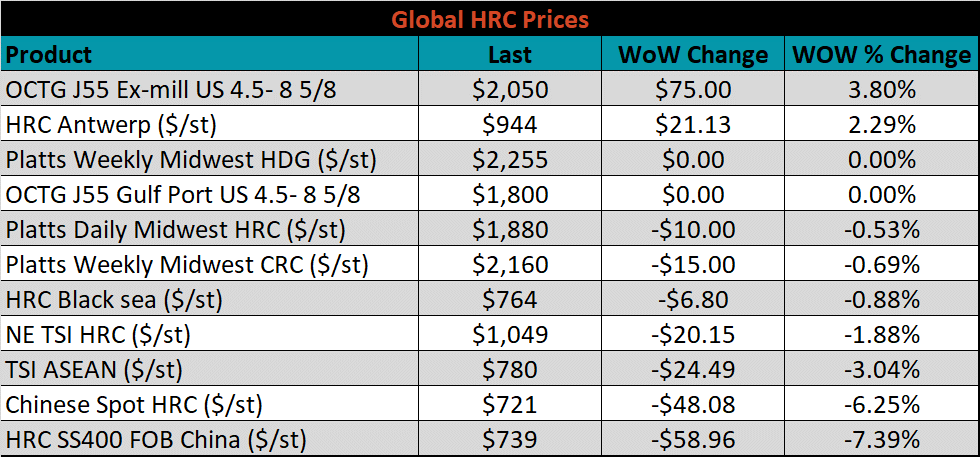
Global flat rolled indexes were also mostly lower, led by Chinese spot HRC, down another 7.4%, while Antwerp HRC was up 2.3%.
The AISI Capacity Utilization was down another 0.4% to 84.3%.
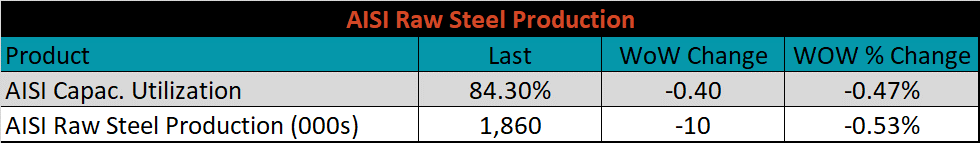
AISI Steel Capacity Utilization Rate (orange) and Platts TSI Daily Midwest HRC Index (white)
Imports & Differentials
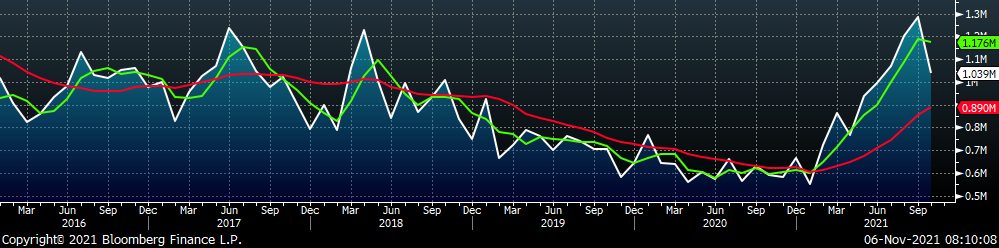
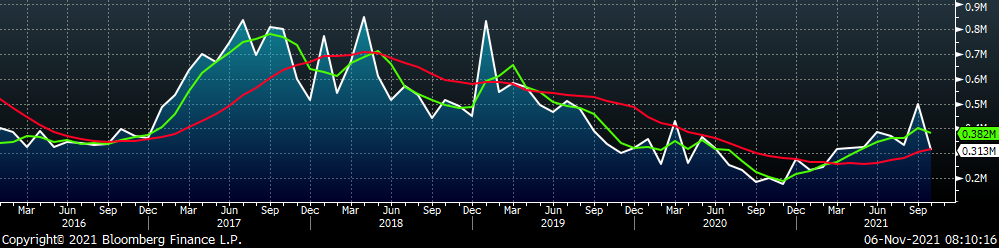
October flat rolled import license data is forecasting a decrease of 247k to 1,039k MoM.
All Sheet Imports (white) w/ 3-Mo. (green) & 12-Mo. Moving Average (red)
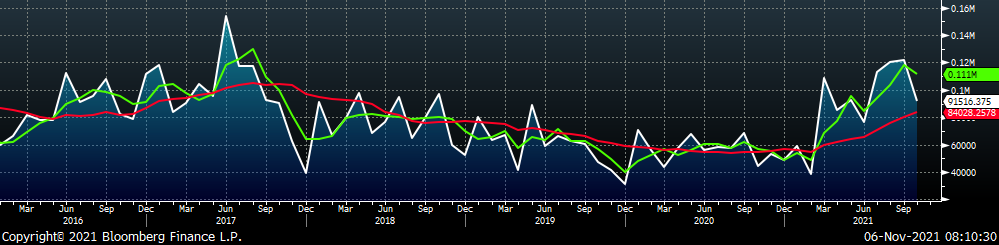
Tube imports license data is forecasting a decrease of 187k to 313k in October.
All Tube Imports (white) w/ 3-Mo. (green) & 12-Mo. Moving Average (red)
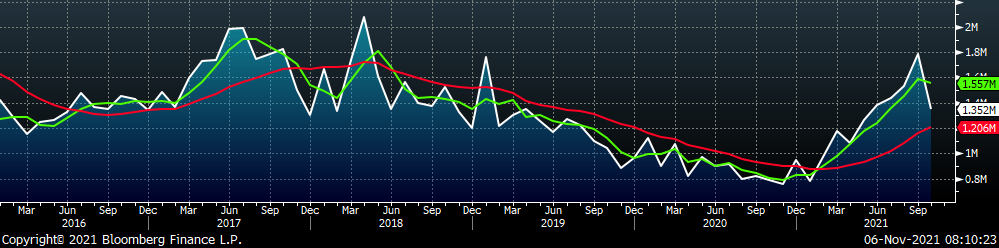
All Sheet plus Tube (white) w/ 3-Mo. (green) & 12-Mo. Moving Average (red)
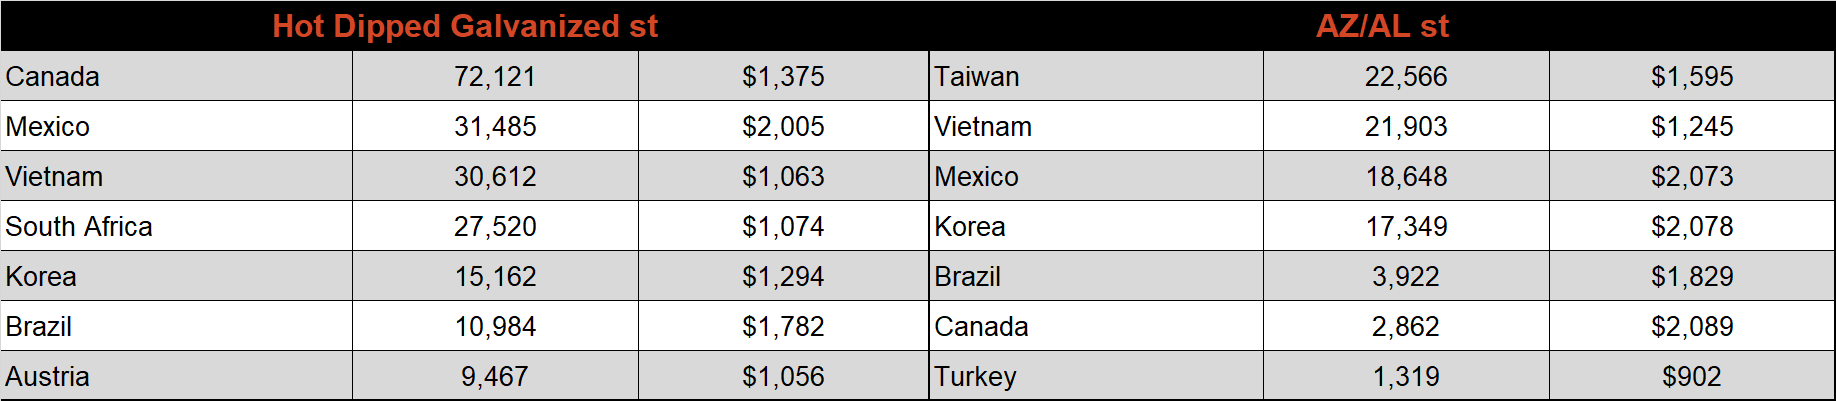
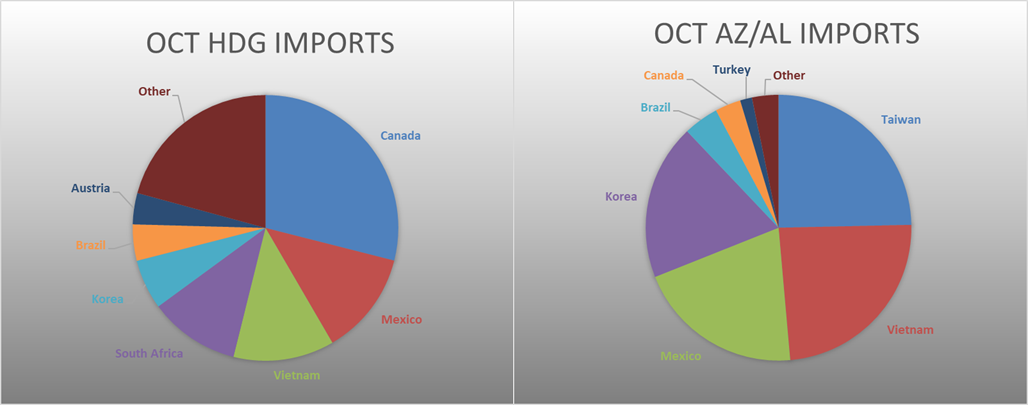
October AZ/AL import license data is forecasting a decrease of 90k to 92k.
Galvalume Imports (white) w/ 3 Mo. (green) & 12 Mo. Moving Average (red)
Below is October import license data through November 1st, 2021.
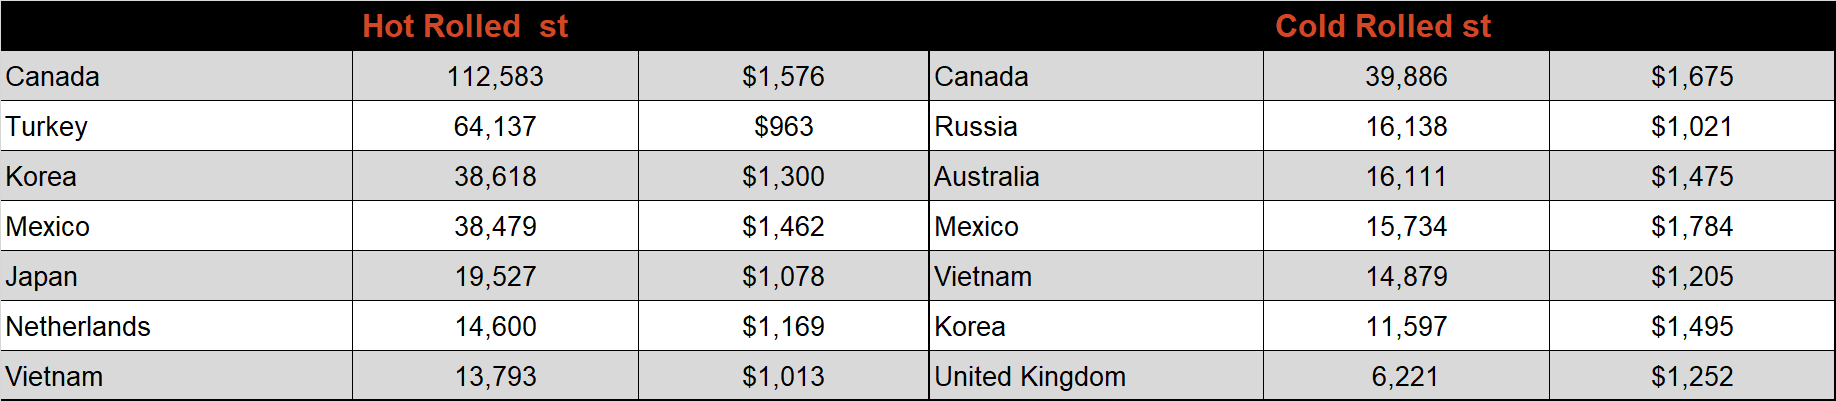
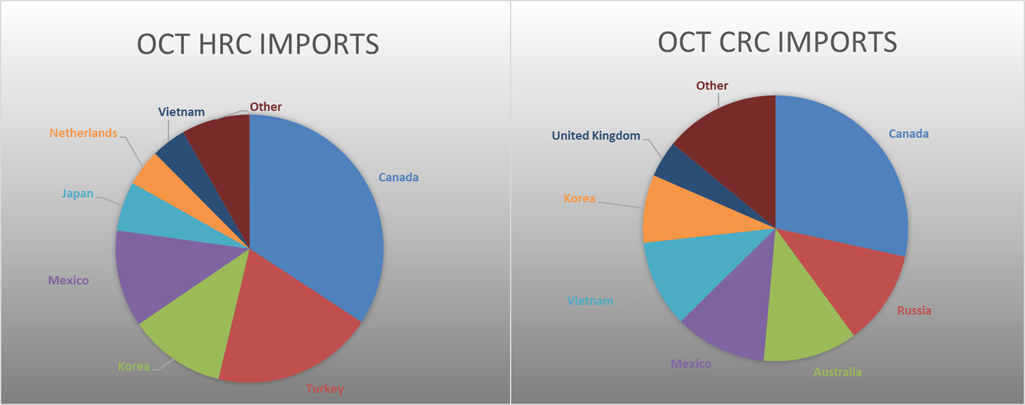
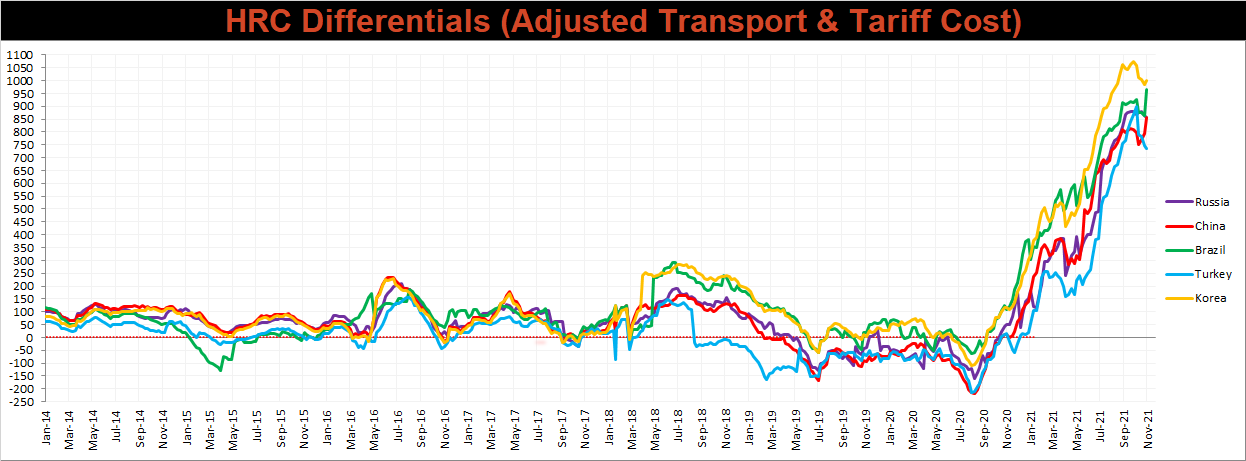
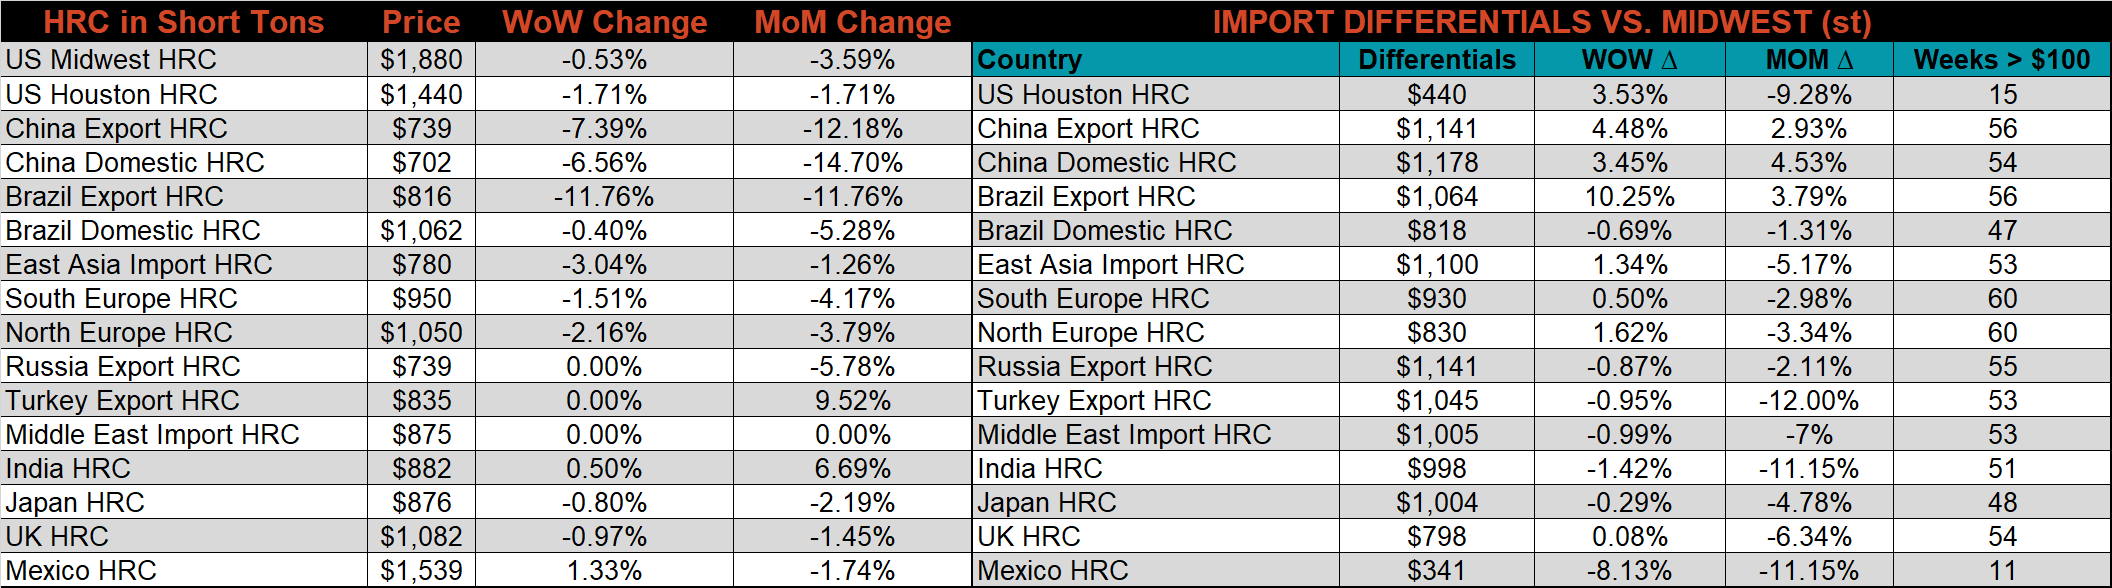
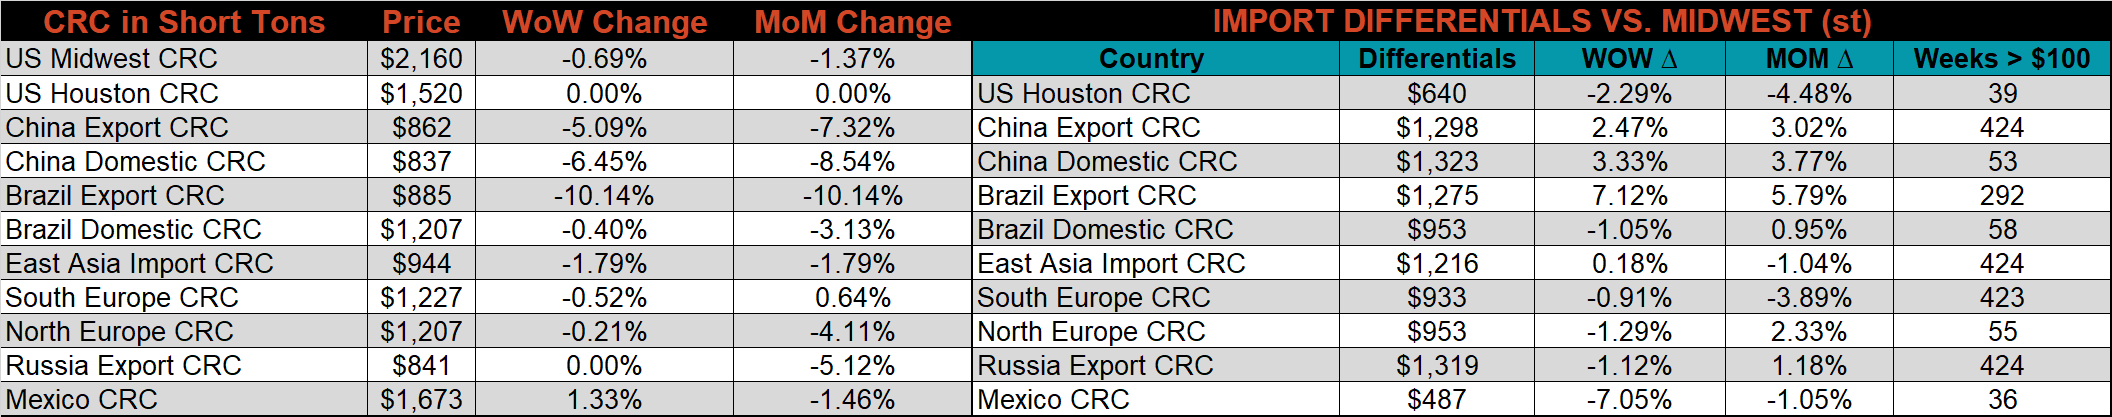
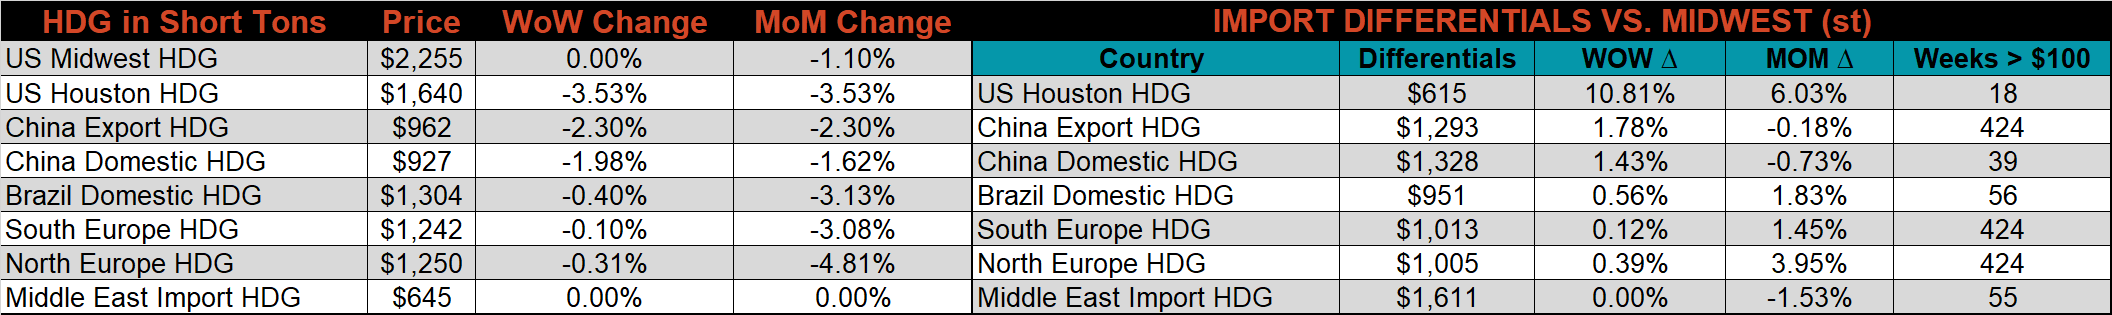
Below is the Midwest HRC price vs. each listed country’s export price using pricing from SBB Platts. We have adjusted each export price to include any tariff or transportation cost to get a comparable delivered price. The only differentials that moved lower this week were the Russian and Turkish because their prices did not update.
SBB Platt’s CRC, HDG and HRC pricing is below. The Midwest CRC & HRC prices were all lower this week, down 0.7% and 0.5%, respectively, while the HDG price was unchanged. Outside of the U.S., the Brazilian HRC export price was down 11.8%.
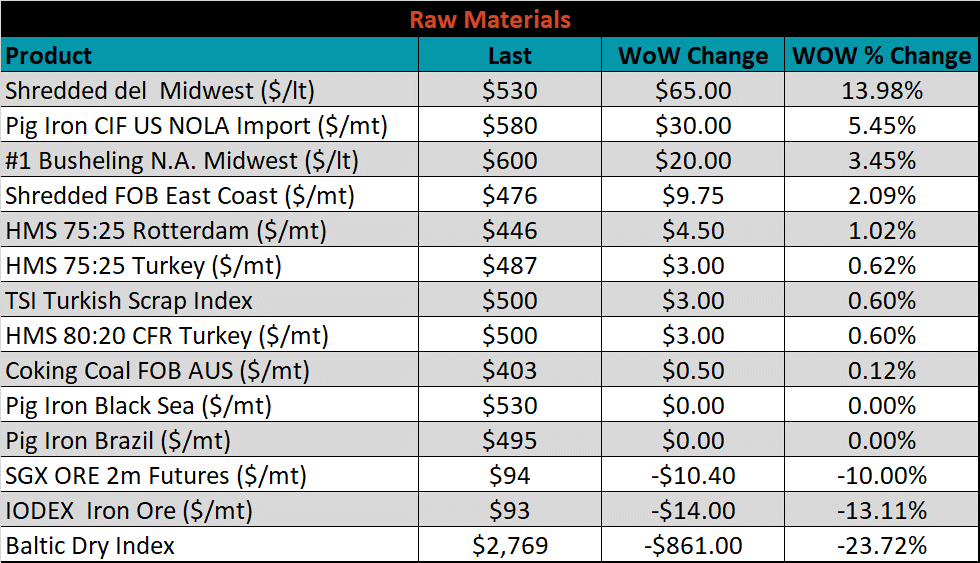
Raw Materials
Raw material prices were mixed. The November iron ore future and IODEX spot index were both down significantly, while Midwest shredded scrap was up 14%.
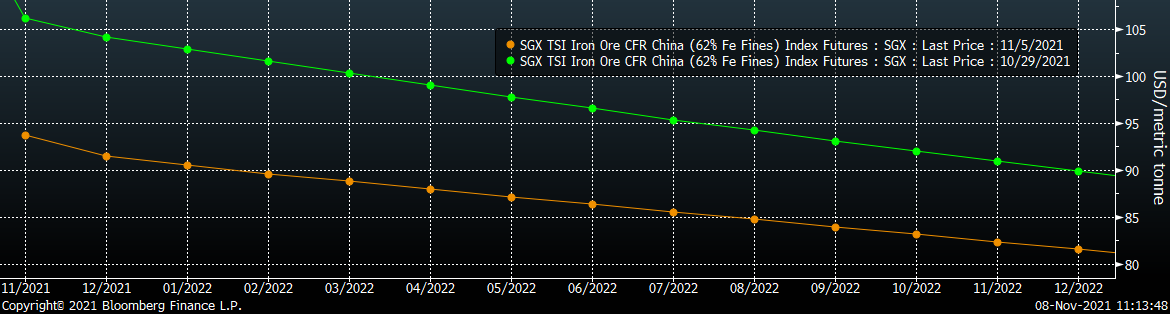
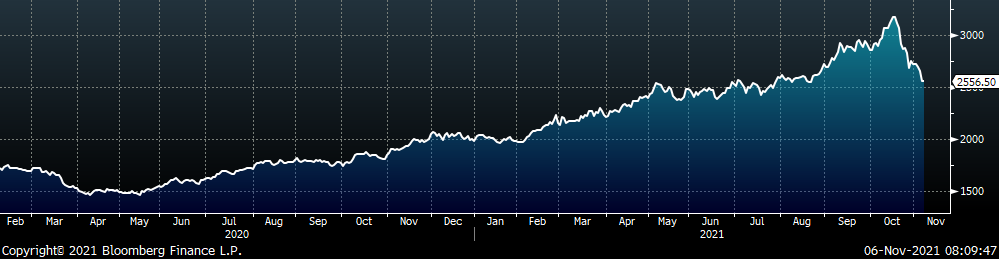
Below is the iron ore future curve with Friday’s settlements in orange, and the prior week’s settlements in green. Last week, the entire curve was shifted significantly lower at all expirations.
SGX Iron Ore Futures Curve
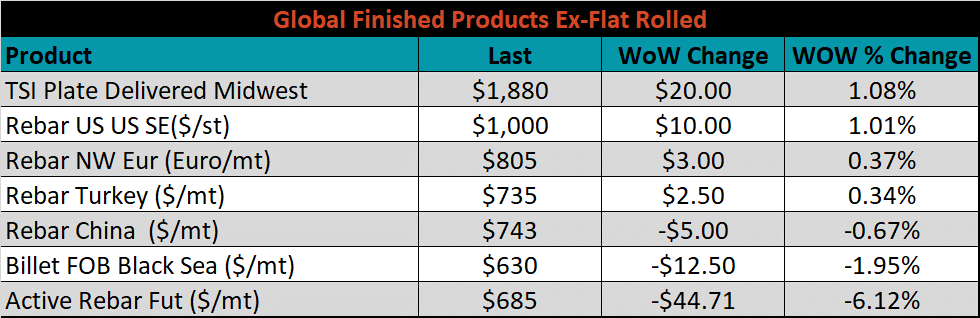
The ex-flat rolled prices are listed below.

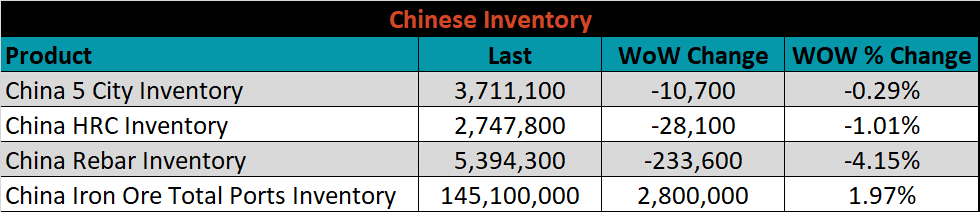
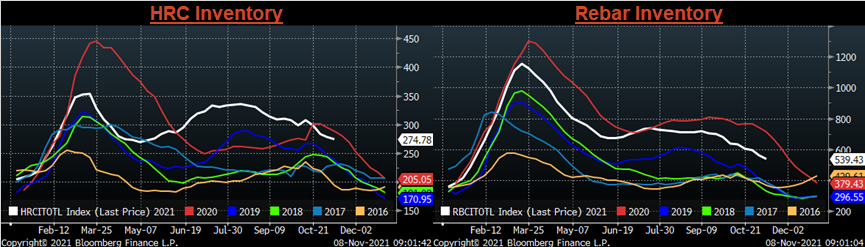
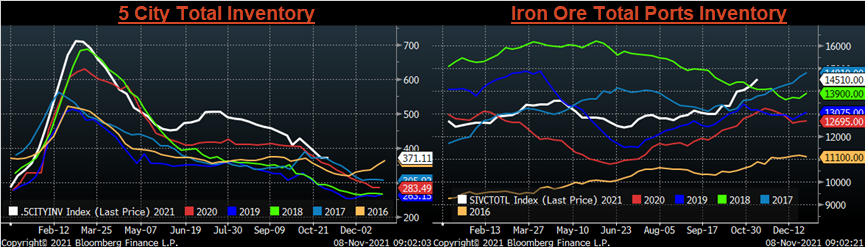
Chinese Inventory
Below are inventory levels for Chinese finished steel products and iron ore. The trend higher in iron ore inventory levels continued and is at its highest seasonal level in the last 5 years. The HRC, rebar and the 5-city inventory levels were lower, with rebar down most significantly.
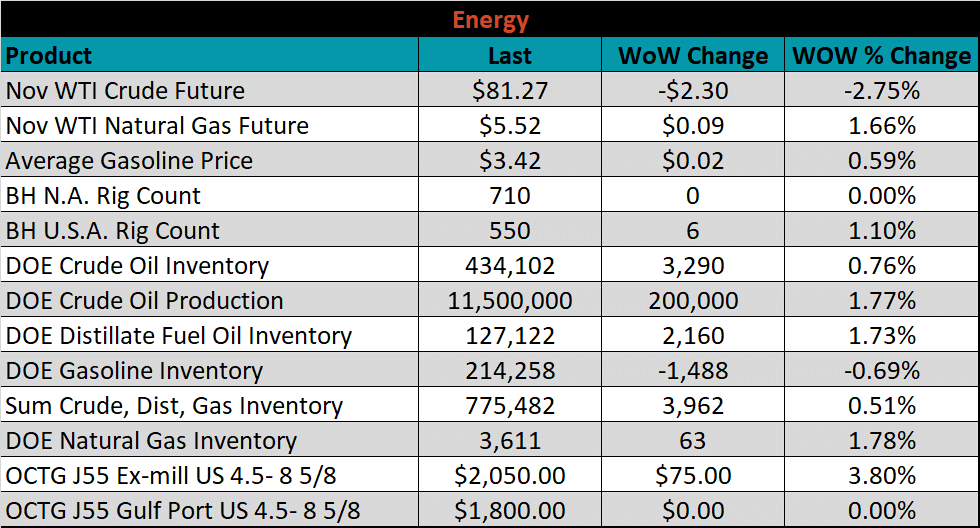
Energy
Last week, the November WTI crude oil future was down another $2.30 or 2.8% to $81.27/bbl. The aggregate inventory level was up 0.5%, and crude oil production increased to 11.5m bbl/day. The Baker Hughes North American rig count was unchanged, while the U.S. rig count was up 6 rigs.
November WTI Crude Oil Futures (orange) vs. Aggregate Energy Inventory (white)
Front Month WTI Crude Oil Future (orange) and Baker Hughes N.A. Rig Count (white)
The list below details some upside and downside risks relevant to the steel industry. The bolded ones are occurring or highly likely.
Upside Risks:
- Inventory at end users and service centers below normal operational levels
- Higher share of discretionary income allocated to goods from steel intensive industries
- Changes in China’s policies regarding ferrous markets, including production cuts and exports
- Unplanned & extended planned outages, including operational issues leaving mills behind
- Energy & construction industry rebound
- Prolonged 2022 contract negotiations creating availability concerns in the short term
- Easing labor and supply chain constraints allowing increased manufacturing activity
- Mills extending outages/taking down capacity to keep prices elevated
- Global supply chains and logistics restraints causing regional shortages
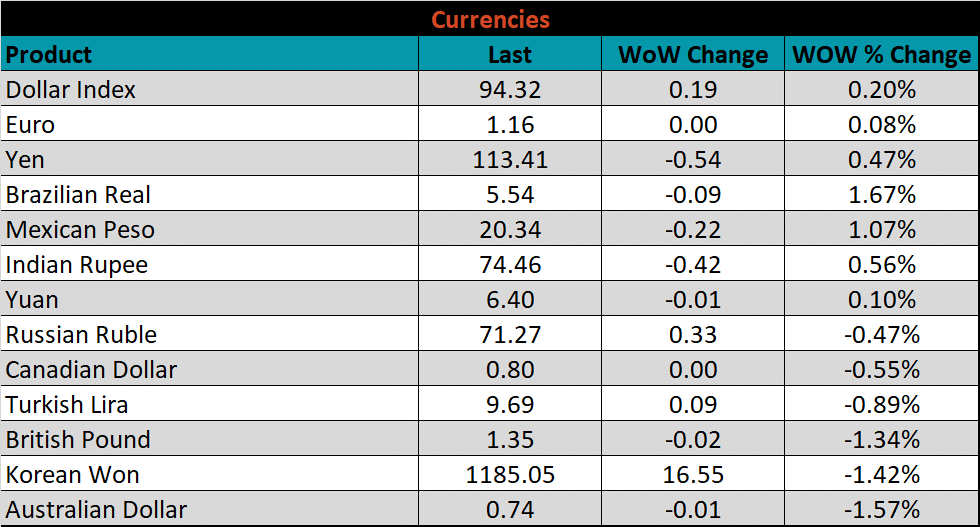
- A weakening US Dollar
- Fiscal policy measures including a new stimulus and/or infrastructure package
- Fluctuating auto production, pushing steel demand out into the future
- Low interest rates
- Threat of further protectionist trade policies muting imports
- Unexpected and sustained inflation
Downside Risks:
- Increased domestic production capacity
- Increasing price differentials and hedging opportunities leading to sustained higher imports
- Steel consumers substitute to lower cost alternatives
- Steel buyers and consumers “double ordering” to more than cover steel needs
- Tightening credit markets, as elevated prices push total costs to credit caps
- Supply chain disruptions allowing producers to catch up on orders
- Limited desire to restock at elevated prices, causing a “Buyer’s Strike”
- Reduction and/or removal of domestic trade barriers
- Political & geopolitical uncertainty
- Chinese restrictions in property market
- Unexpected sharp China RMB devaluation