Content
-
Weekly Highlights
- Market Commentary
- ISM PMI
- Global PMI
- Construction Spending
- Auto Sales
- Risks


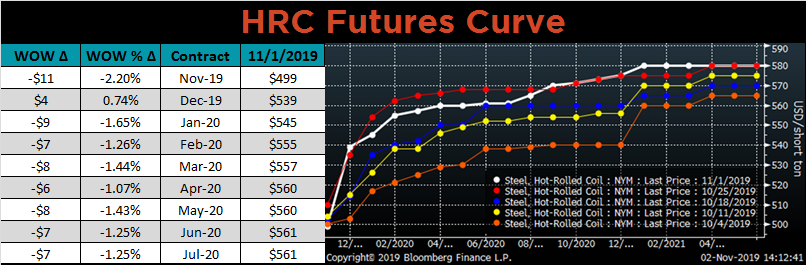
Last week we discussed the sustainability of the price increase announcement from two weeks ago, as well as the futures curve’s assumption that there are more increases to come. The current spot HRC price is slightly below $500/st, and the December future settled at $539. Looking into 2020, the curve starts the year near $545 and is above $555 for the remainder of the year. The curve is shown below.
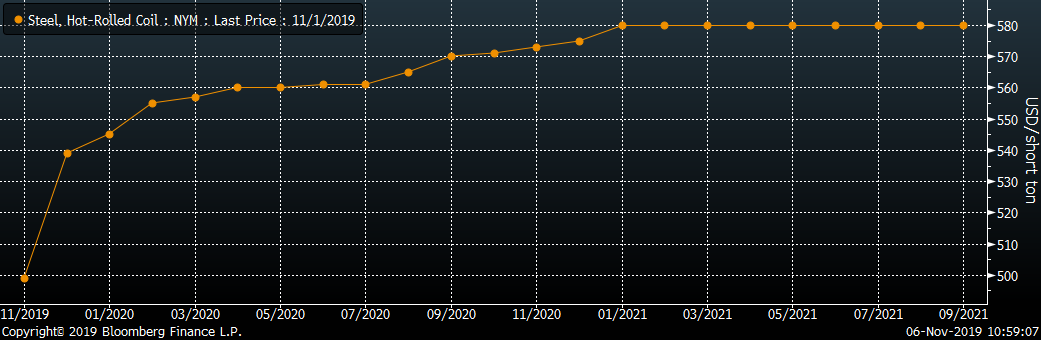
The curve, which displays the market’s expectations for future spot prices, is telling us that there will be a short-term squeeze in the domestic steel market, which will allow mills to push multiple increases. While the curve is rarely correct, it does give an indication of sentiment in the market. This positive outlook on the curve is supported by improving mill profitability, expected increases in scrap prices, increasing global steel prices and expanding lead times. But for these optimistic expectations to become reality, we will need to see tightness in the spot market soon driven by mills closing their December order books and turning away orders. This will allow them to push another price increase within the next few weeks, and possibly another one before year-end to open up their January order books well above $500. However, this scenario does assume demand will not decline into year-end, and import levels will remain low. With the upside scenario largely expected in the market, any tonnage needed this year or in the first quarter should be secured today in the spot market.
Moving into 2020, there are multiple scenarios that may present opportunities, specifically along the future curve, which should be identified and understood. For most of 2019, the curve has been in contango, meaning the spot price is lower than the future price. However, this is not always the case, and looking at the curve in 2020 above, prices are relatively flat. Below is a chart of the 6th month HRC future price minus the 3rd month future. The curve is in contango when the line is positive, flat at the zero line, and in backwardation when negative.
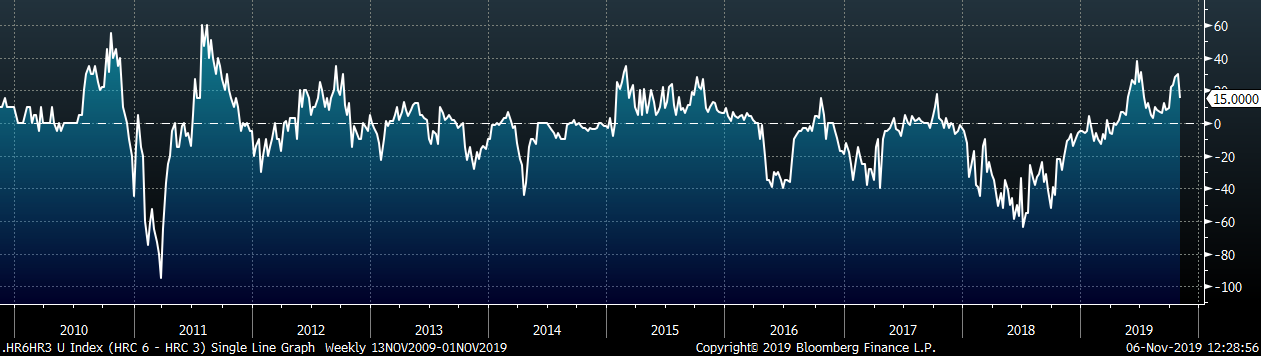
The recent recovery in HRC spot prices caused the curve to flatten from the large contango seen last month and in June. If the curve continues to flatten into 2020, it provides a great opportunity to lock in future tonnage at prices similar to the spot price. Moreover, if the curve moves into backwardation, steel buyers would be able to lock in future prices BELOW the spot price. Fixing prices in this manner not only reduces purchasers’ price volatility, but also allows for improved inventory management. Keep these in mind as we move closer to 2020.
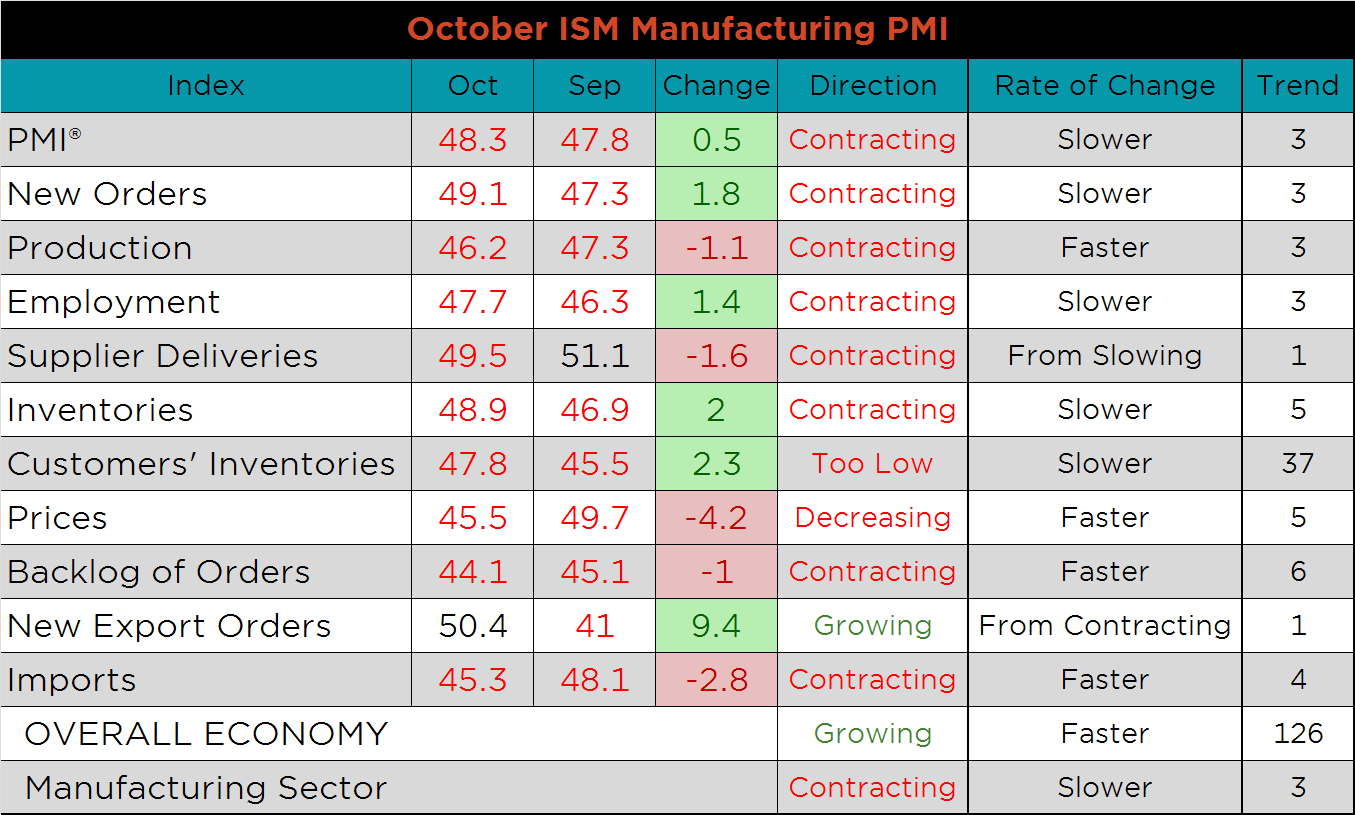
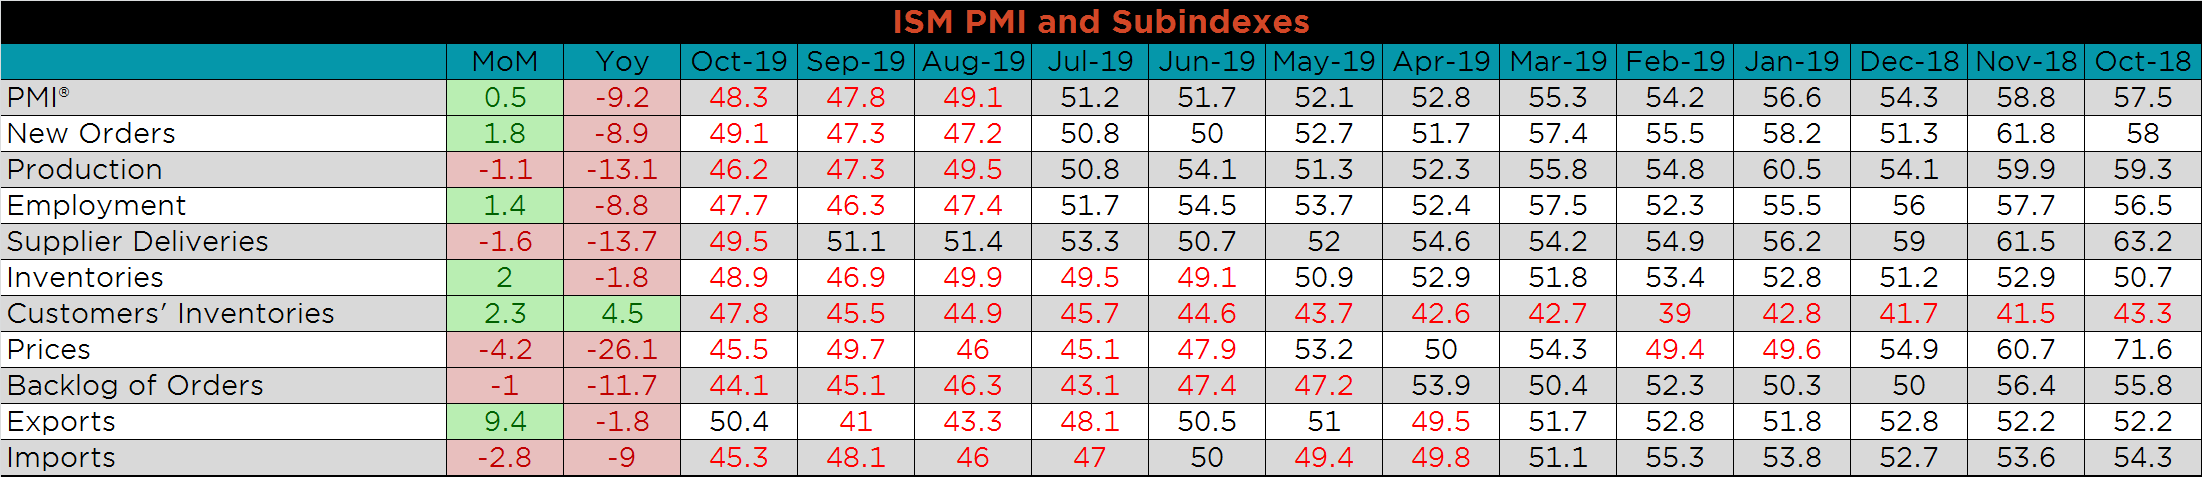
The October ISM Manufacturing PMI and subindexes are below. The topline PMI Manufacturing number rose off recent lows, but remains in contraction.
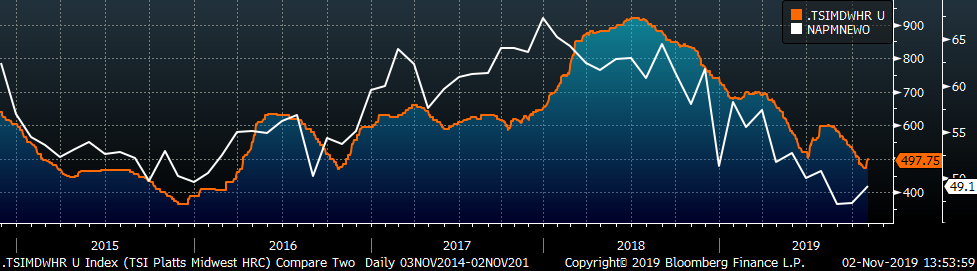
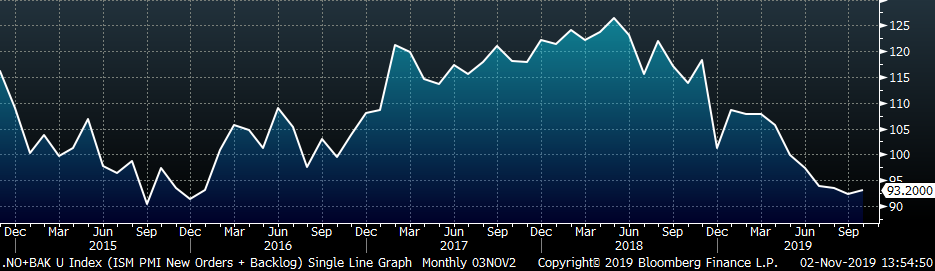
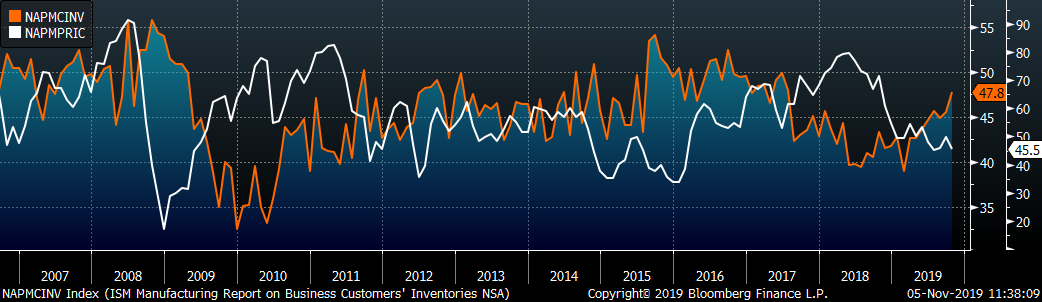
The chart below compares the ISM new orders subindex with the Platts TSI Daily Midwest HRC Index. Both have recently increased and show the potential for further strength in the short-term. The second chart adds the new orders and backlog subindexes together, which shows stabilizing manufacturing demand. Finally, the third chart shows the prices index and the customers’ inventory subindex. Lower prices seem to be encouraging some end users to restock.
The exports subindex rose dramatically, 9.4 points to 50.4, and is now the only subindex in expansion. This is encouraging for global manufacturing demand. New orders, employment, inventories and customer’s inventories were all higher than their September readings, but they remain in a contractionary territory. Prices, imports and supplier deliveries were down the most, 4.2, 2.8 and 1.6 points lower, respectively.
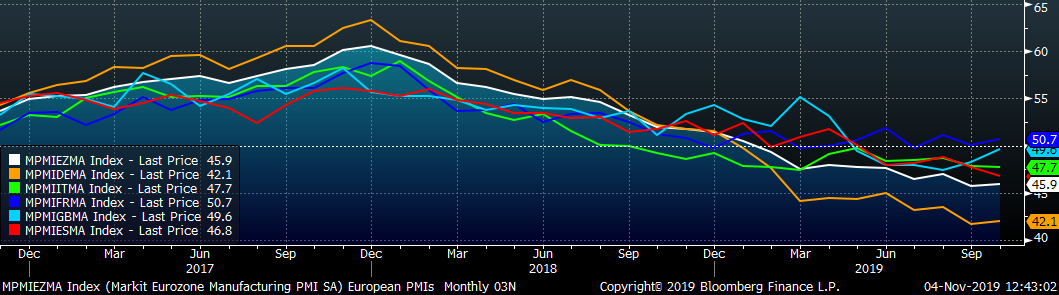
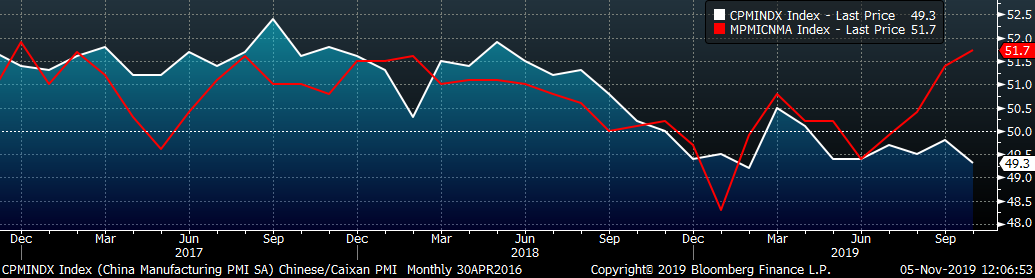
This month’s global PMI printings show continued weakness in many major manufacturing countries. Bright spots in the October printings include the Mexican PMI, which moved into expansion, and the Chinese Caixan PMI, which printed 0.3 points higher. The U.S., Eurozone and German PMI’s all printed higher but remain in contraction, while the Chinese Official PMI is below 50 and printed 0.5 points lower.
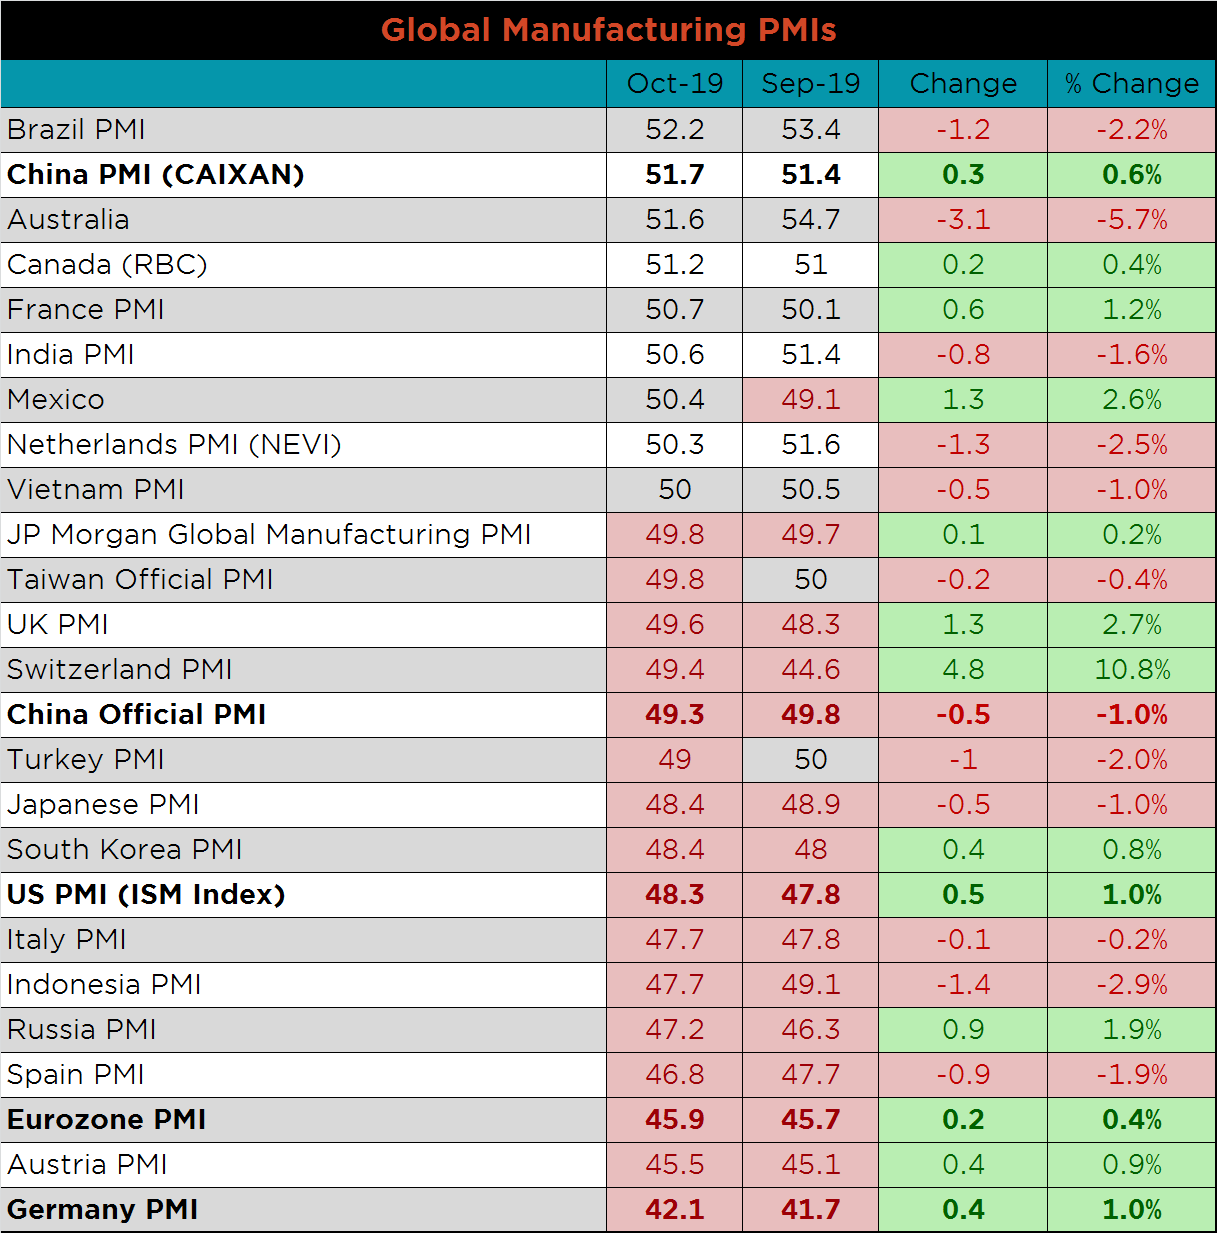
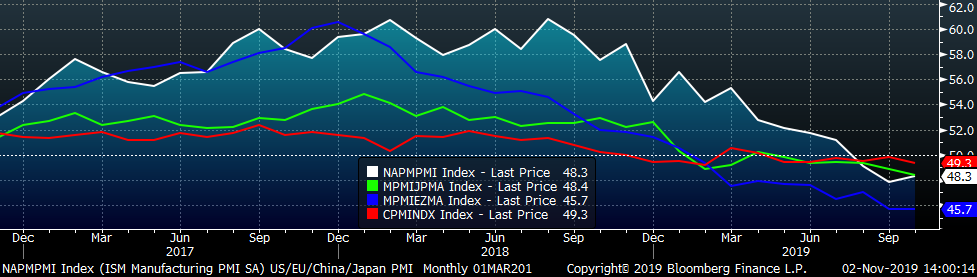
China’s official PMI printed down to 49.3, while the Caixan Manufacturing PMI continued to trend higher, printing up to 51.7. Interestingly, the Chinese central government releases the official PMI, while Markit, a London-based global data provider, releases the Caixan PMI.
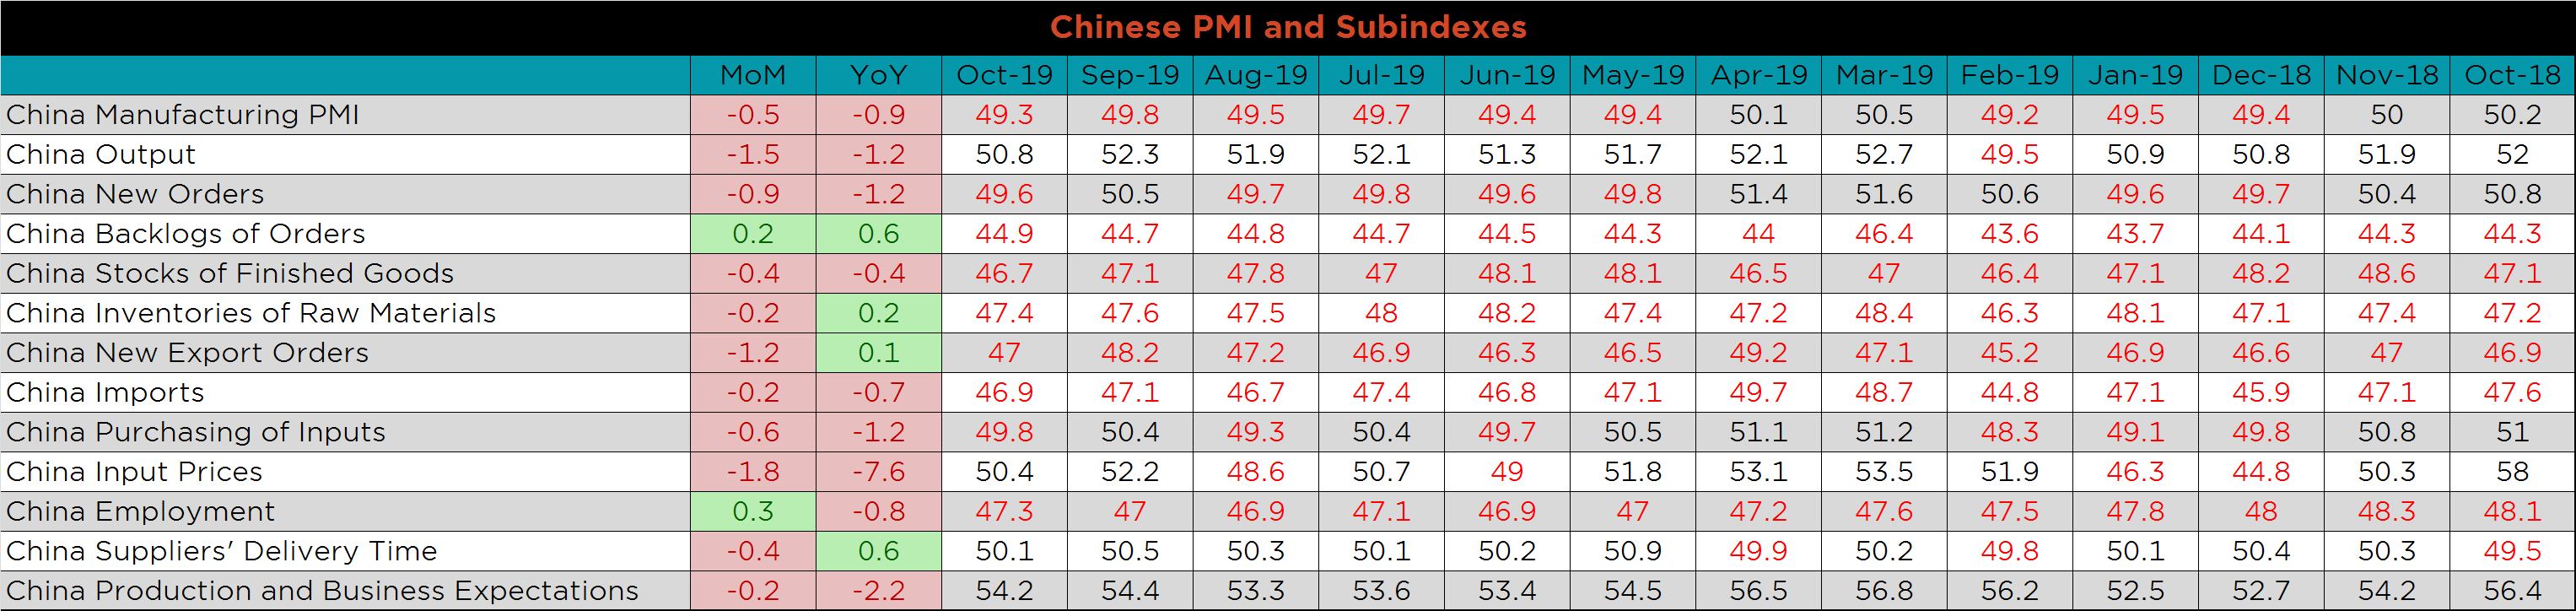
The table below breaks down China’s official manufacturing PMI subindexes. The lower reading was driven by declines in output, input prices and new orders (export and domestic). The backlog and employment subindexes both increased slightly MoM.
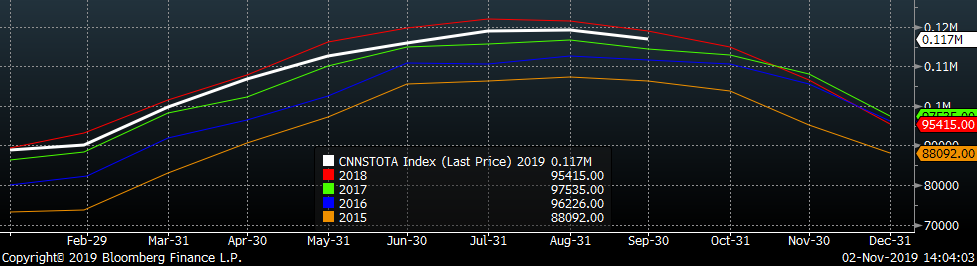
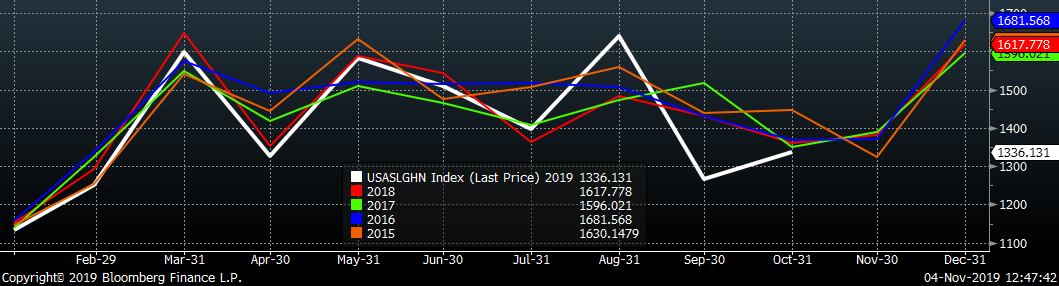
September’s seasonally adjusted U.S. construction spending was up slightly MoM, but down 2% YoY. Not seasonally adjusted spending was mostly lower, with the exception of private non-residential spending. Year-to-date, total non-residential spending remains above the similar period level in 2018.
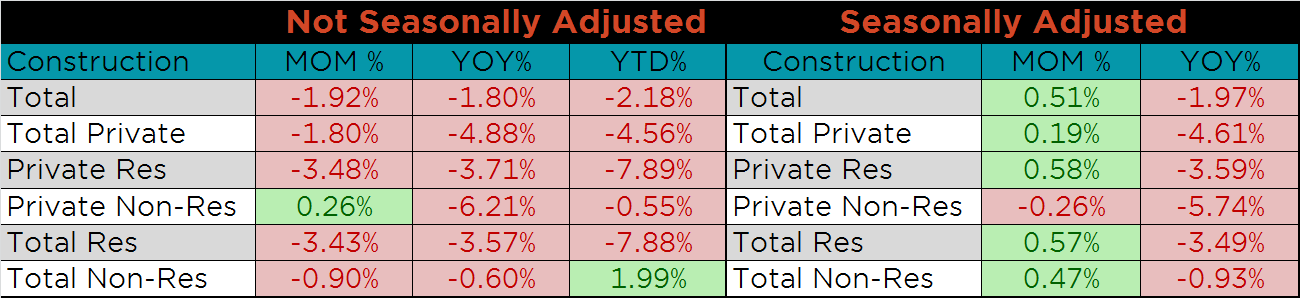
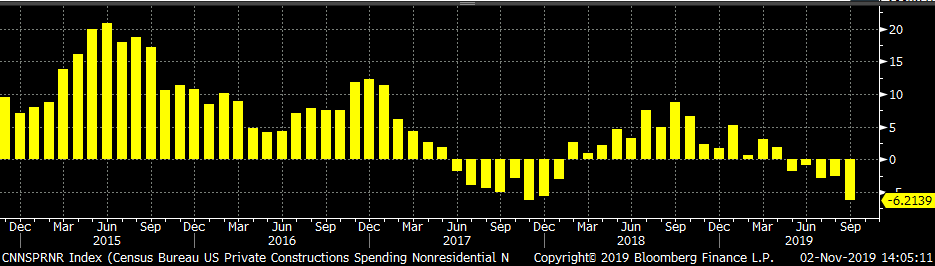
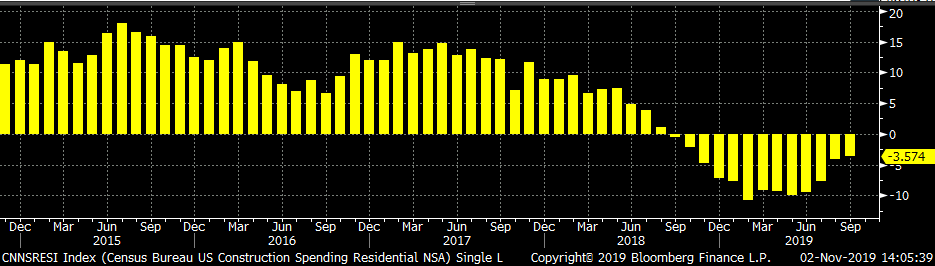
The white line in the chart below represents construction spending in each month of 2019 and compares it to the spending of the previous 4 years. While spending levels remain below last years’, 2019 levels continue to track as the second highest of the last 5 years. The last two charts show the YoY changes in construction spending. Private non-residential spending remains weak, while residential spending is improving, likely due to the decline in rates.
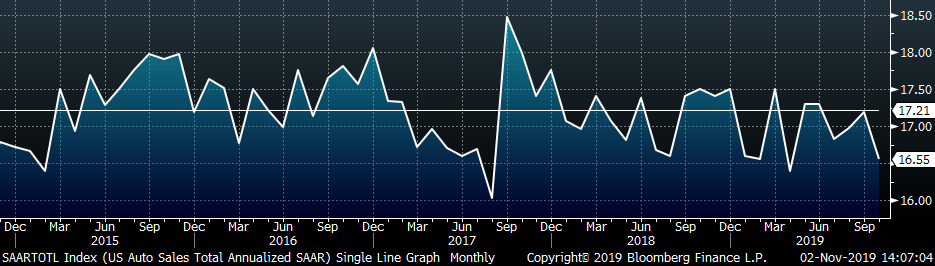
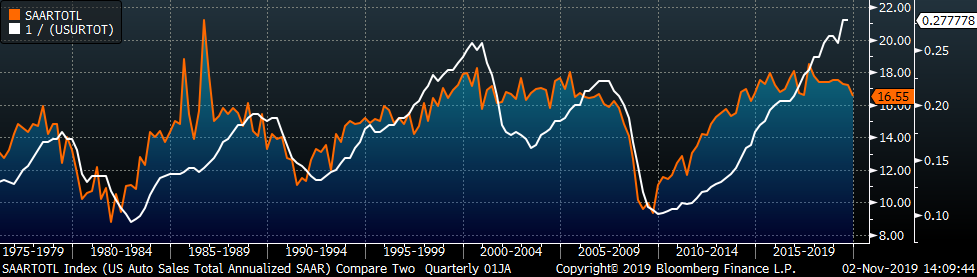
October U.S. light vehicle sales decreased to a 16.55m seasonally adjusted annualized rate (S.A.A.R). The white line in the second chart below compares monthly light auto sales with previous years’ levels. For the second month in a row, auto sales remain below the levels of the previous 4 years. On the third chart, we look at the relationship between the unemployment rate and auto sales. The unemployment rate is inverted to show that declining unemployment typically leads to increasing auto sales. Annualized auto sales appear to have peaked for the cycle, while the employment continues to improve.
Below are the most pertinent upside and downside price risks:
Upside Risks:
Downside Risks:
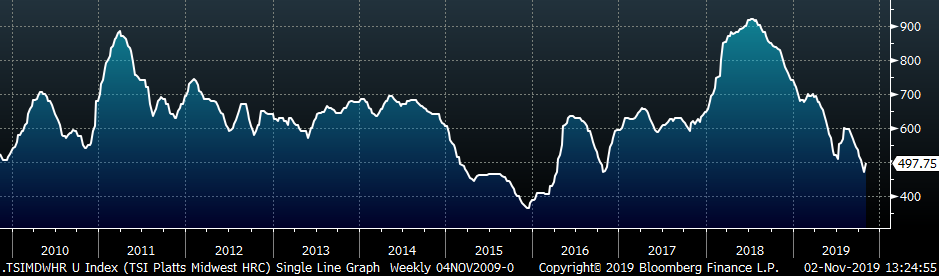
The Platts TSI Daily Midwest HRC Index was up $26.75 to $497.75.
The CME Midwest HRC futures curve is below with last Friday’s settlements in white. The curve moved slightly lower across the board.
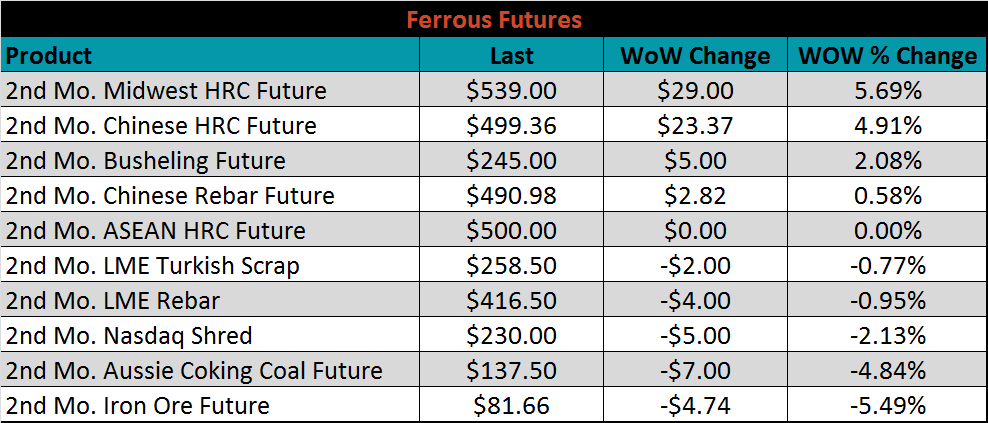
December ferrous futures were mixed. The iron ore future lost 5.5%, while the Midwest HRC future gained 5.7%.
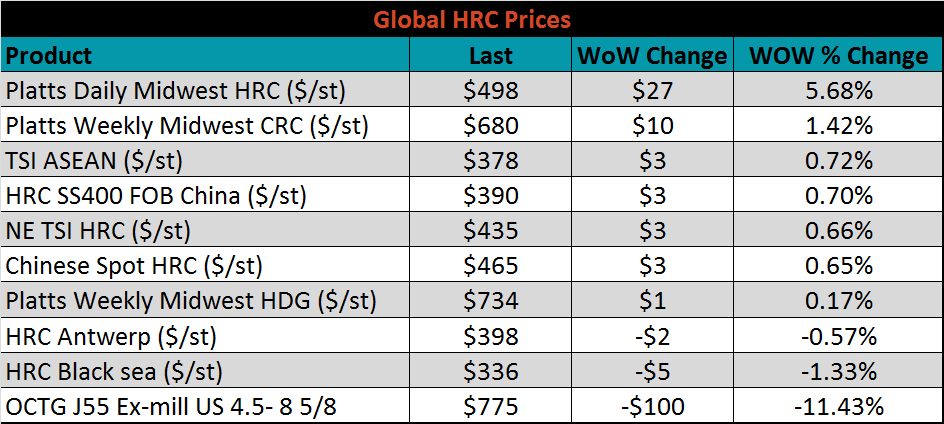
The global flat rolled indexes were mostly lower. Chinese spot HRC was up slightly, while Midwest TSI HDG was down 3.3%.
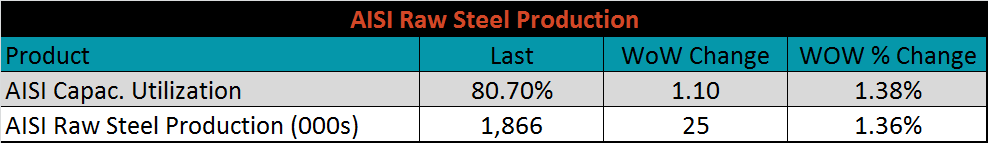
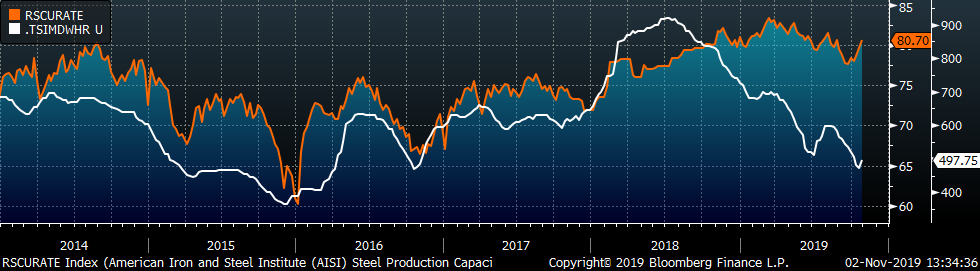
The AISI Capacity Utilization Rate was up another 1.1% to 80.7%. Production has been climbing recently and the utilization rate finally rose above the 80% goal set by the Trump administration for the first time since the end of August.
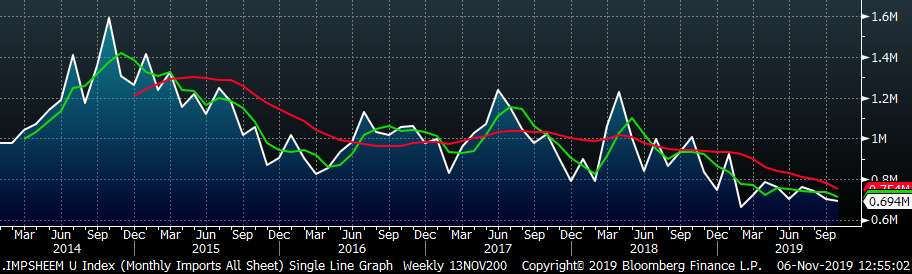
October flat rolled import license data is forecasting a decrease of 11k to 693k MoM.
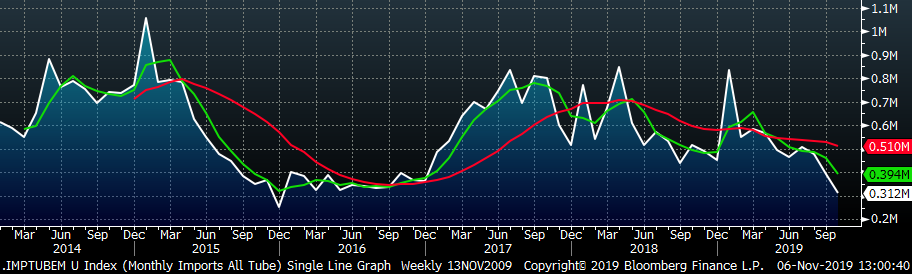
Tube imports license data is forecasting a MoM decrease of 78k to 312k tons in October.
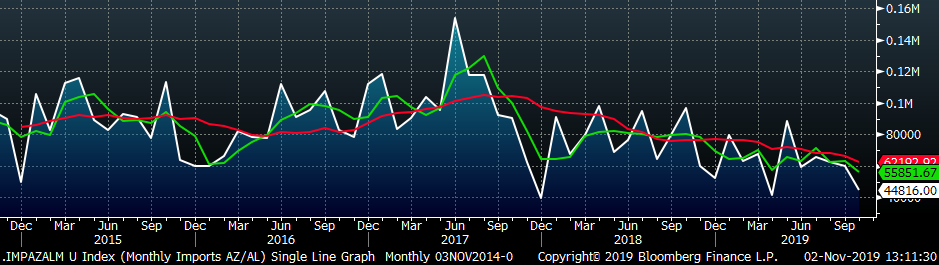
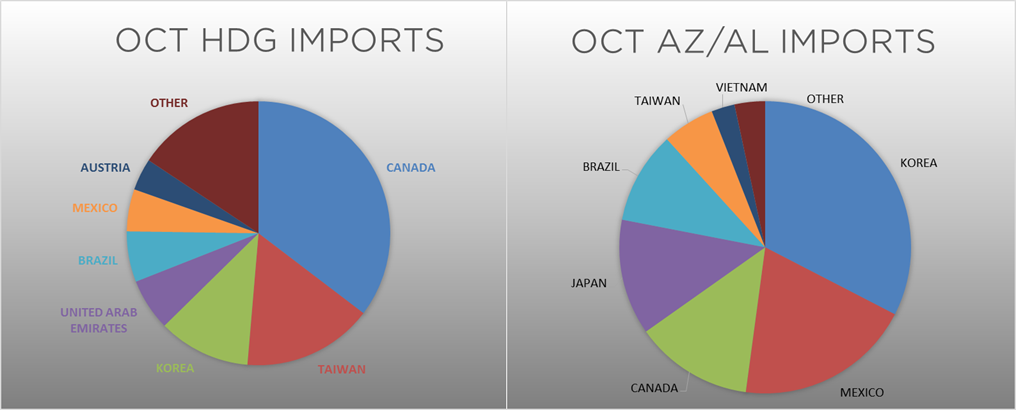
AZ/AL import license data is forecasting a decrease of 15k in October to 45k.
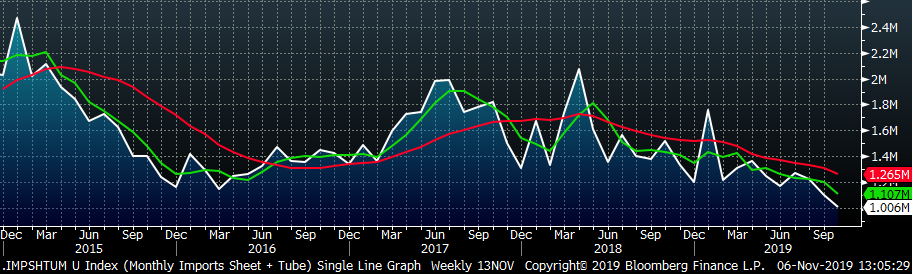
Below is October import license data through October 29, 2019.
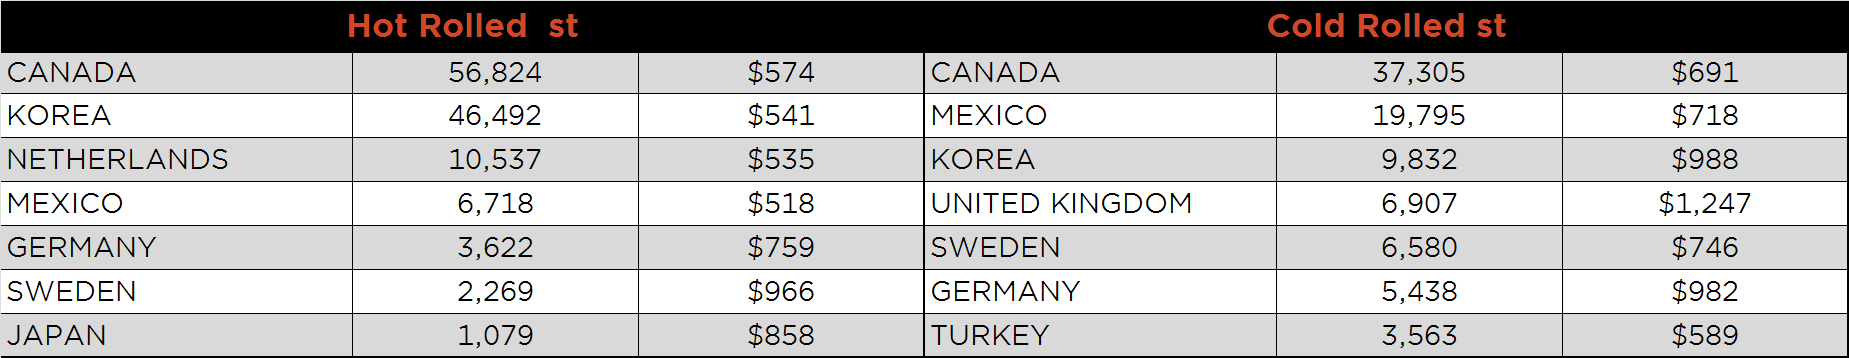
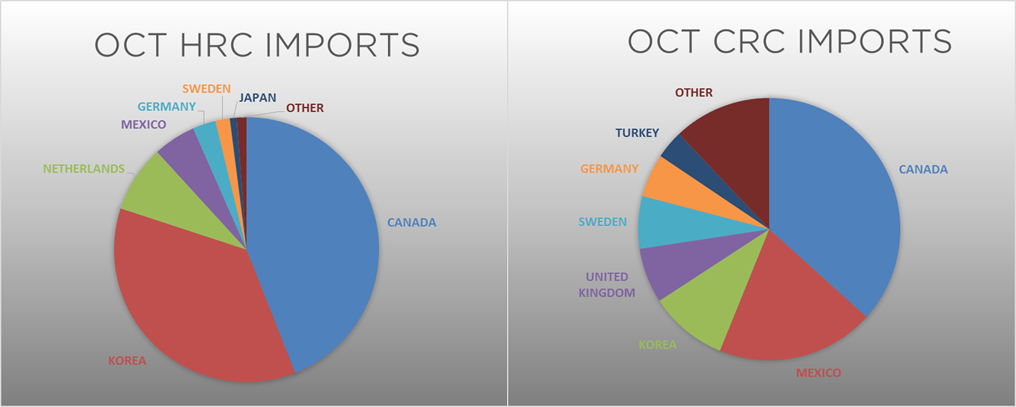
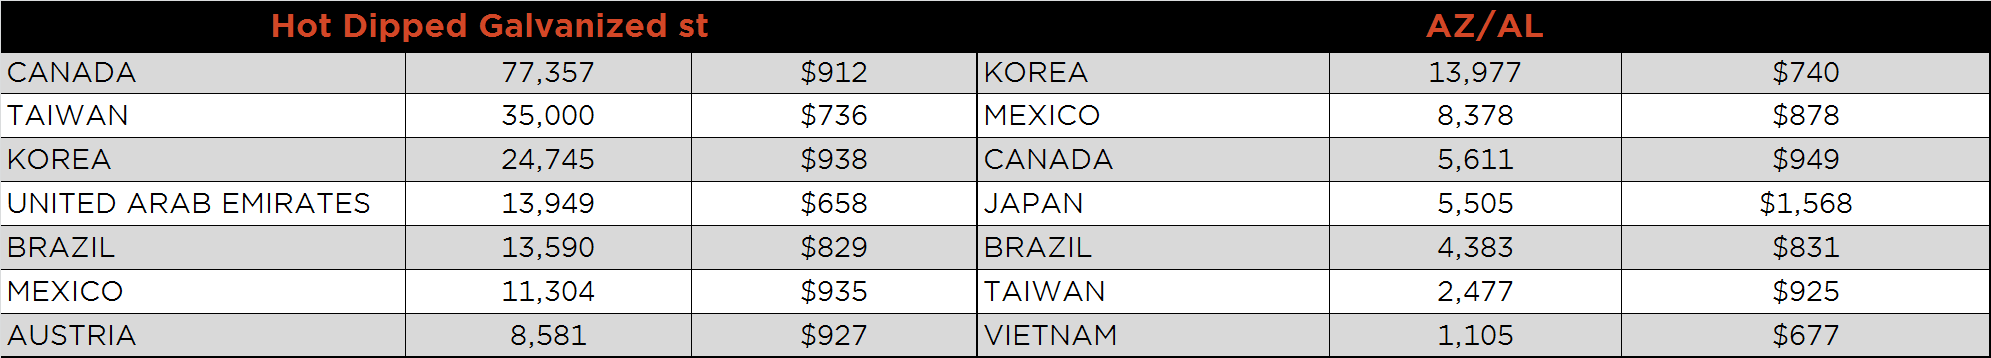
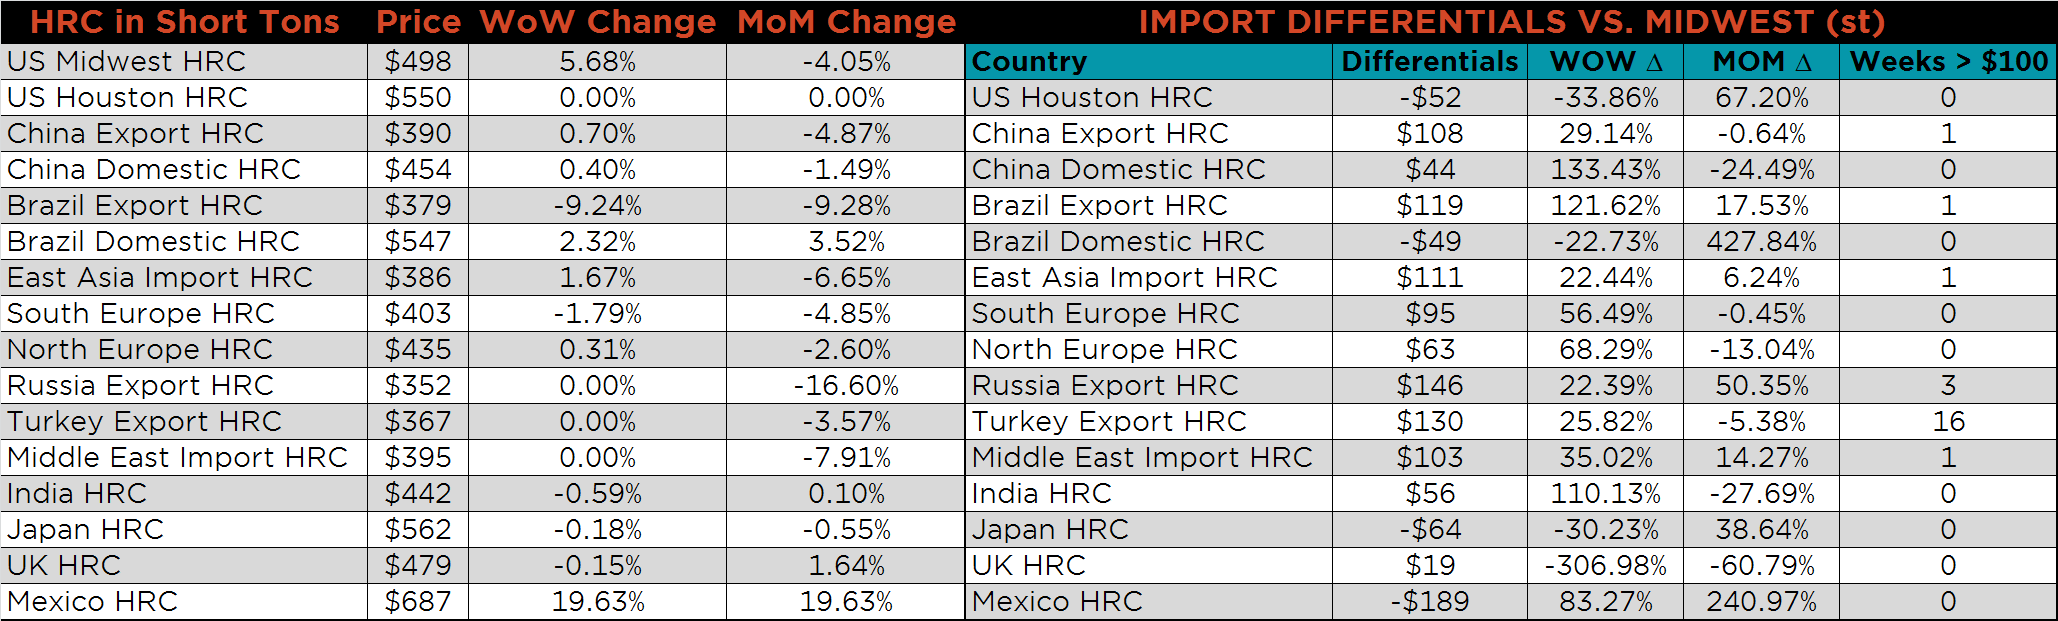
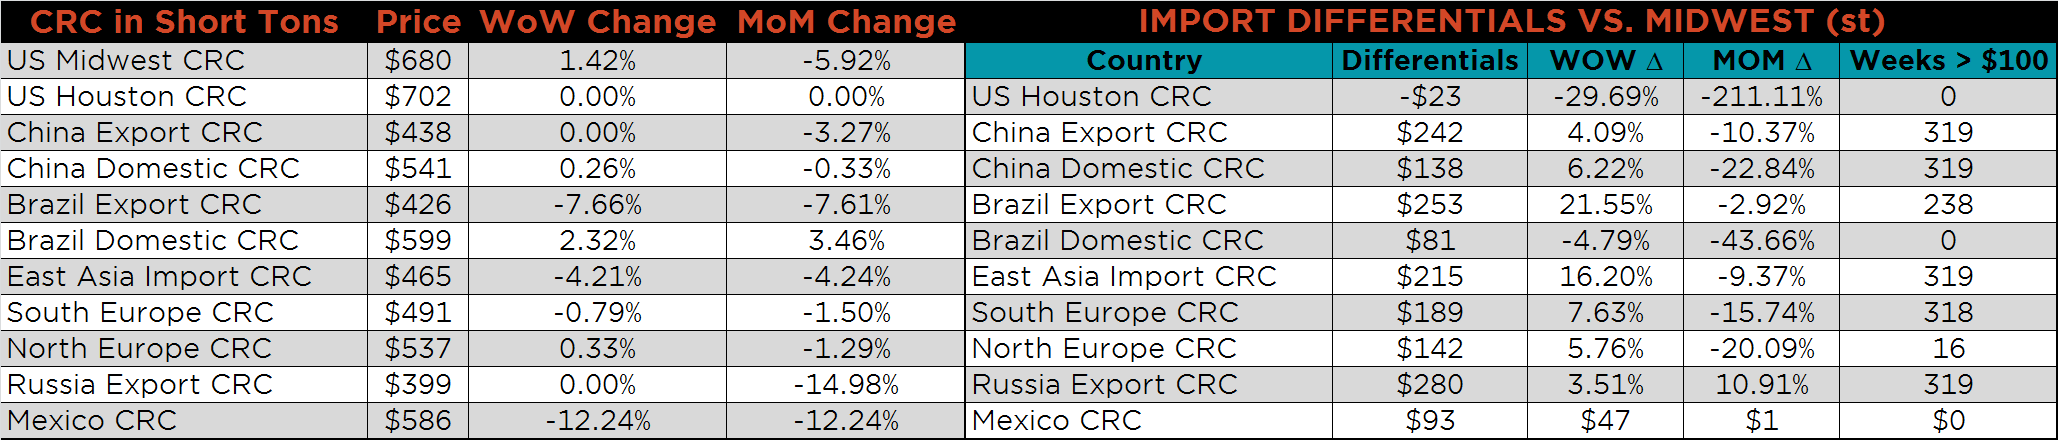
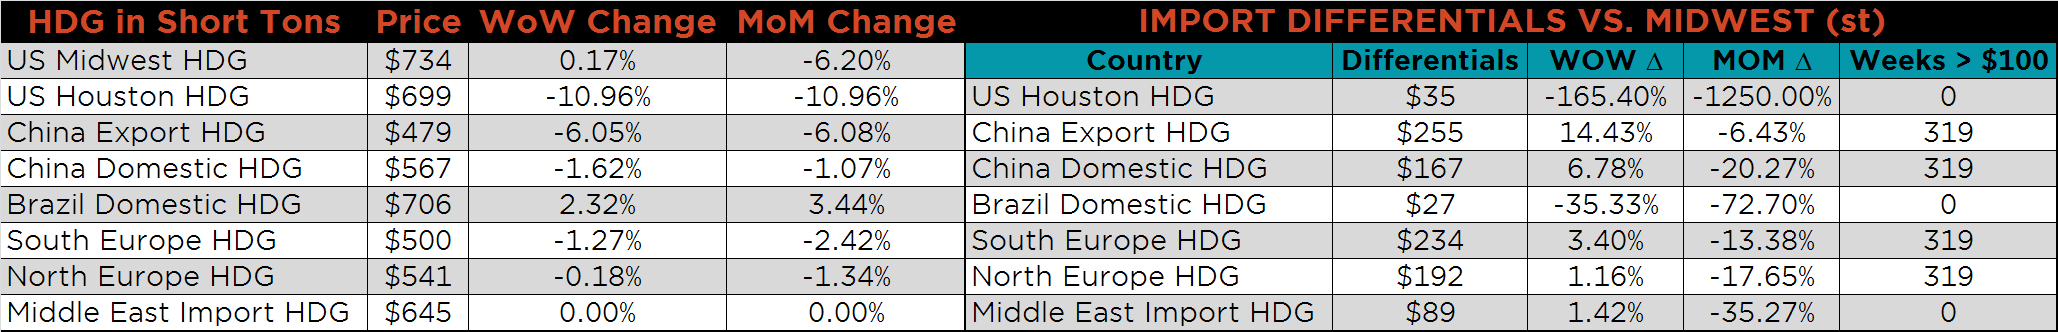
Below is the Midwest HRC price vs. each listed country’s export price using pricing from SBB Platts. We have adjusted each export price to include any tariff or transportation cost to get a comparable delivered price. The dramatic increase in the Midwest HRC price pushed global differentials higher as recent global steel prices have remained steady.
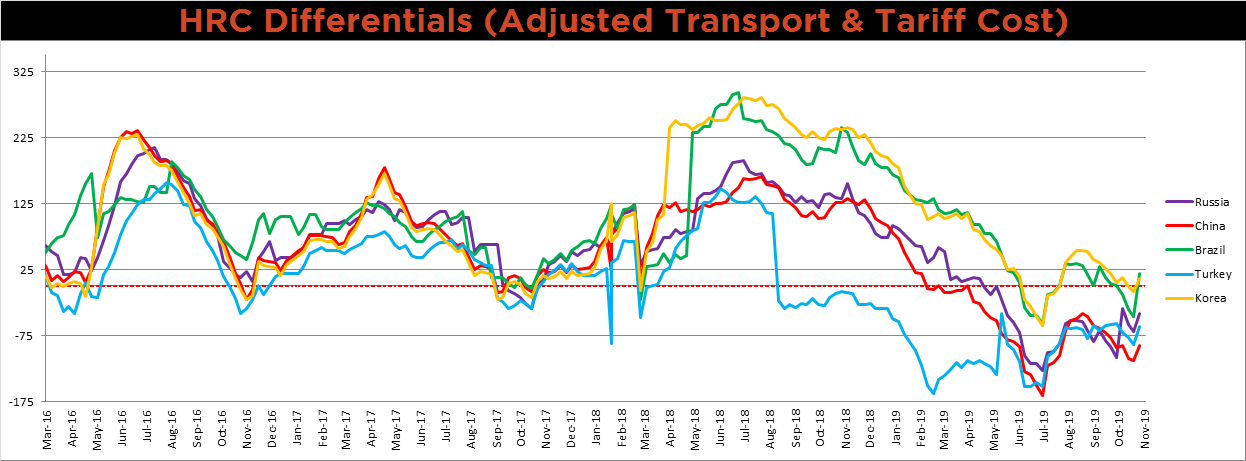
SBB Platt’s HRC, CRC and HDG pricing is below. The Midwest HRC, CRC and HDG prices were up 5.7%, 1.4% and 0.2%, respectively, while Brazilian HRC, CRC and Chinese HDG export prices were down 9.2%, 7.7% and 6.1%, respectively.
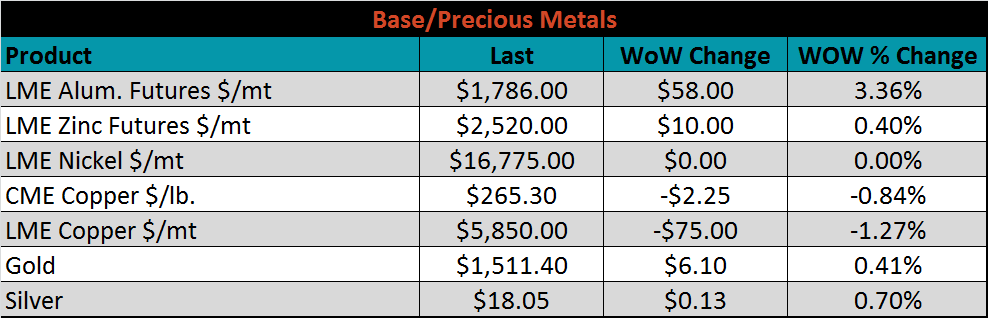
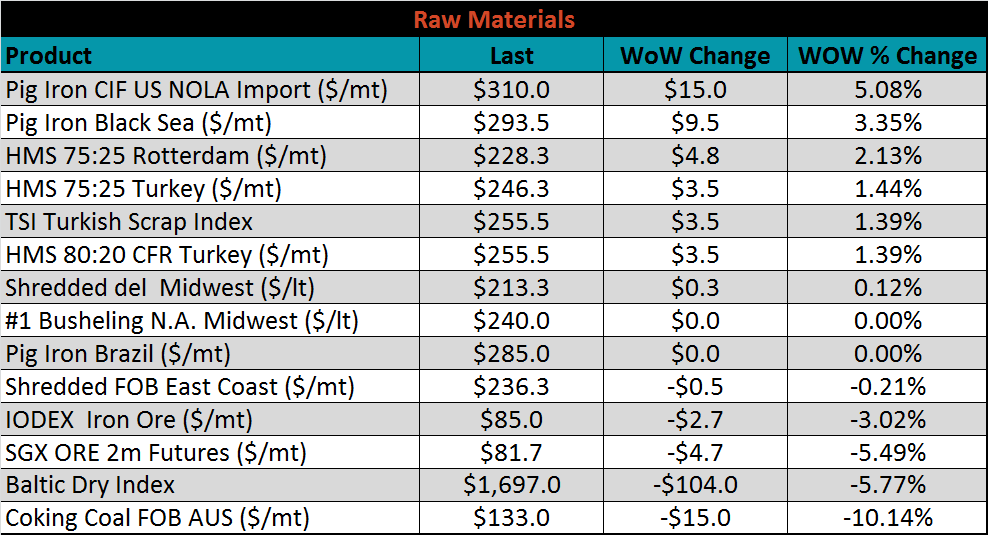
Raw material prices were mixed. Pig iron delivered to New Orleans was up 5.1%, while coking coal FOB Australia was down another 10.1%.
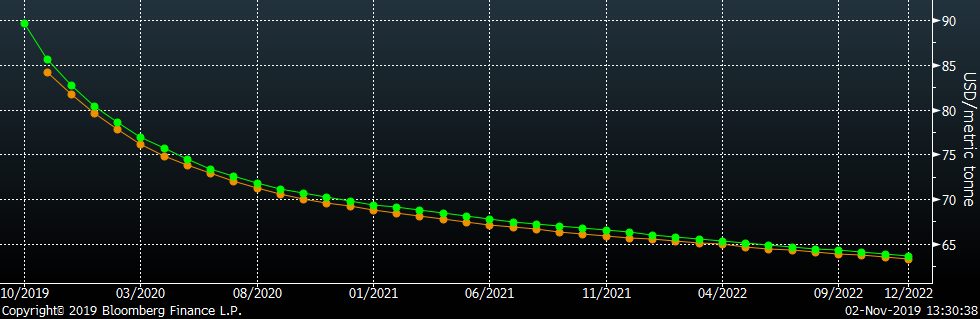
Below is the iron ore future curve with Friday’s settlments in orange, and the prior week’s settlements in green. The curve shifted slightly lower across all expirations.
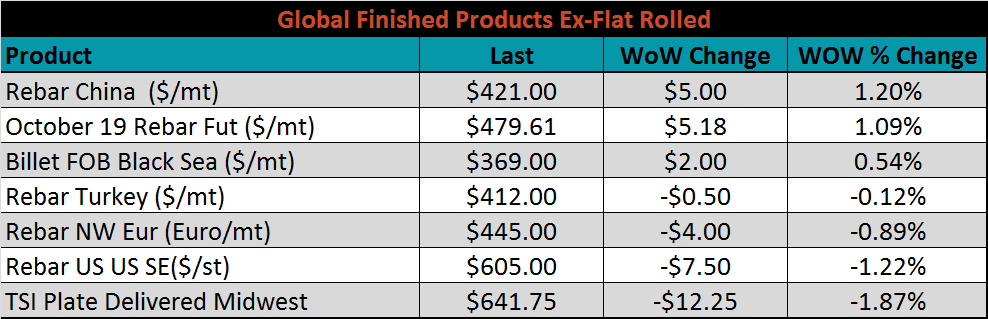
The ex-flat rolled prices are listed below.

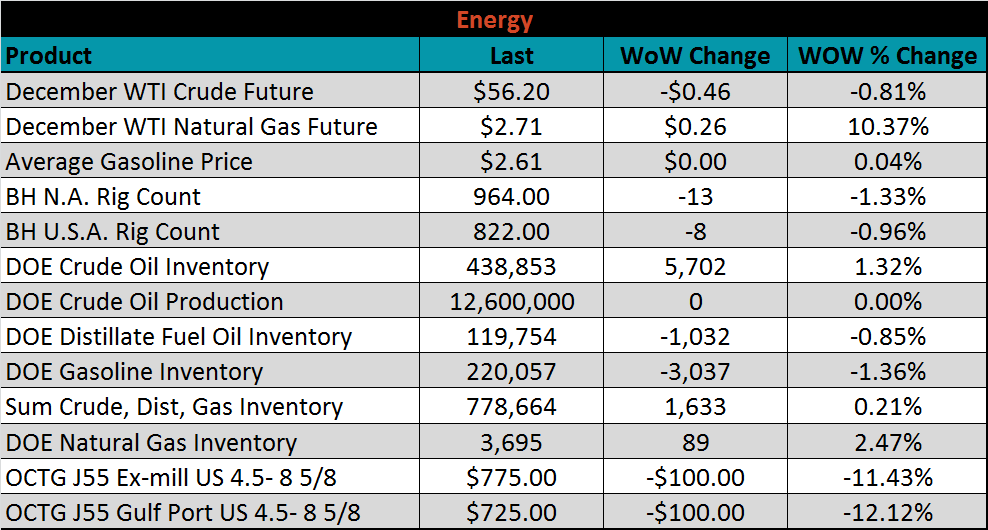
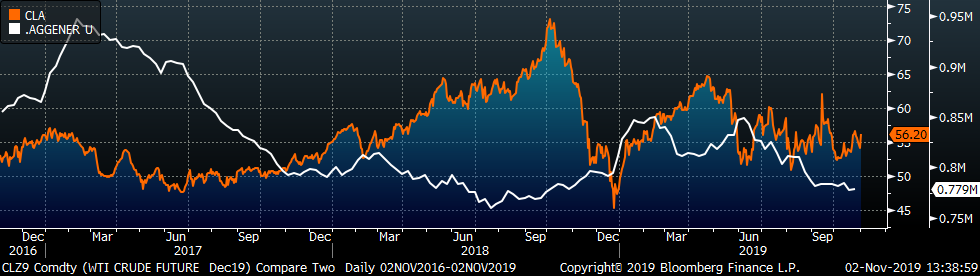
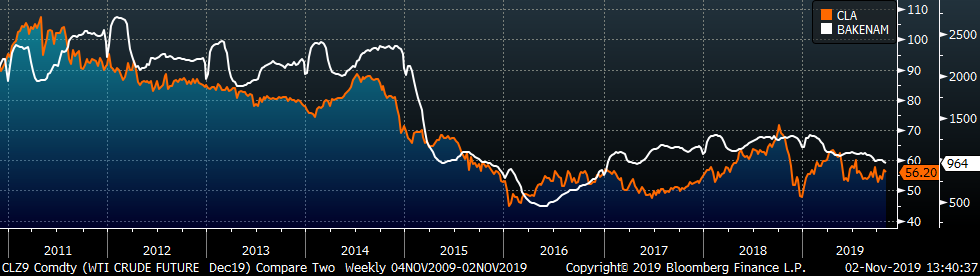
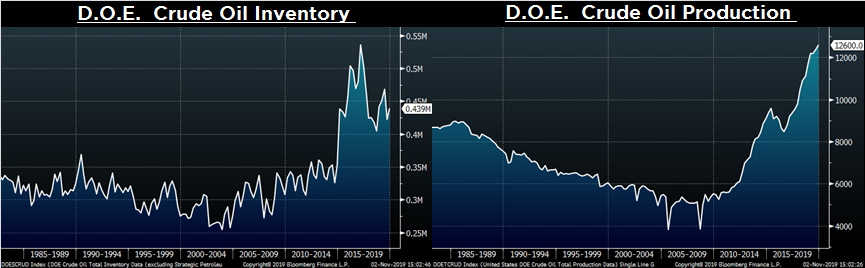
Last week, the December WTI crude oil future lost $0.46 or 0.8% to $56.20/bbl. The aggregate inventory level was up 0.2%, while crude oil production remains at 12.6m bbl/day. The Baker Hughes North American rig count lost thirteen rigs, while the U.S. count lost eight. The energy sector remains a weak point in terms of steel demand.
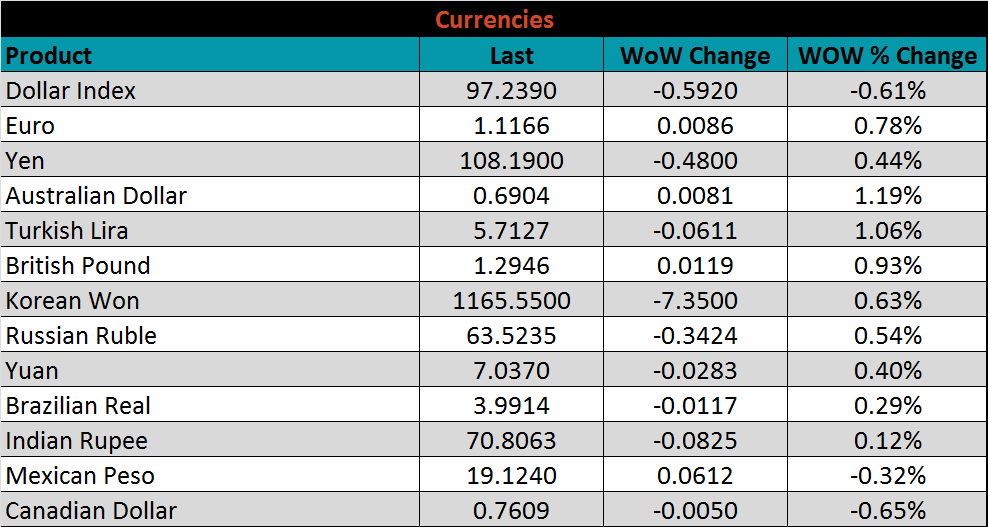
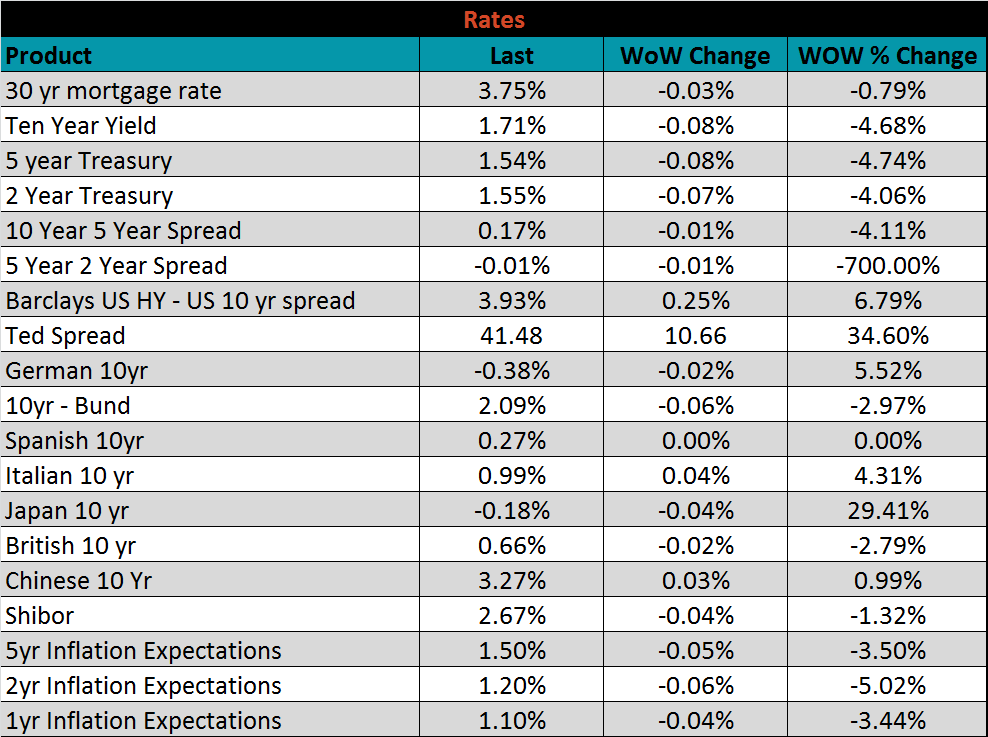
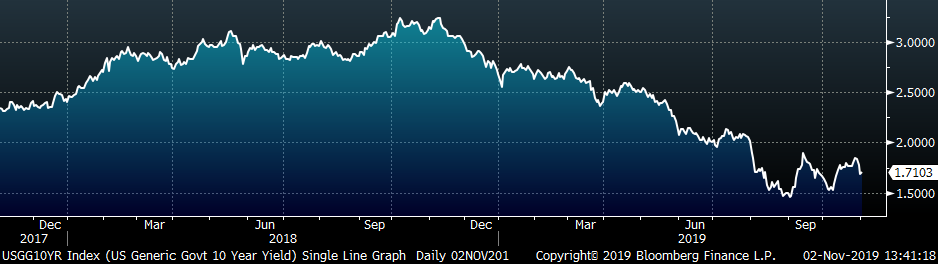
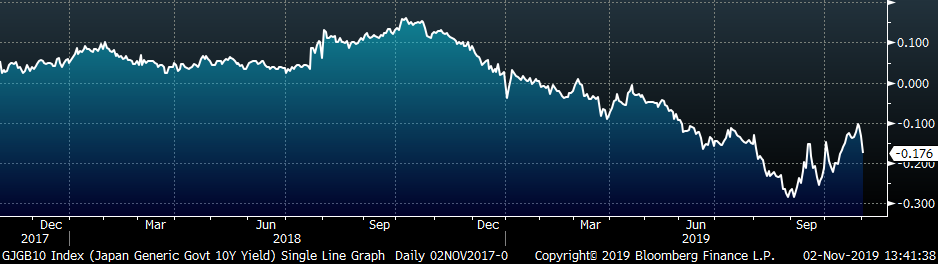
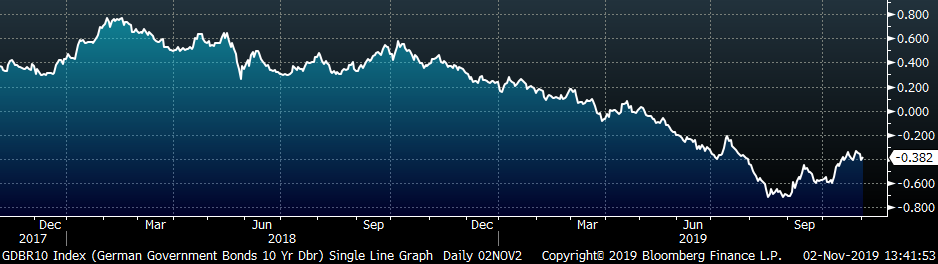
The U.S. 10-year yield was down 8 bps, closing the week at 1.71%, after the FOMC decision to move the target range 25 basis points lower. The German 10-year yield was down 2 bps to minus 0.38%, while the Japanese 10-year yield was down 4 bps to minus 0.18%.
The list below details some upside and downside risks relevant to the steel industry. The orange ones are occurring or look to be highly likely. The upside risks look to be in control.
Upside Risks:
Downside Risks: