Content
-
Weekly Highlights
- Market Commentary
- Durable Goods
- Upside & Downside Risks


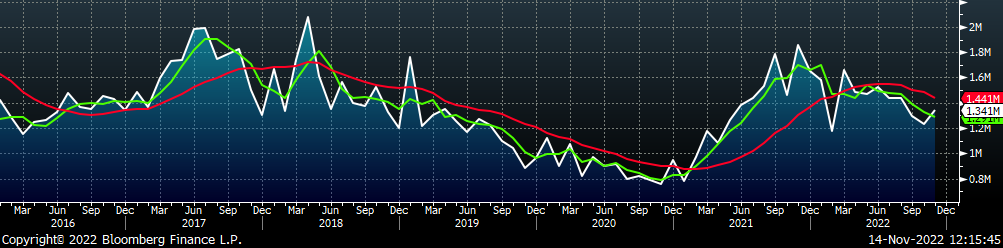
Last week, we ended the top section of the report, which detailed recent economic data by noting the disparity between auto sales and the (inverse) unemployment rate. This relationship historically shows how low unemployment drives demand for cars. The chart below shows auto production, going back to the beginning of 2000 with the dotted yellow line representing the 2-year average before the pandemic (2018 & 2019).
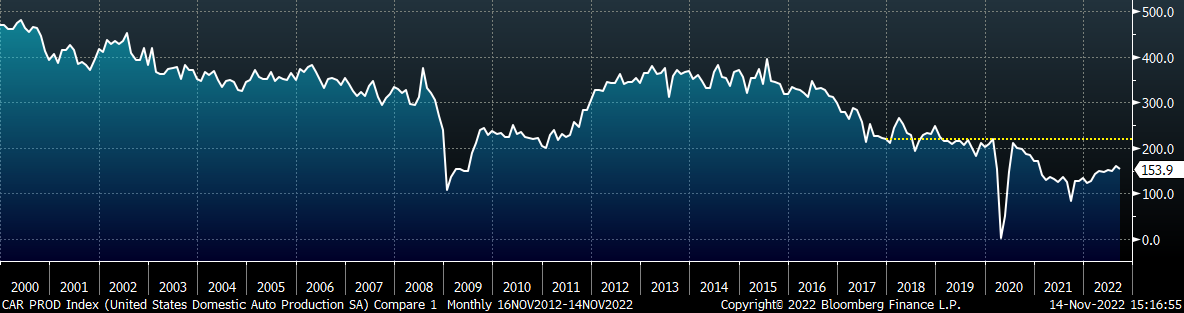
Auto production has been significantly hampered by supply chain woes and the microchip shortage. Those restrictions have eased over the last 6 months and auto production is slowly grinding higher while increasing interest rates have been a growing headwind for demand in both the manufacturing and construction sectors. Up to this point, the downside pressure has been more significant, however, pent-up demand for autos, which we estimate at ~1.1 million cars, in a reduced supply environment, like today’s, could bridge the gap left from a manufacturing slowdown and support falling steel prices.
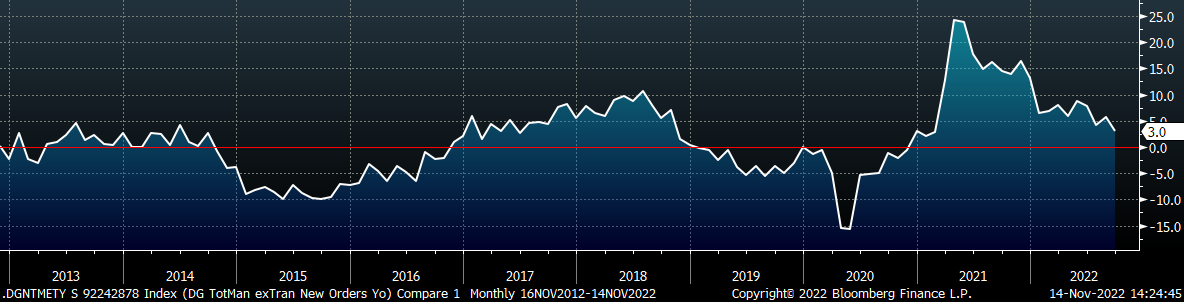
The above-mentioned dynamic is clear in the September durable goods report, where we observe the differences between manufacturing new orders with and without transportation equipment. Compared to September last year, total manufacturing was up 7.1% and it was up slightly, 0.5% compared to August. Manufacturing without transportation is only up 3.0% compared to September 2021 and is down -1.5% compared to August.
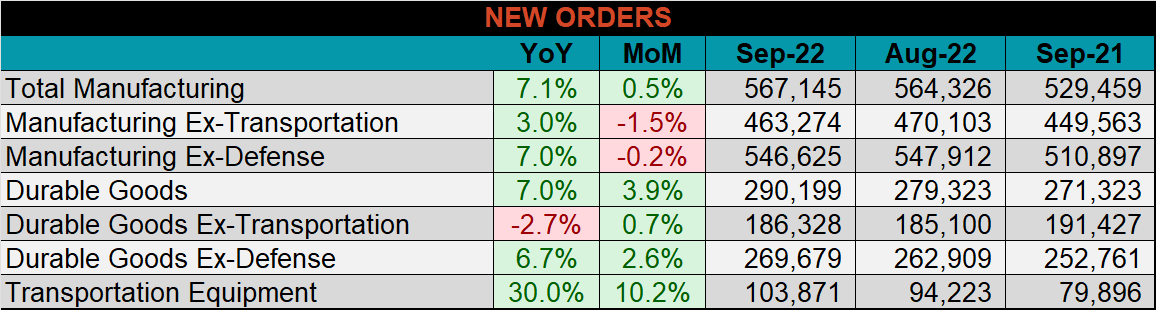
Despite growing at the slowest YoY rate since February of 2021, Total Manufacturing New Orders Ex-Transportation increased for the 23rd consecutive month.
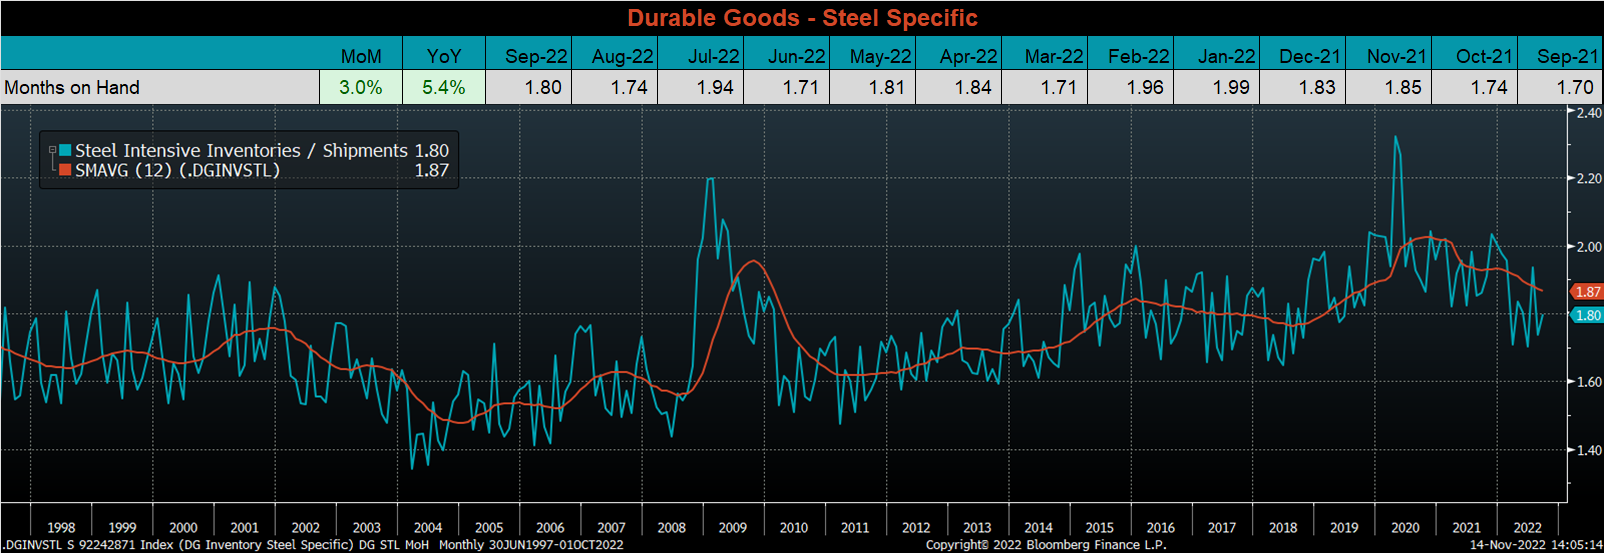
The chart below looks at the months on hand (inventory divided by shipments) from the September durable goods report, using categories that are steel intensive. MoH rebounded this month, driven by a 3.7% decrease in shipments compared to a 0.5% decrease in inventories. The 12-month moving average is trending lower, as inventories slid over the last 3 months, while shipments have been mostly elevated since February. If this trend of higher shipments and lower inventories continues, manufacturers are more likely to restock once it is clear that input prices have stopped falling.
Upside Risks:
Downside Risks:
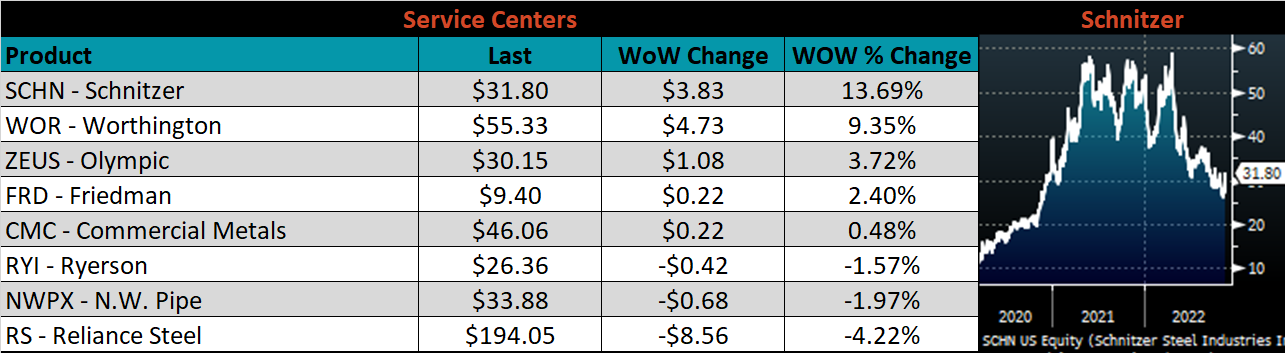
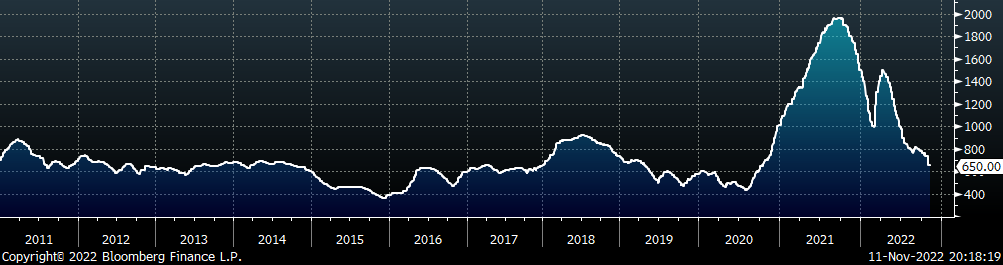
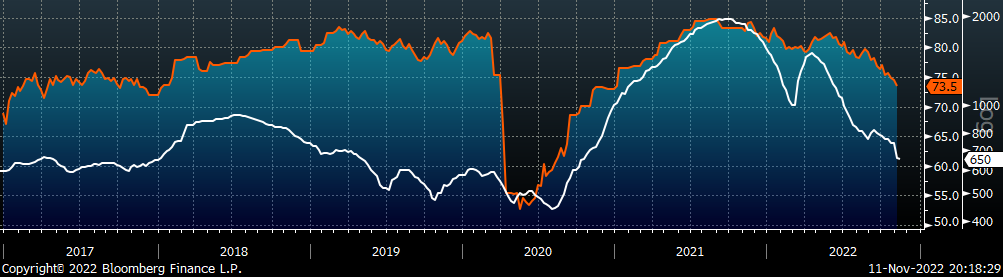
The Platts TSI Daily Midwest HRC Index was down another $5, ending at $650.
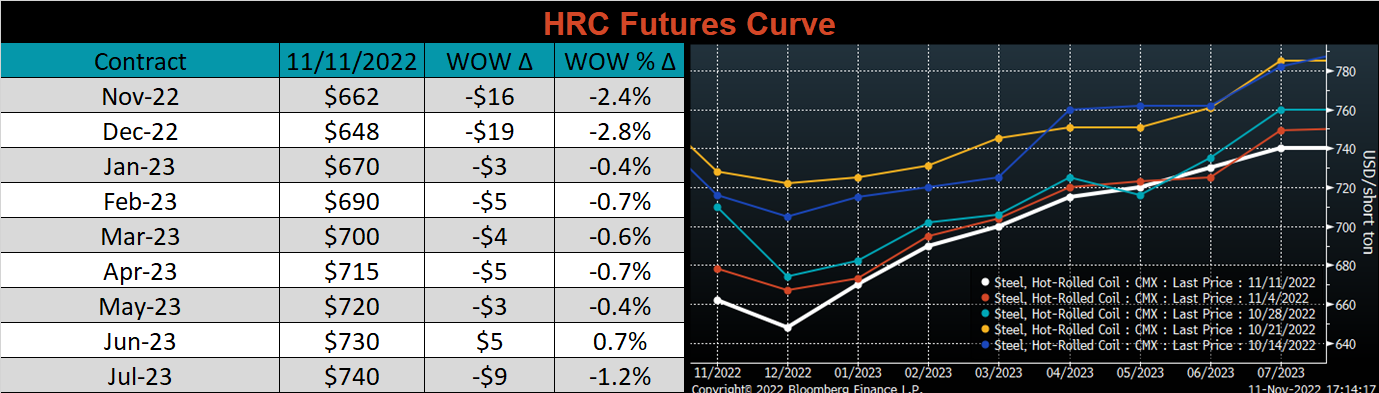
The CME Midwest HRC futures curve is below, with last Friday’s settlements in white. The front of the curve continued it’s recent trend and printed lower, while the remainder of the curve showed very little change.
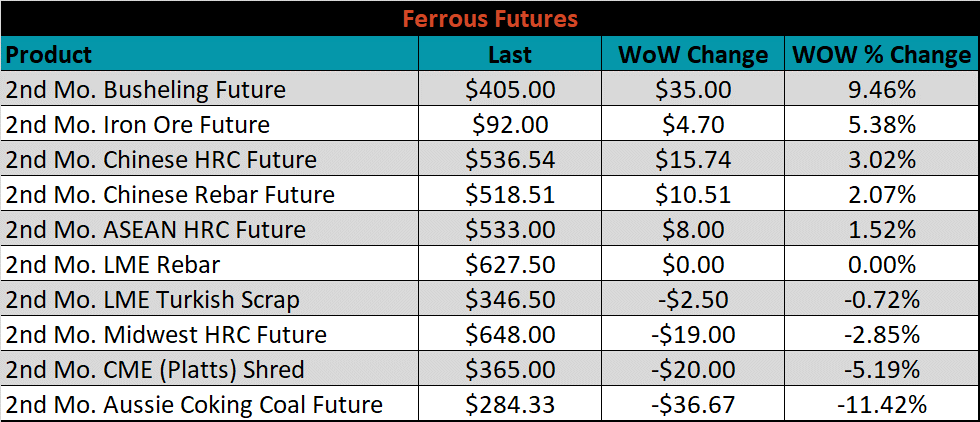
The 2nd month ferrous futures ended the week mixed, busheling gained 9.5%, while Aussie coking coal lost 11.4%.
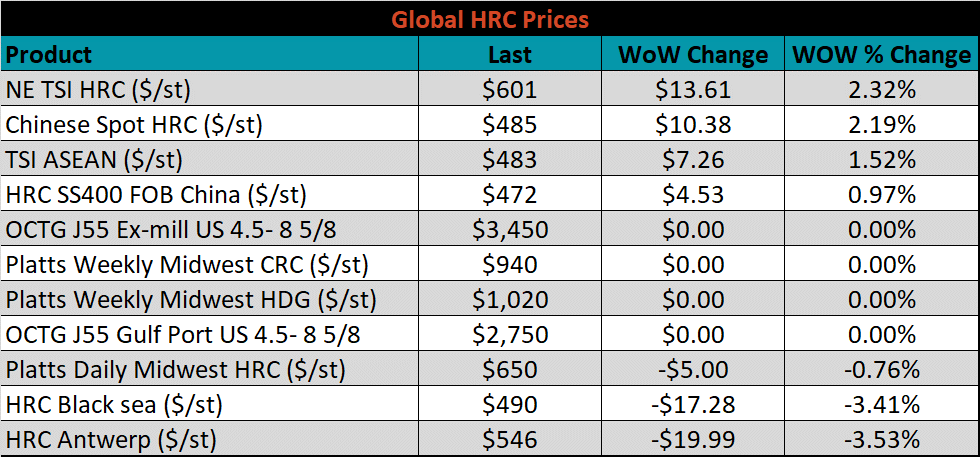
Global flat rolled indexes were mixed last week, with Northern European HRC, up 2.3%, while Antwerp HRC was down 3.5%.
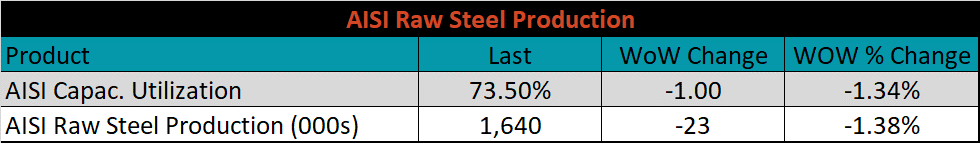
The AISI Capacity Utilization was down another 1% to 73.5%.
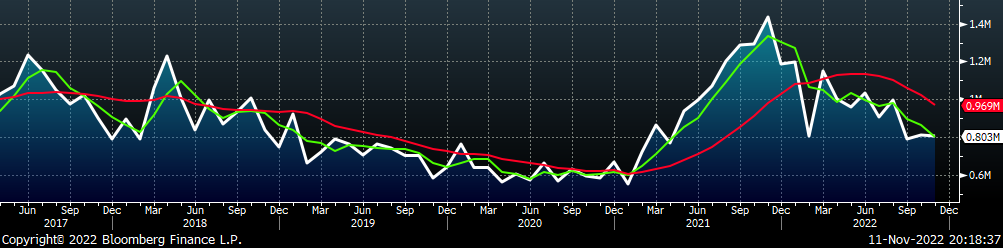
November flat rolled import license data is forecasting a decrease of 9k to 803k MoM.
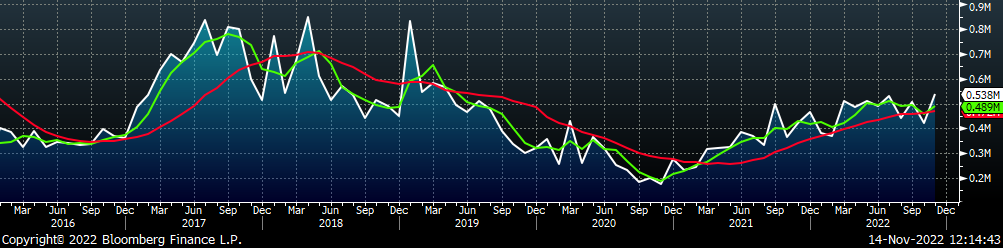
Tube imports license data is forecasting an increase of 115k to 538k in November.
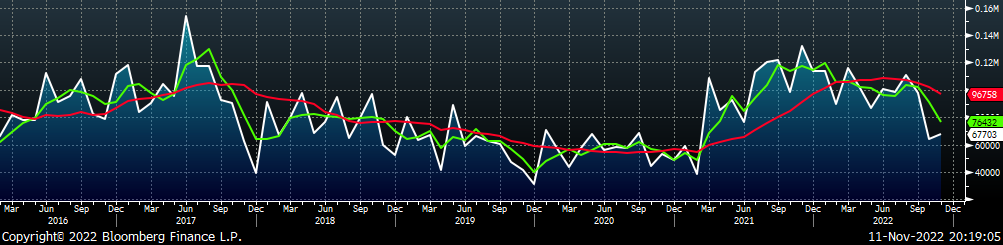
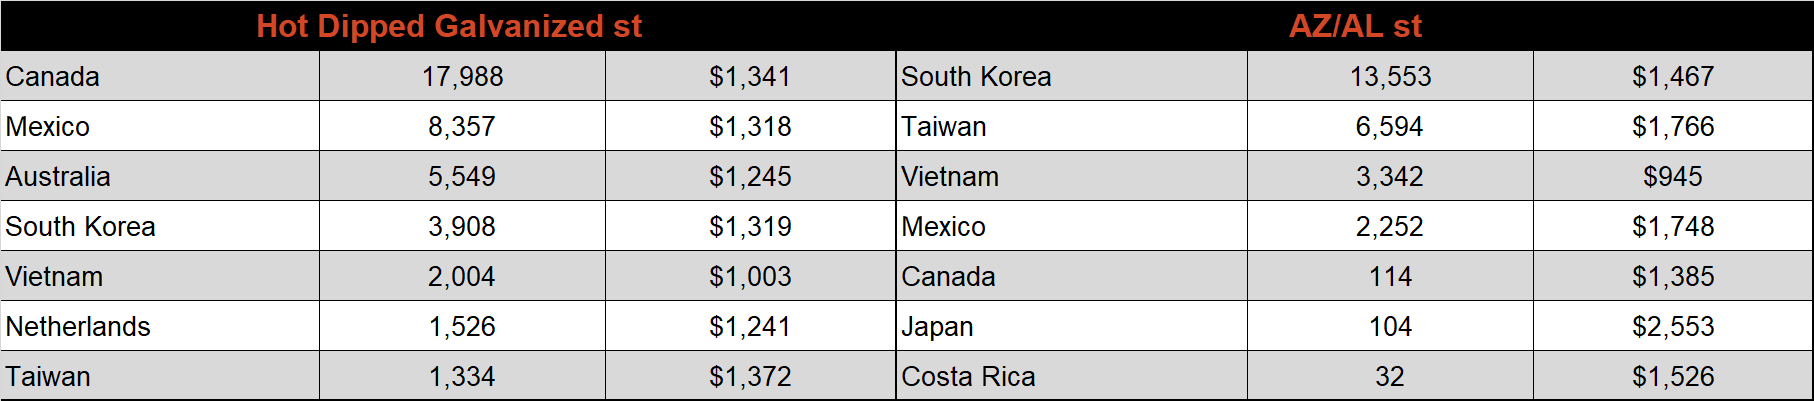
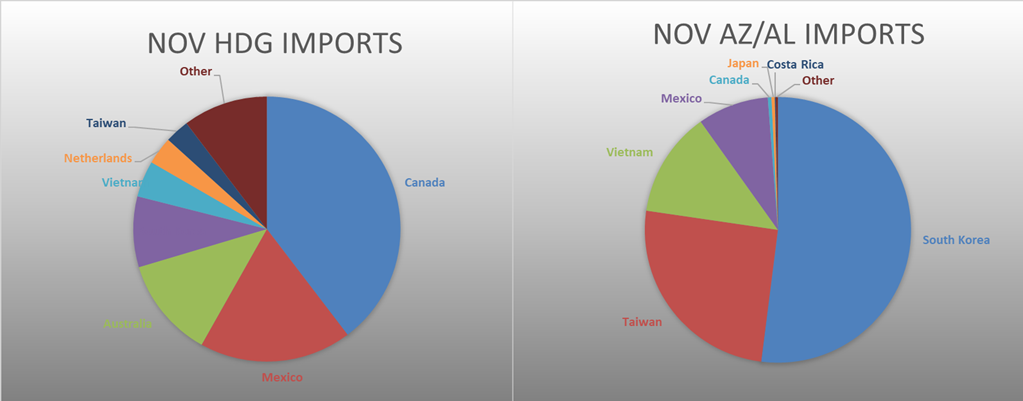
November AZ/AL import license data is forecasting an increase of 4k to 68k.
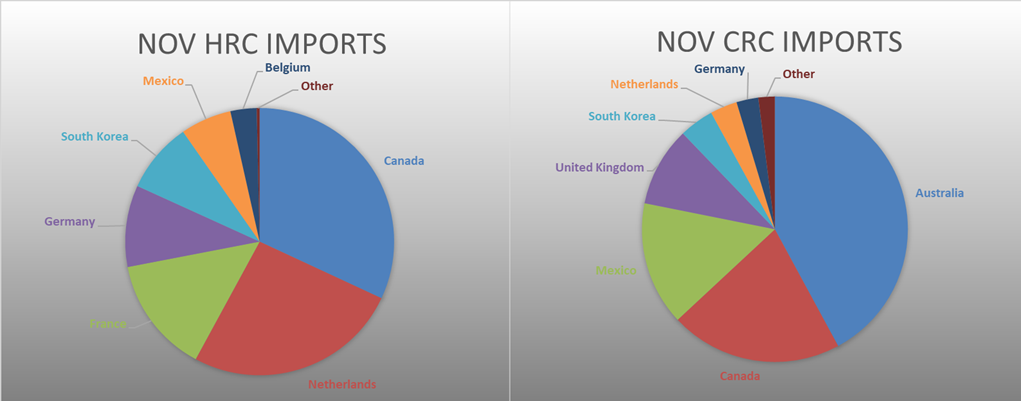
Below is November import license data through November 7th, 2022.
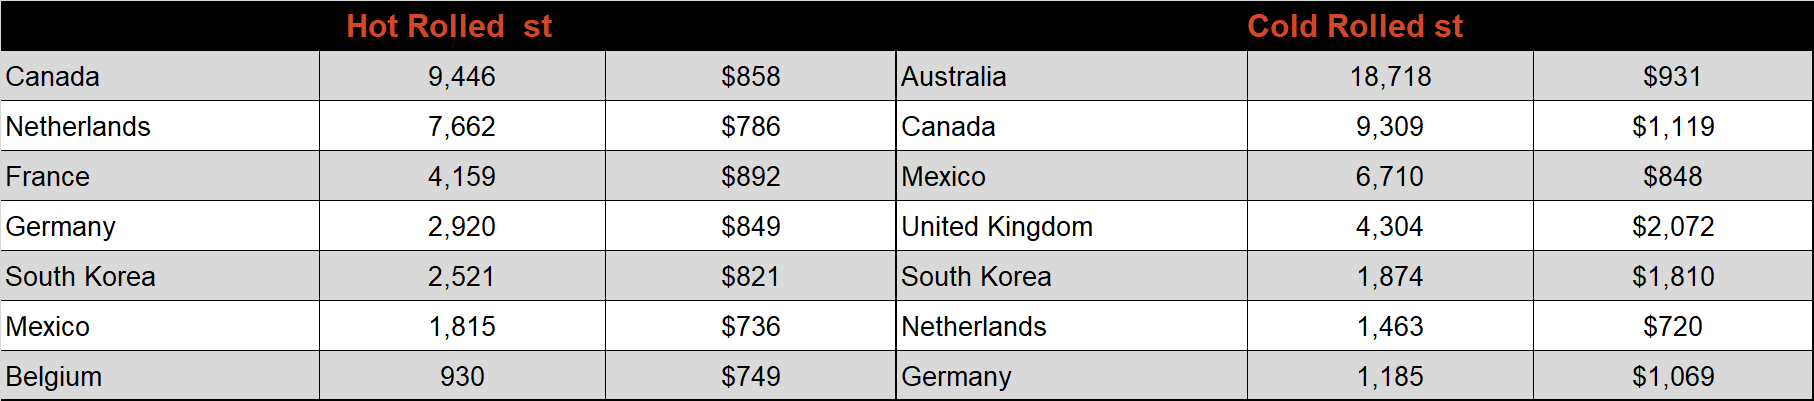
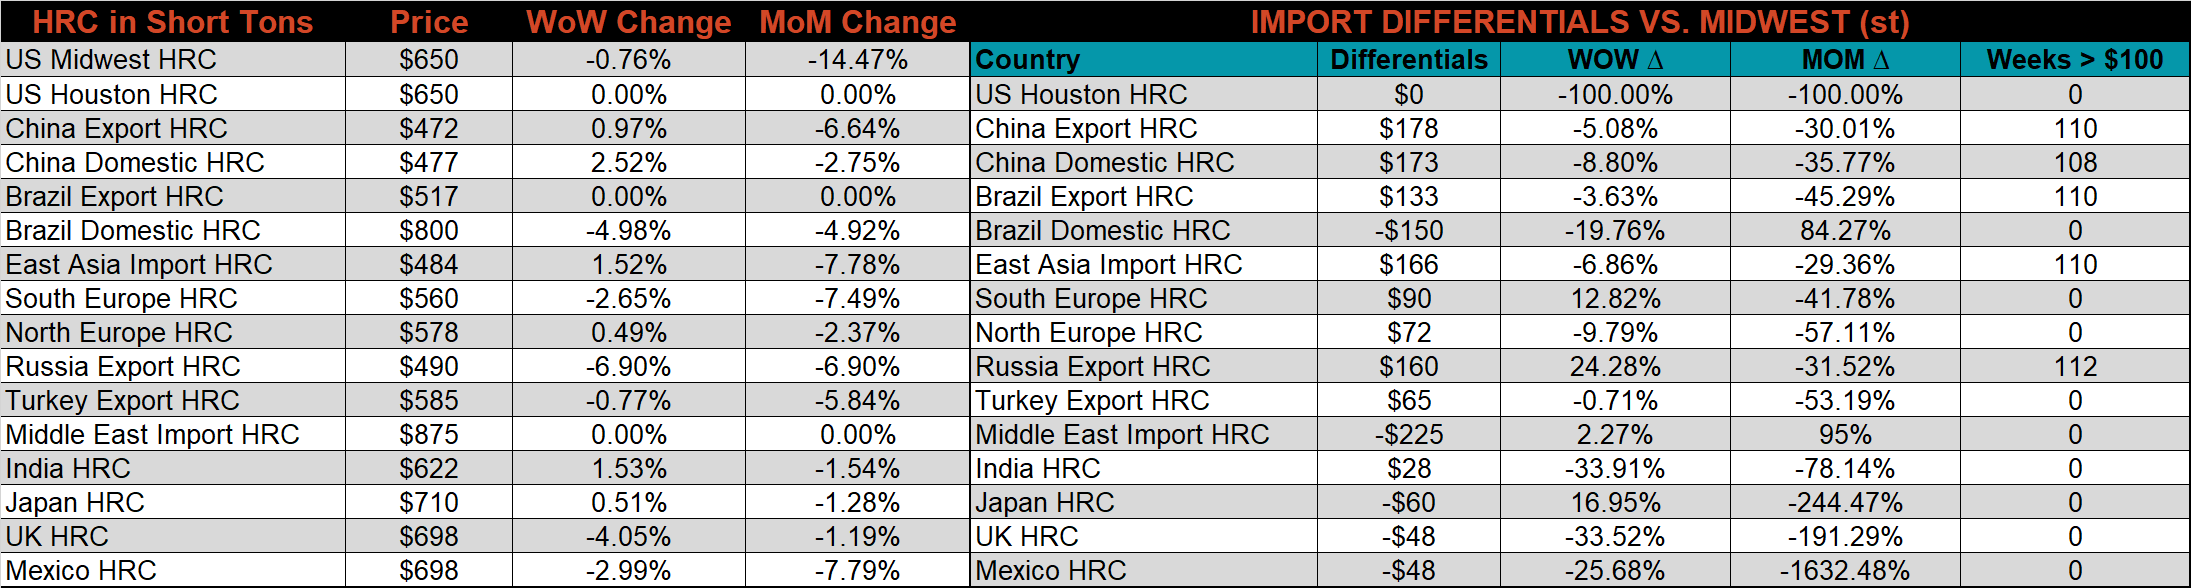
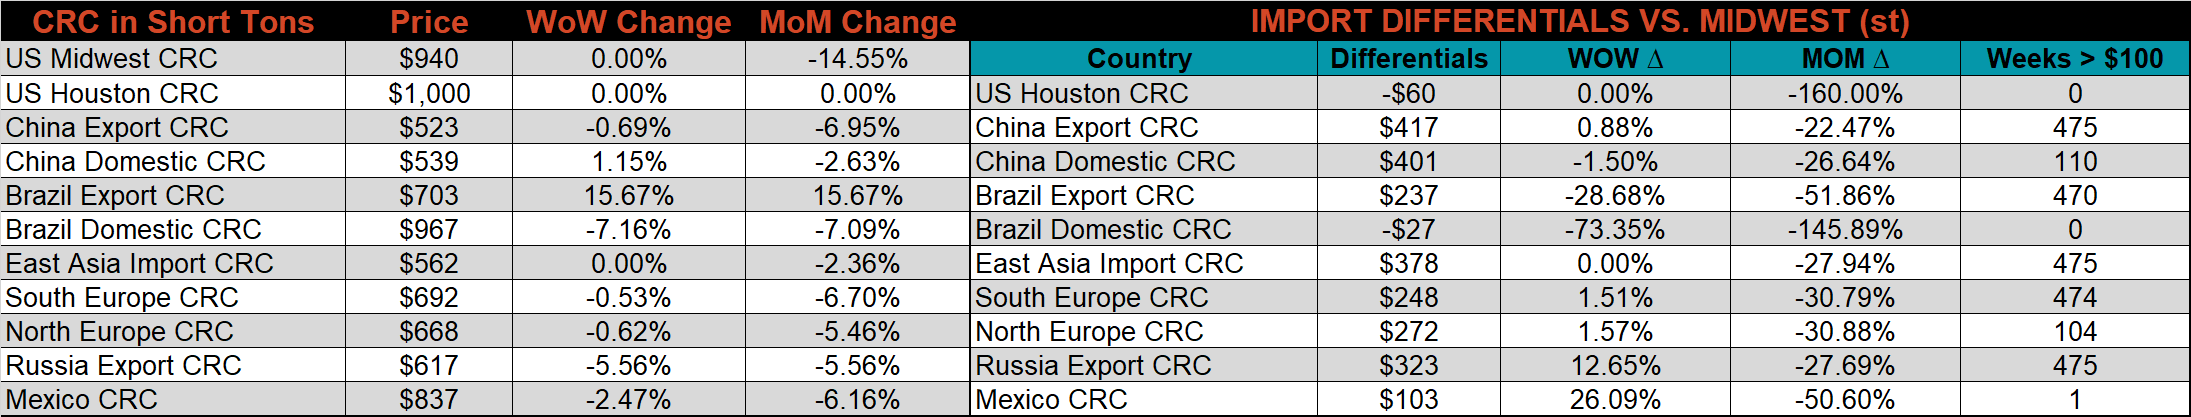
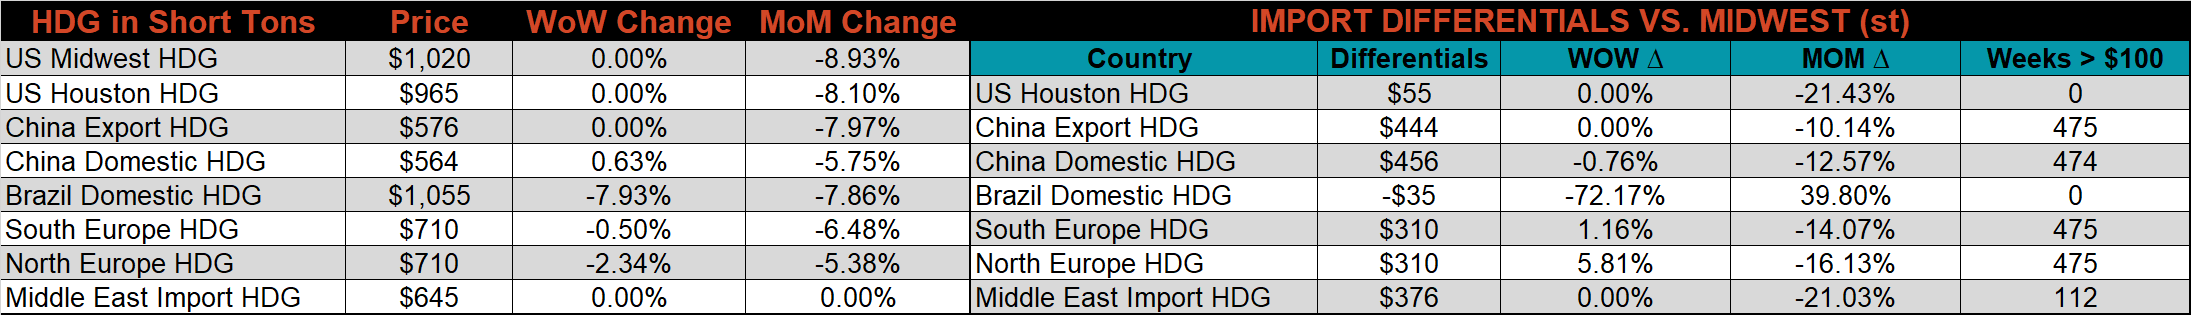
Below is the Midwest HRC price vs. each listed country’s export price using pricing from SBB Platts. We have adjusted each export price to include any tariff or transportation cost to get a comparable delivered price. All the global differentials, excluding Russia’s, decreased further this week.
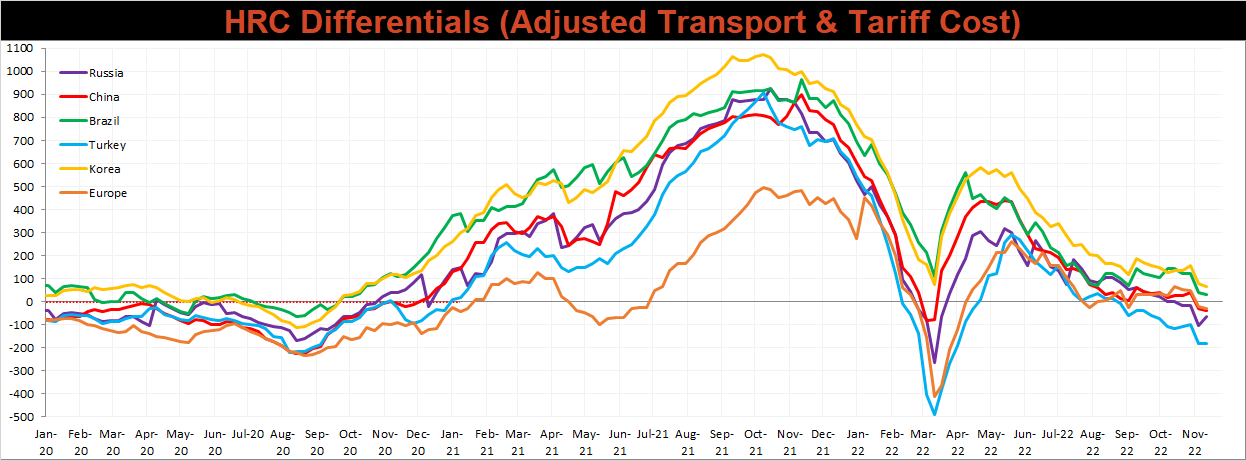
Global prices were mostly lower again this week, led by the Russian export HRC price, down 6.9%. On the other hand, the East Asian and Chinese HRC prices both increased this week, up 1.5% and 1%, respectively.
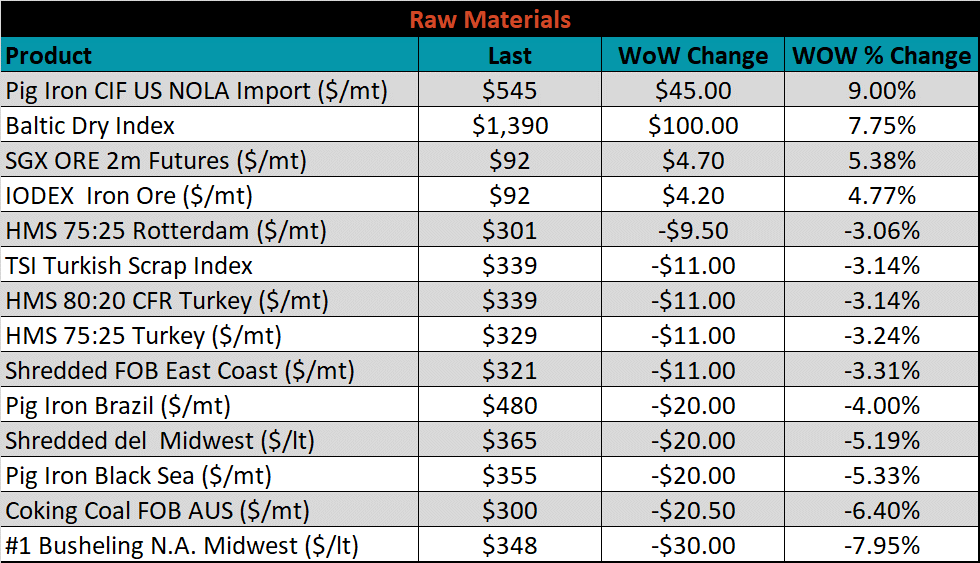
Raw material prices were mixed again this week, with New Orleans delivered pig iron up, 9%, while Midwest busheling was down 8%.
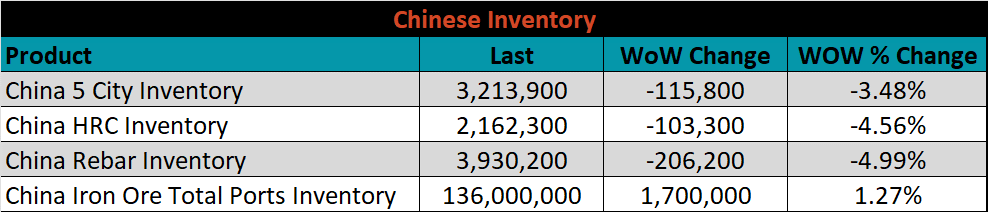
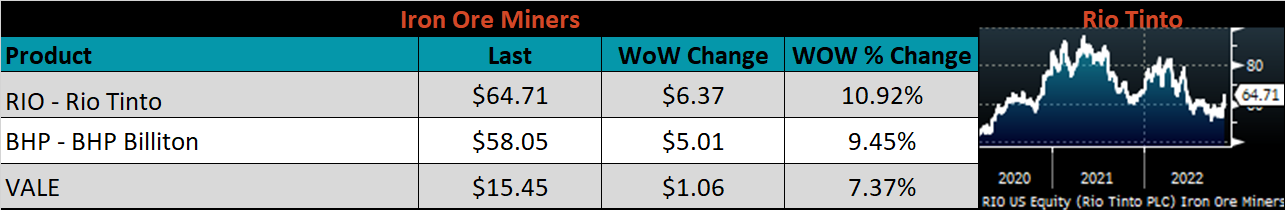
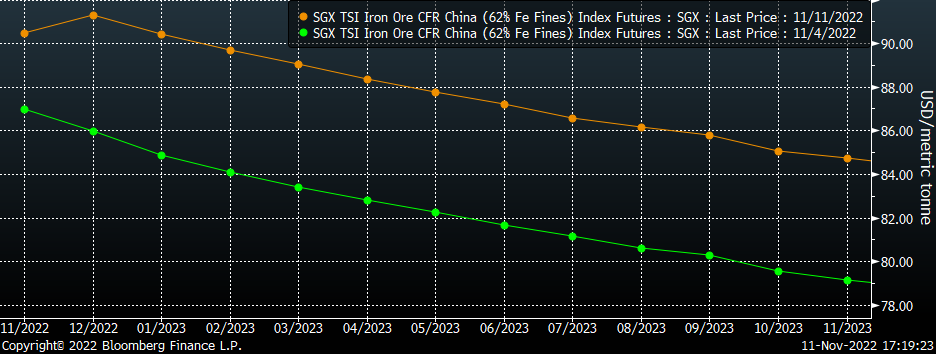
Below is the iron ore future curve with Friday’s settlements in orange, and the prior week’s settlements in green. Iron ore continued to rally last week, as some of the political headwinds in China have started to dissipate.
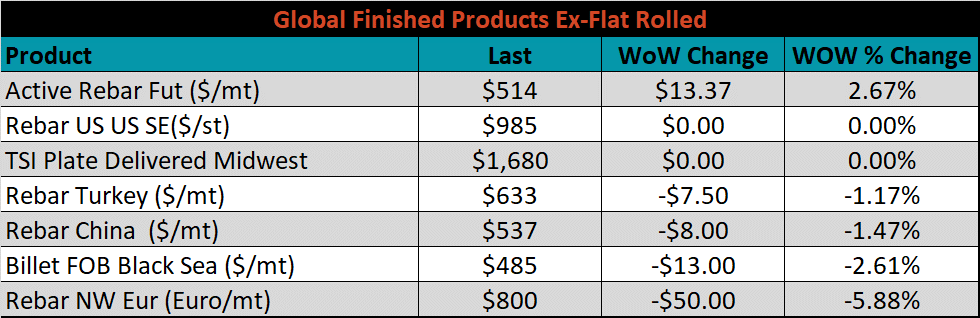
The ex-flat rolled prices are listed below.

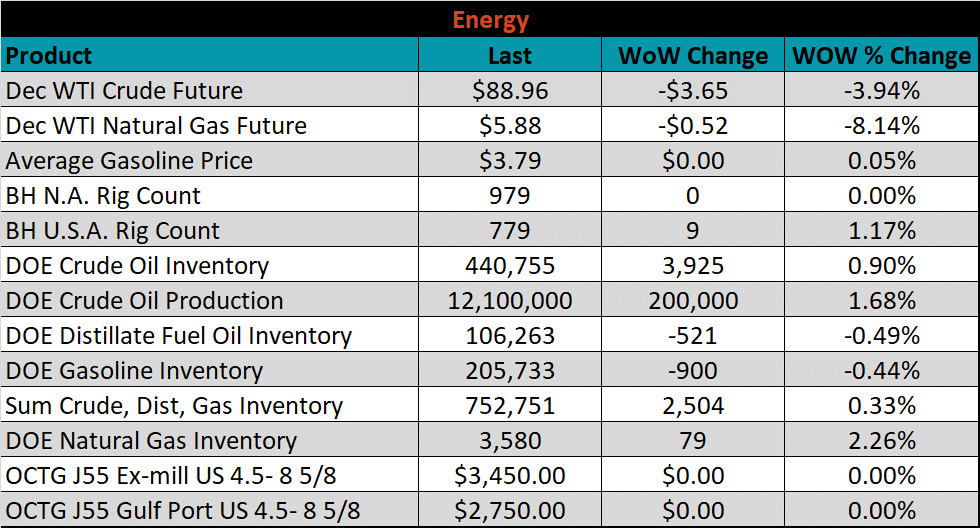
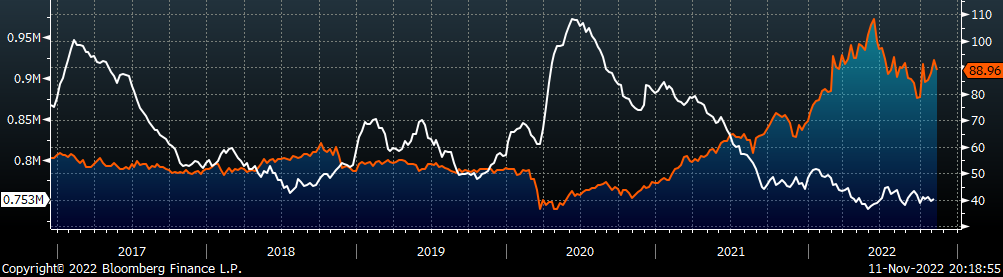
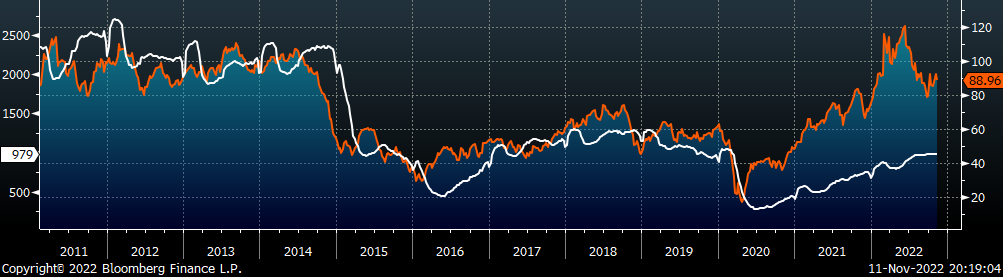
Last week, the December WTI crude oil future lost $3.65 or 3.9% to $88.96/bbl. The aggregate inventory level rose 0.3%. The Baker Hughes North American rig count was unchanged, while the U.S. rig count increased by 9 rigs.
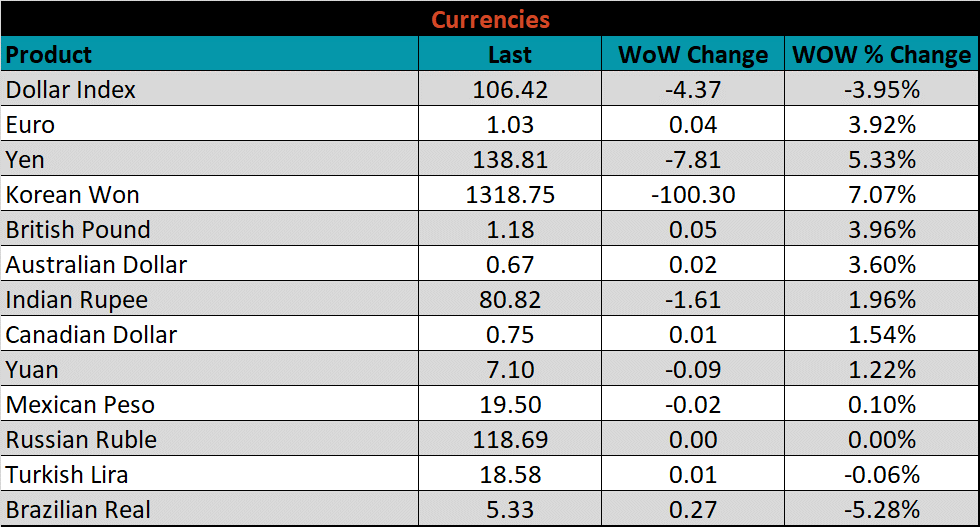
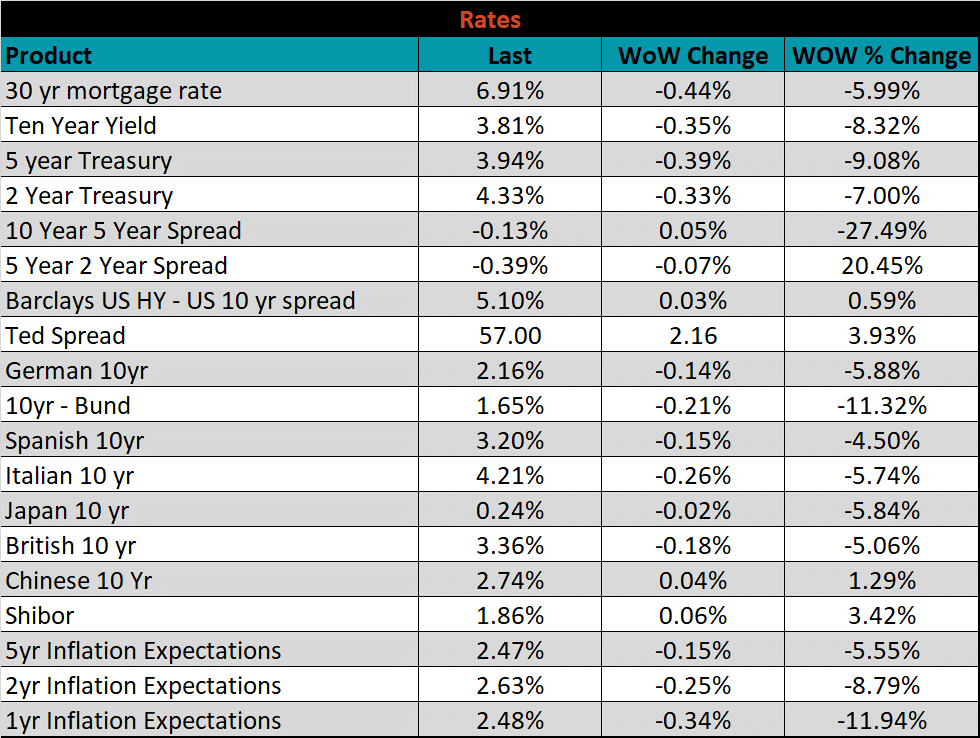
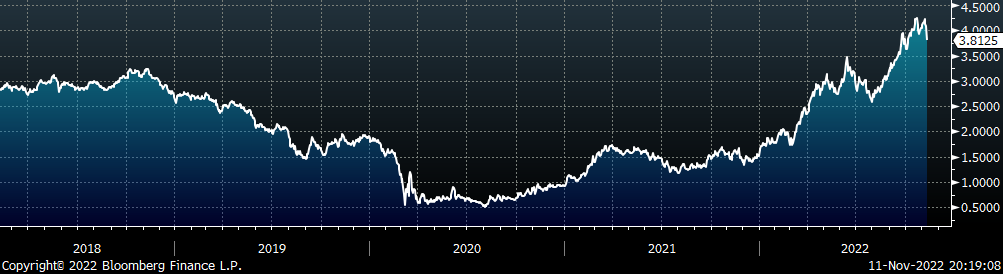
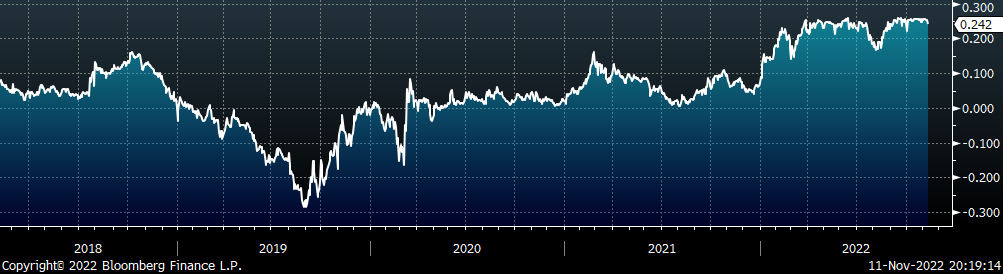
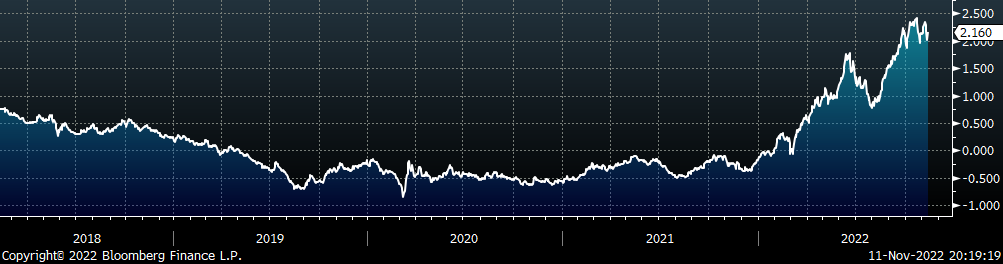
The U.S. 10-year yield fell 35 bps, closing the week at 3.81%. The move came at the end of the week, after Thursday’s CPI print came in below expectations. The German 10-year yield was down 14 bps to 2.16%, and the Japanese 10-year yield was down 2 bps to 0.24%.
The list below details some upside and downside risks relevant to the steel industry. The bolded ones are occurring or highly likely.
Upside Risks:
Downside Risks: