Content
-
Weekly Highlights
- Market Commentary
- Durable Goods
- Risks


As we enter a new week with no major changes to the domestic steel market, or our outlook, it is helpful to take a step back to understand the market dynamics from a 30,000-foot view. We are in the mist of one of the most drastic supply driven price rallies in recent history, driven in part by a global pandemic and its economic recovery. It is important to understand how this differs from other price upcycles, which can be driven by other factors including overwhelming demand, restocking and raw material cost pressure. While these factors may also be affecting the market, they are not the main driver of this rally, and cannot relieve the current steel deficit alone. Therefore, to understand how this cycle will play out, we must focus on the different conditions needed to reverse the domestic steel shortage.
As this is currently a supply driven market, many in the market point to two specific threats to the rally: 1) increased production and 2) higher import levels. In order to understand how production levels will change, we must look at profitability on the marginal ton sold by mills. As the mills profit grows, higher production levels become more likely. However, mills are struggling with operational issues at current production levels. Both integrated and mini mills are trying to “catch up” with their order book, still needing to produce and deliver tons that were expected weeks ago. Operations are generally not going smoothly, as maintenance and outages this fall have created an unstable production environment. Regarding imports, we turn to price differentials, which have been rising over the past few months. However, they have not reached levels that historically spur higher import levels, as global steel prices have also strengthened significantly on the back of strong demand in China. Even if imports and domestic production increase as we move into next year, they only play a part of the domestic supply picture.
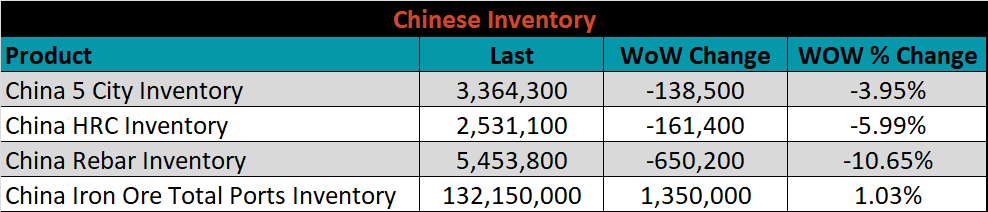
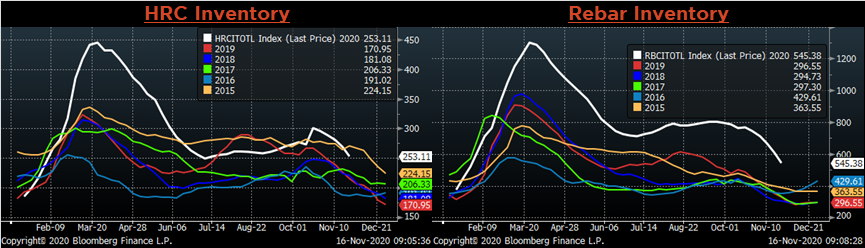
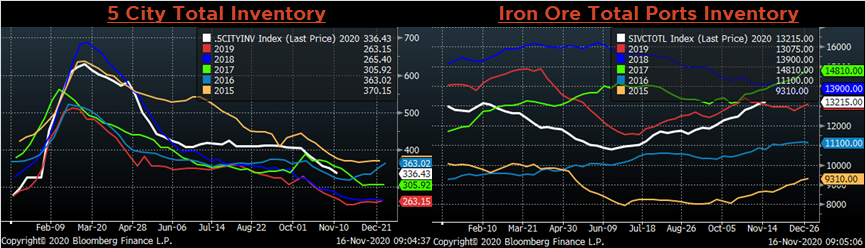
Inventories have been tightening for several weeks as steel consumers refrained from buying during the uncertainty of the pandemic, and have since destocked rather than pay the current spot price for new material (see Durable Goods section below). Additionally, any service centers with material coming into the fall have since destocked as the market rose and buyers went to service centers instead of mills to fill any current material needs. Depleted inventory levels increase the likelihood that both end users and service centers will need to restock to normalize their businesses as the economy recovers and stabilizes over the course of next year. Even if imports and domestic production levels increase, the buying community has significant work to do in order to right size their inventories to sustainable levels. With the need to restock lingering with buyers across the supply chain, orders at mills are poised to increase moving into next year, further supporting higher prices.
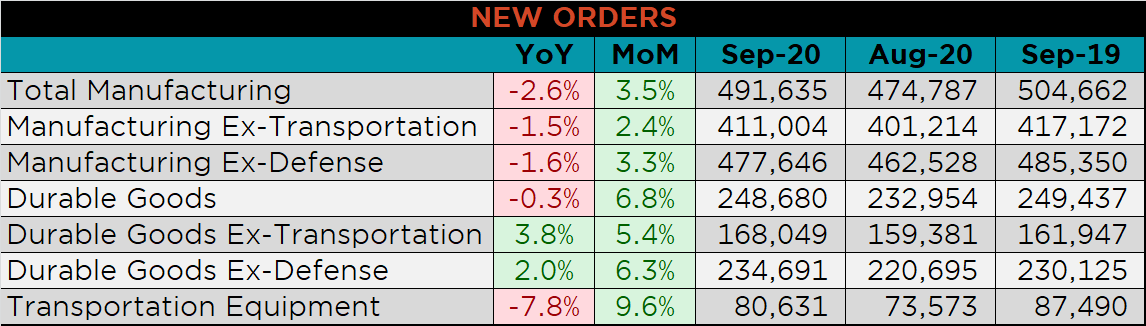
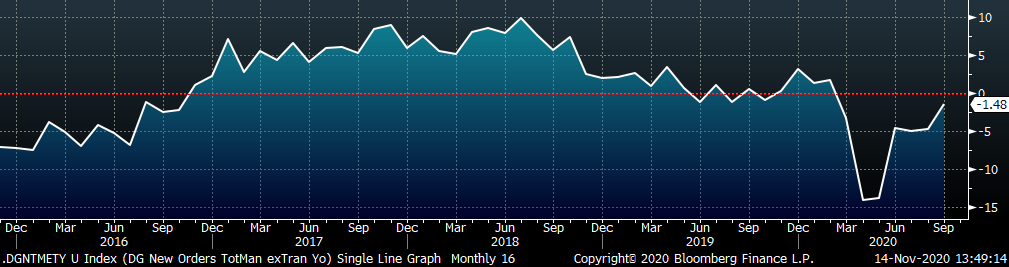
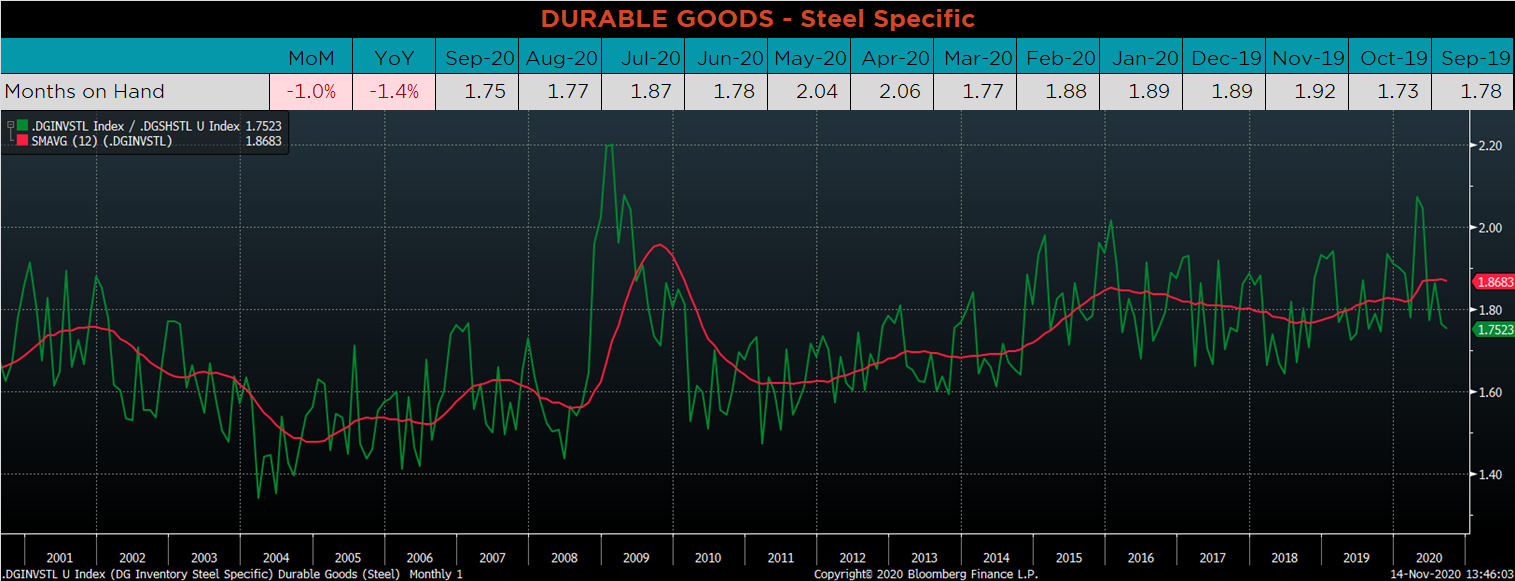
Below are final September new orders from the Durable Goods report. New orders for manufactured goods were down 2.6% compared to September 2019, but up compared to last month. Manufacturing new orders ex-transportation improved compared to the previous 4 months, but remains down 1.5% YoY. The final chart looks at the months on hand (inventory divided by shipments) for durable goods categories that are steel intensive. MOH moved slightly lower, as monthly shipments increased and inventories decreased.
Below are the most pertinent upside and downside price risks:
Upside Risks:
Downside Risks:
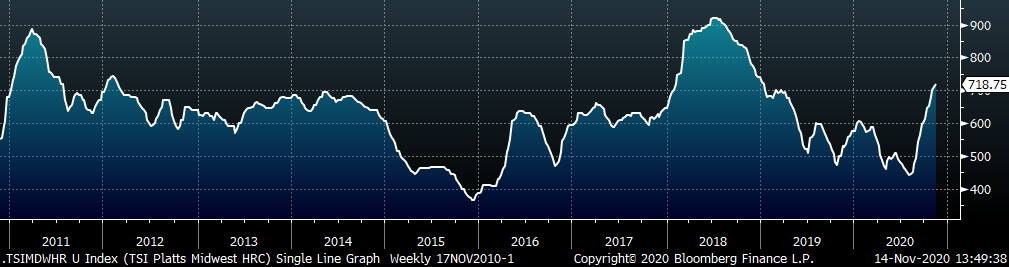
The Platts TSI Daily Midwest HRC Index increased by $9.75 to $718.75.
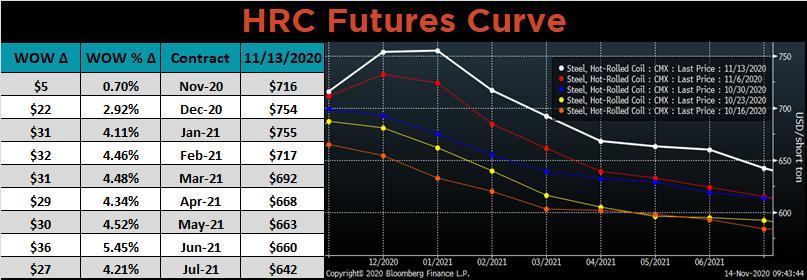
The CME Midwest HRC futures curve is below with last Friday’s settlements in white. The curve shifted significantly higher across all expirations last week.
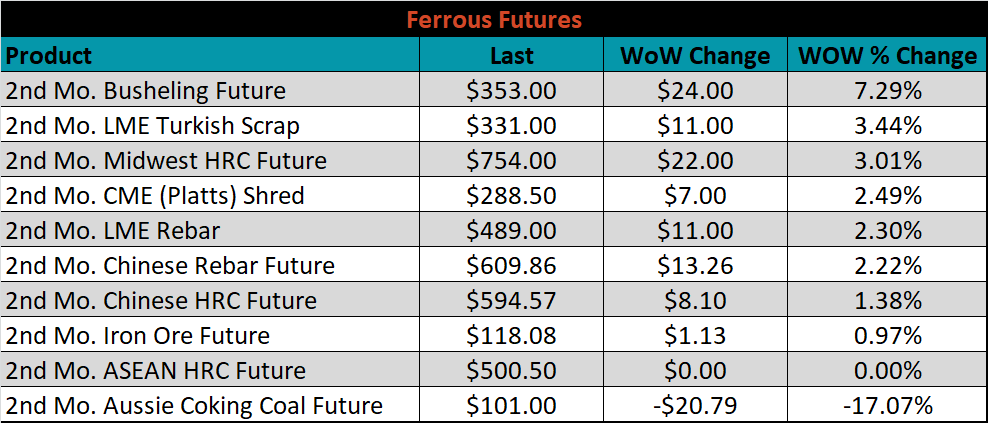
December ferrous futures were mostly higher. Busheling gained 7.3%, while Aussie coking coal fell 17.1%.
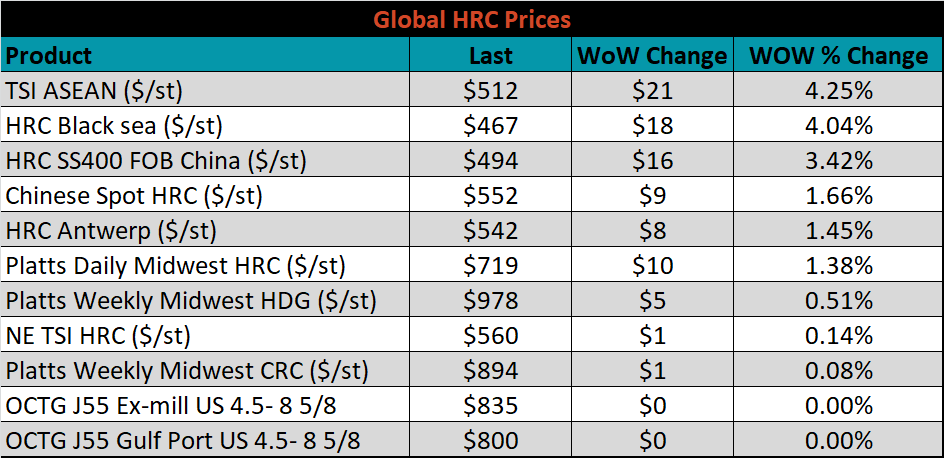
The global flat rolled indexes were all higher, led by TSI ASEAN HRC, up 4.3%.
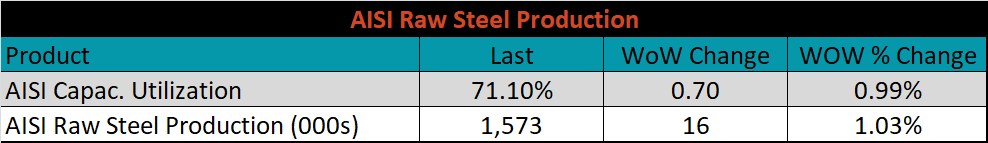
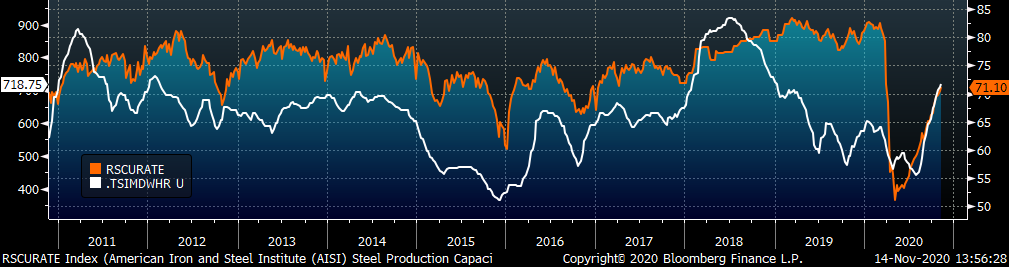
The AISI Capacity Utilization rate increased 0.7% to 71.1%.
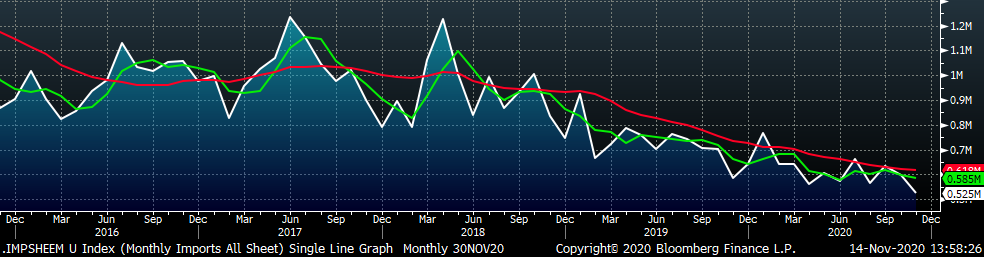
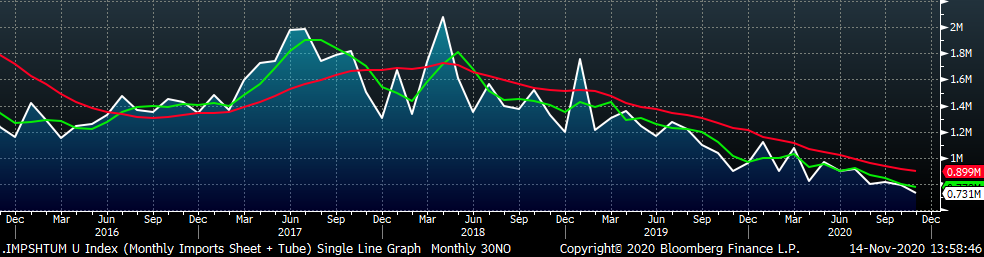
November flat rolled import license data is forecasting a decrease of 72k to 525k MoM.
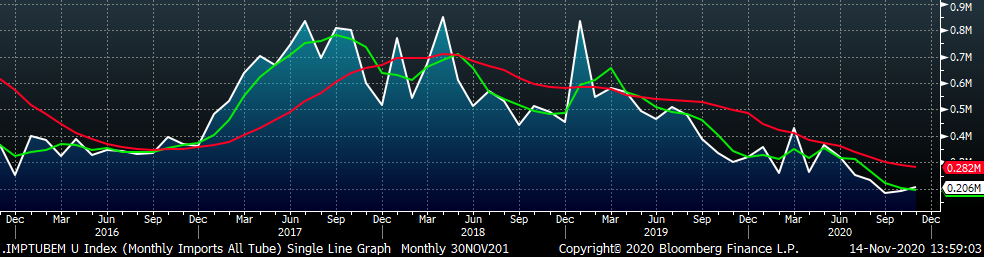
Tube imports license data is forecasting an increase of 14k to 206k in November.
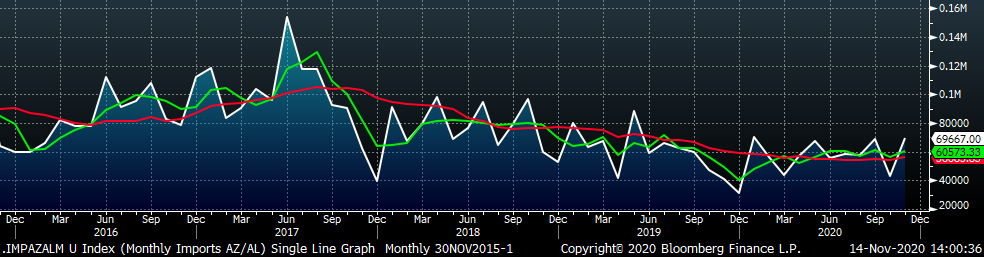
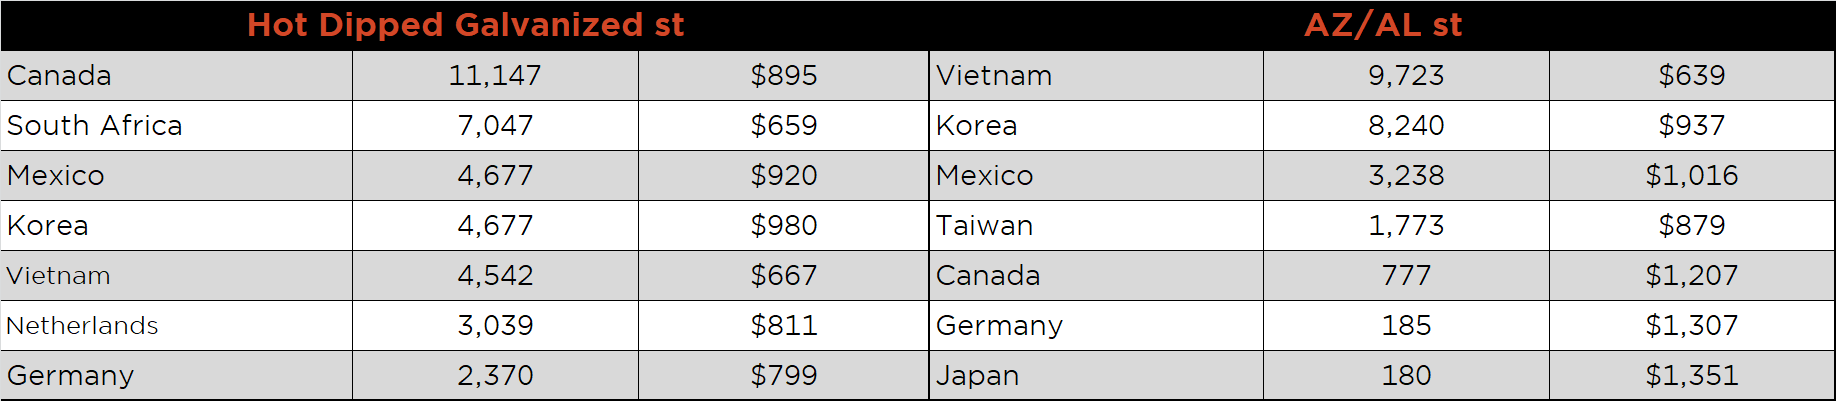
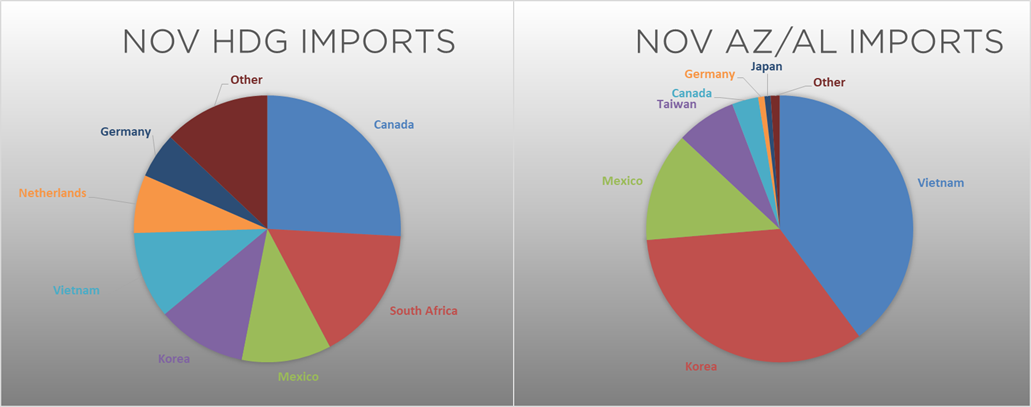
November AZ/AL import license data is forecasting a 24k increase to 46k.
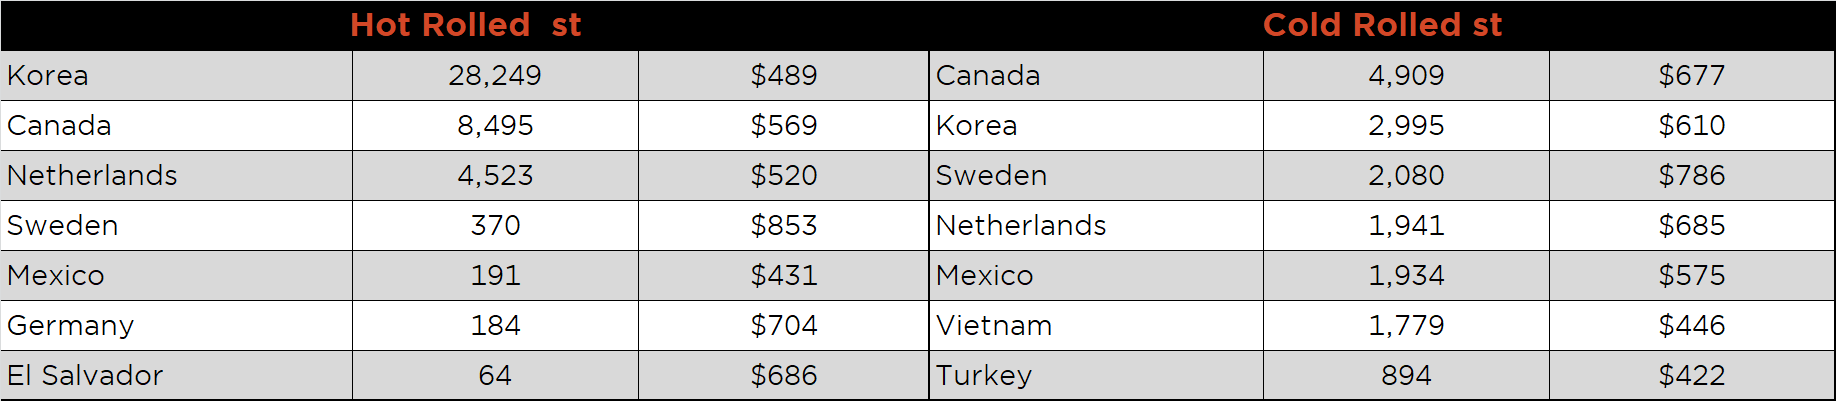
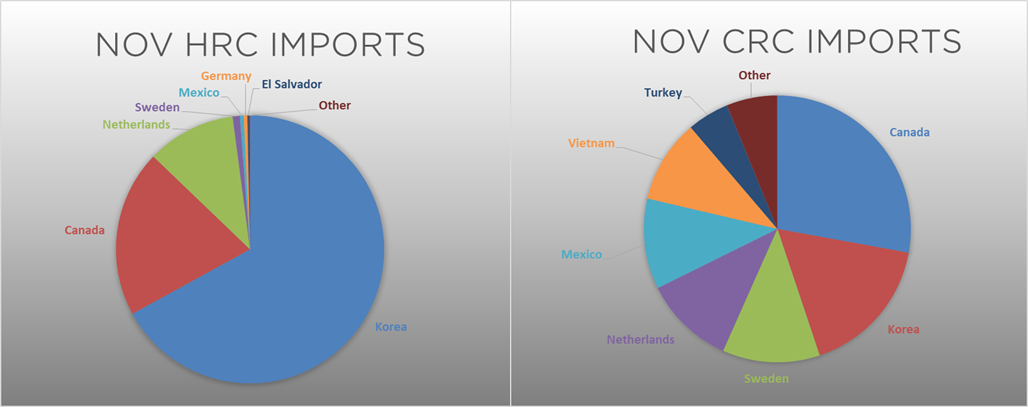
Below is November import license data through November 10, 2020.
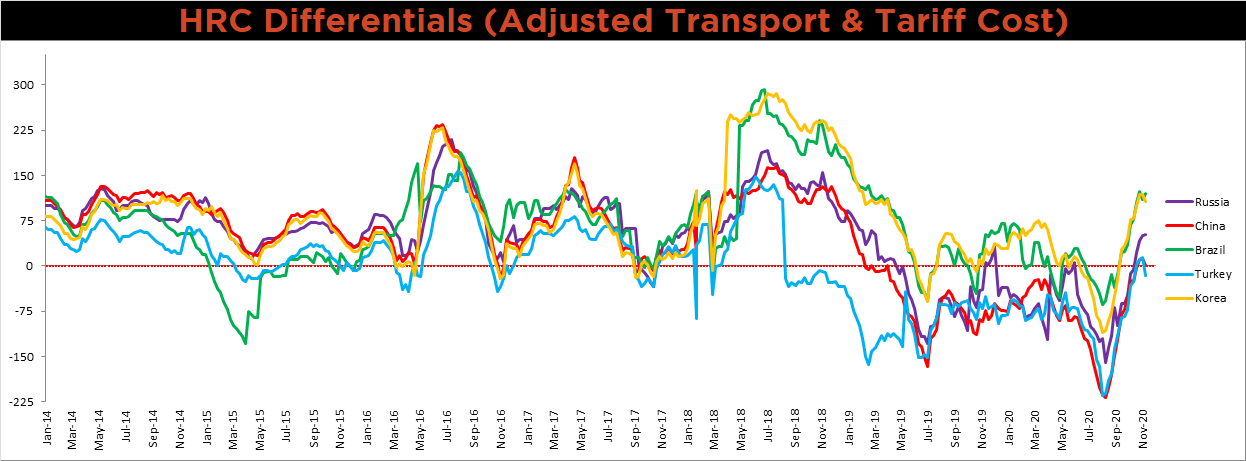
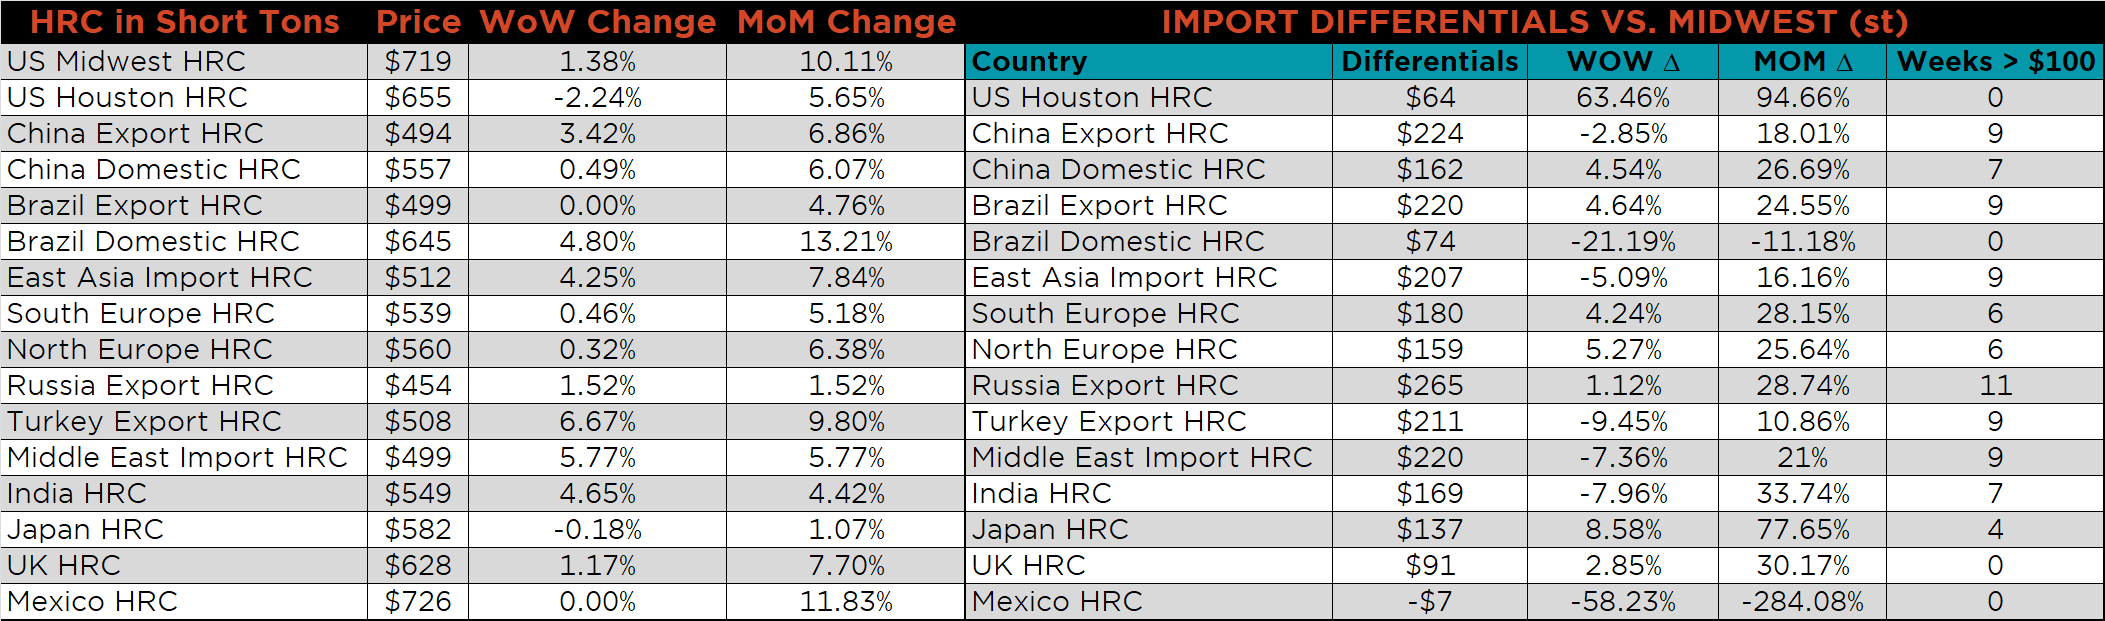
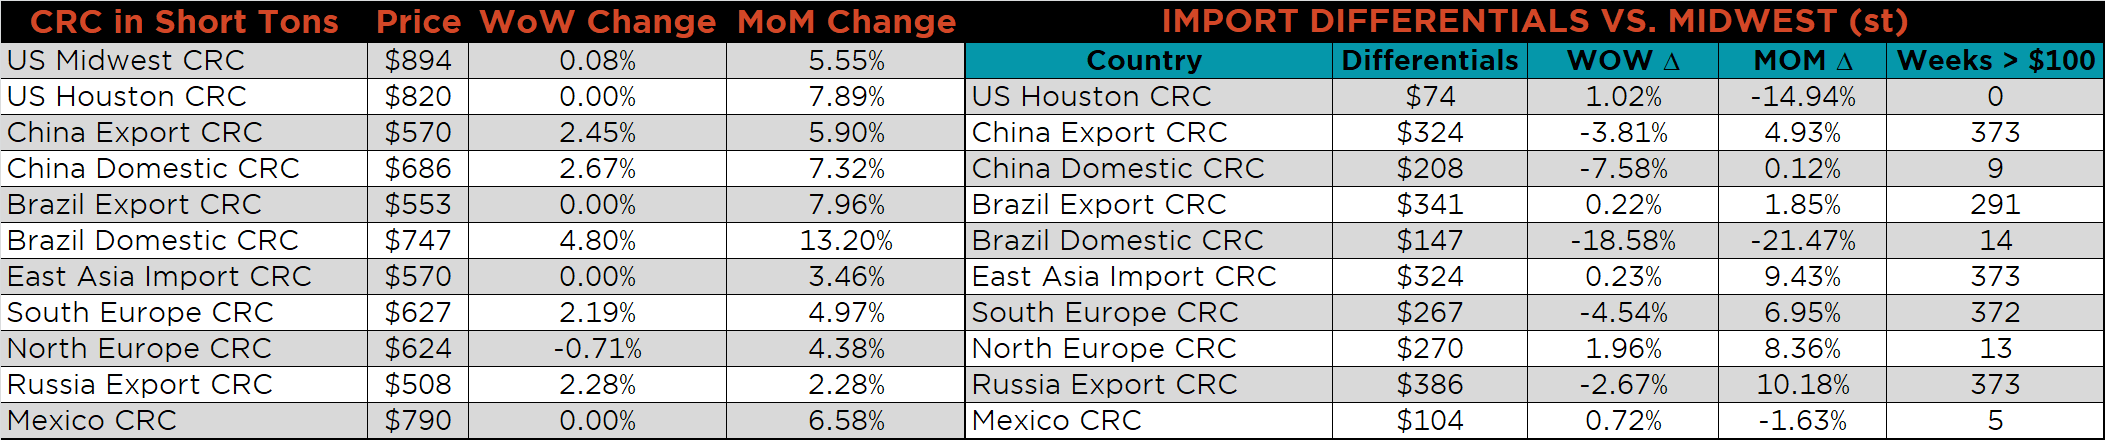
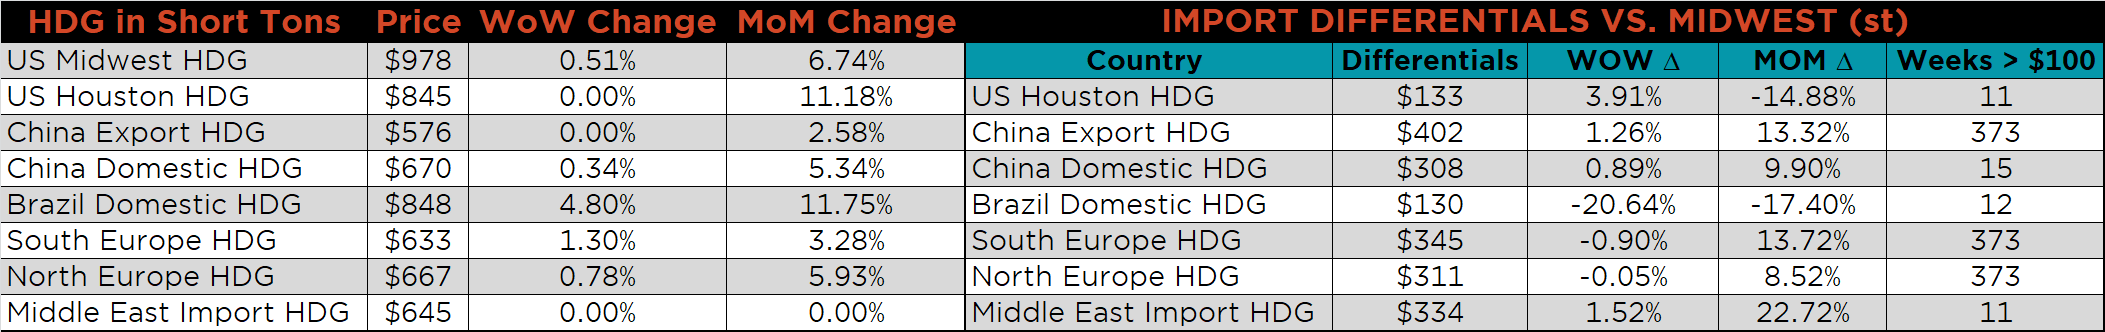
Below is the Midwest HRC price vs. each listed country’s export price using pricing from SBB Platts. We have adjusted each export price to include any tariff or transportation cost to get a comparable delivered price. All the watched differentials moved lower except for Brazil. This is the result of global prices outpacing last week’s HRC spot price increase. This is a positive signal for the current domestic rally, as it is less likely for imports to undercut domestic prices.
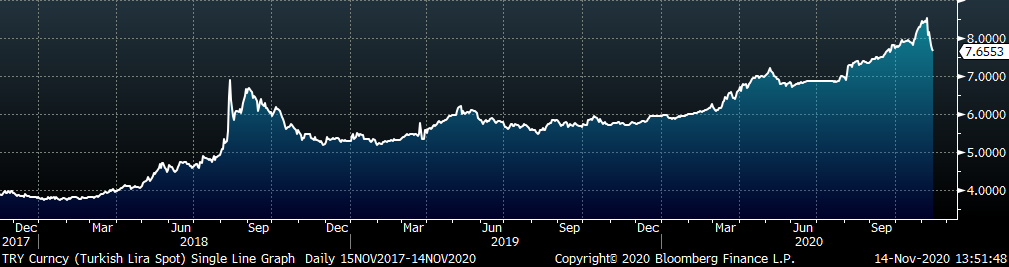
SBB Platt’s HRC, CRC and HDG pricing is below. The Midwest HRC, HDG and CRC prices were up 1.4%, 0.5% and 0.1%, respectively. Globally, the Turkish HRC price was up, 6.6%.
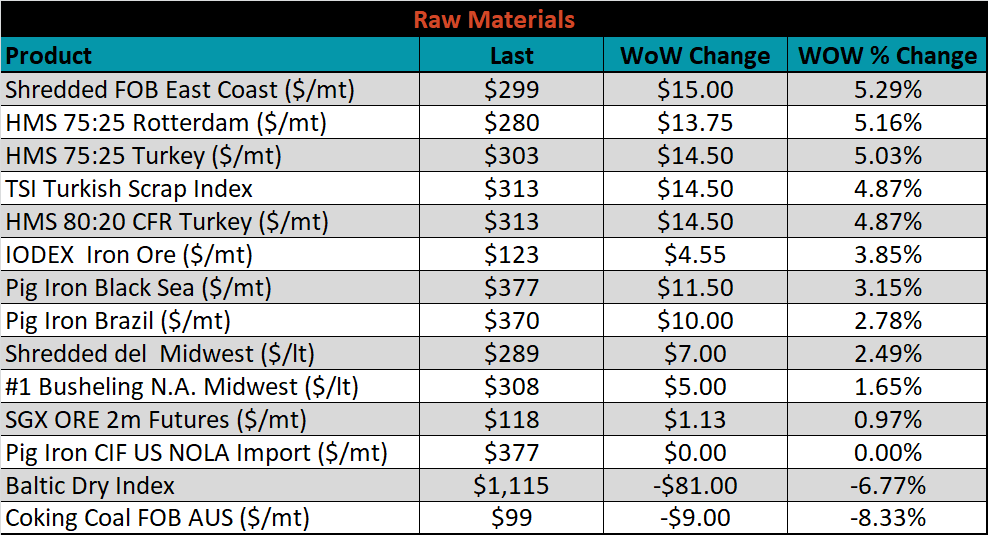
Raw material prices were mixed. East Coast shredded was up 5.3%, while Aussie coking coal was down 8.3%.
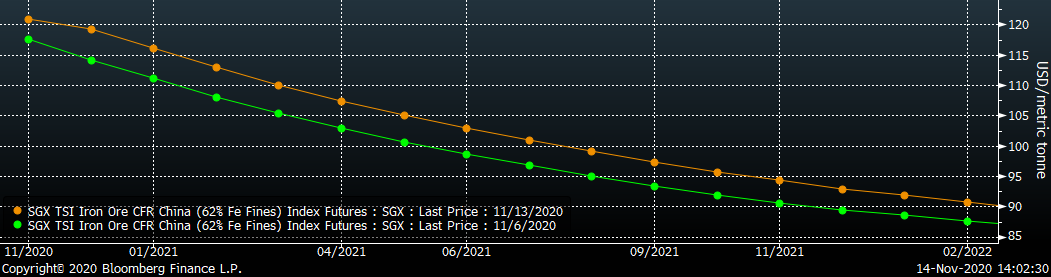
Below is the iron ore future curve with Friday’s settlements in orange, and the prior week’s settlements in green. Last week, the curve shifted higher across all expirations.
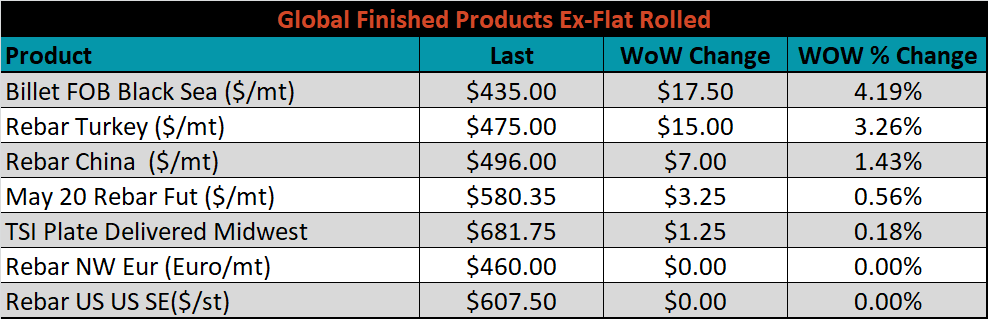
The ex-flat rolled prices are listed below.

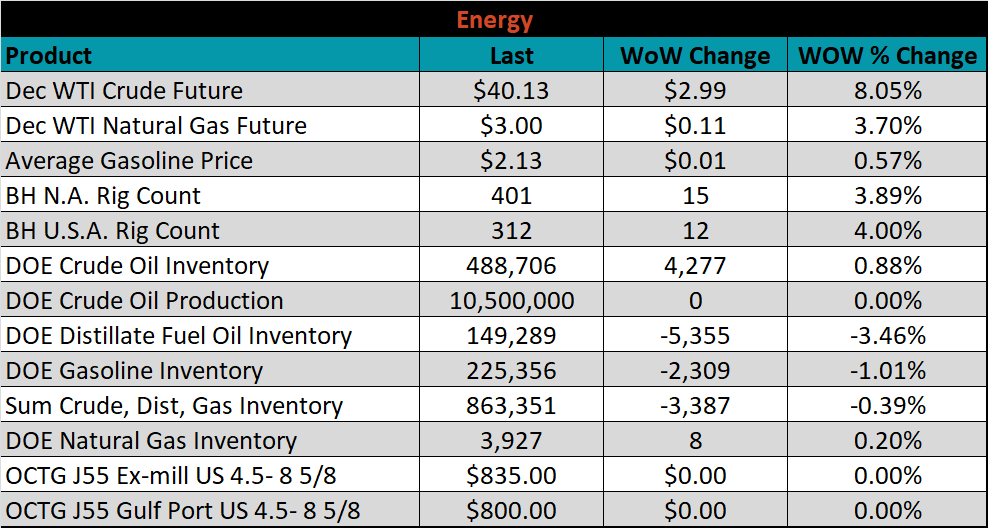
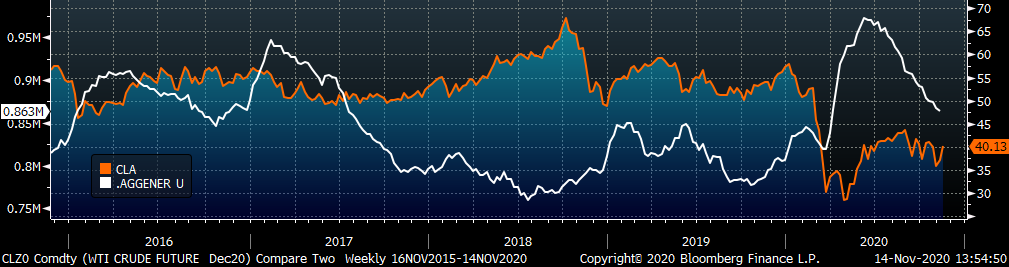
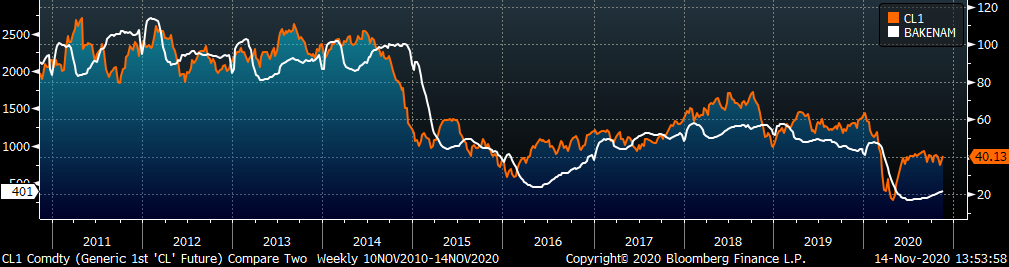
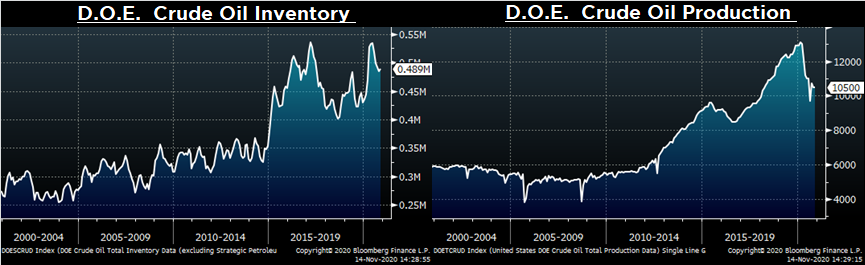
Last week, the December WTI crude oil future gained $2.99 or 8.1% to $40.13/bbl. The aggregate inventory level was down 0.4%, while crude oil production remains at 10.5m bbl/day. The Baker Hughes North American rig count was up 15 rigs and U.S. rig counts was up 12 rigs.
The list below details some upside and downside risks relevant to the steel industry. The orange ones are occurring or look to be highly likely. The upside risks look to be in control.
Upside Risks:
Downside Risks: