Content
-
Weekly Highlights
- Market Commentary
- Risks


After two price increase announcements from the mills and another expected soon, spot HRC prices have moved higher. Now the question is can the rally be sustained, or is this a dead cat bounce? In looking for an answer to this question, we will focus on the demand side of the marketplace.
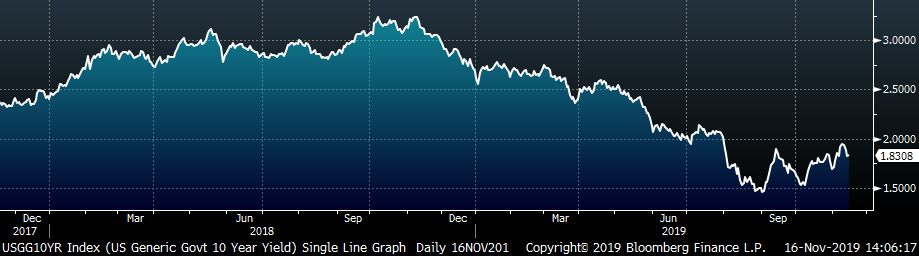
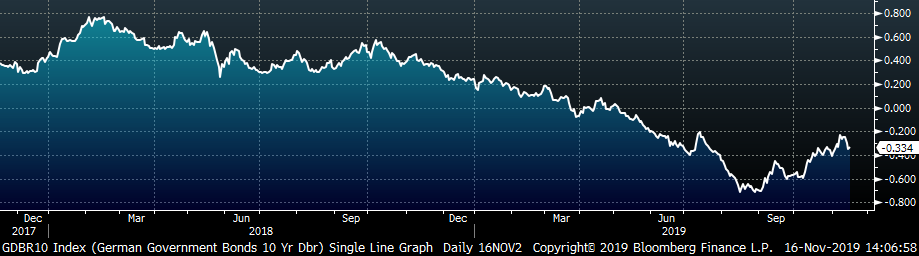
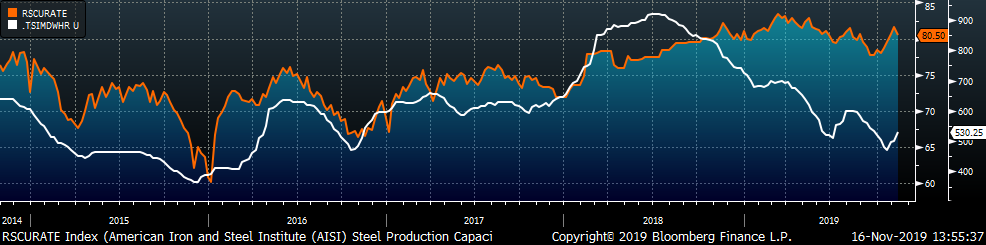
While the majority of steel pricing outlook discussions focus on the mills, economic outlook and end user demand play an equally, if not more, important roll. The chart below compares the US 10 Year bond yield to the TSI Platts Midwest HRC Index over the last 9 years.
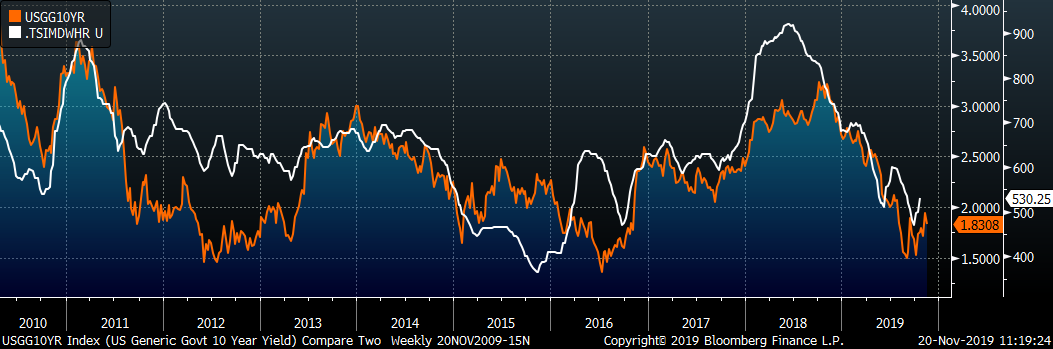
The 10 Year yield is a barometer of economic demand and expected growth, and yields tend to rise when economic conditions are improving. Generally, the spot HRC price moves in tandem with the US 10 Year yield, especially in the last year with the large decline in yield and HRC price happening simultaneously. As we saw, demand in the U.S. manufacturing sector declined significantly during this period from the high levels of 2018. Yields have moved higher from their recent lows in September/October, just as the HRC price has bounced off its recent bottom.
Looking forward, the sustainability and follow through of the recent price increase announcements hinges on higher prices spurring restocking within the supply chain. Service centers and end users will only be willing to pay these higher prices into next year if they have confidence that the economy and the manufacturing sector will improve. The Federal Reserve has reduced the Fed Funds Rate this year, which can help encourage this needed demand through lowering borrowing costs.
Interestingly, the mills are pushing increases and hoping for restocking into the fourth quarter, when service center shipments and inventories usually decline. This leads to fewer tons being placed at domestic producers, reducing the mills’ pricing power. Therefore, it seems that the demand outlook will have to drastically improve in order to support higher prices anytime soon. Focus on indicators of manufacturing demand, such as the 10 Year yield, for guidance on price outlook.
Below are the most pertinent upside and downside price risks:
Upside Risks:
Downside Risks:
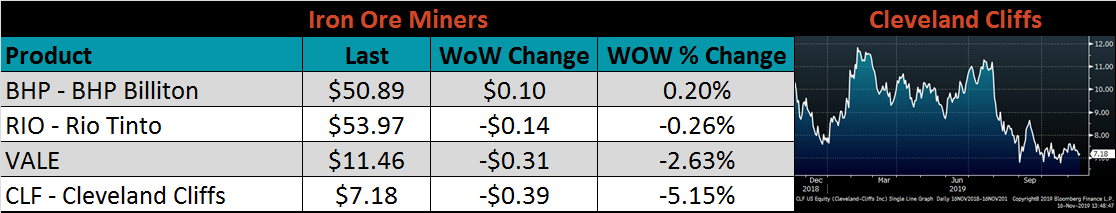
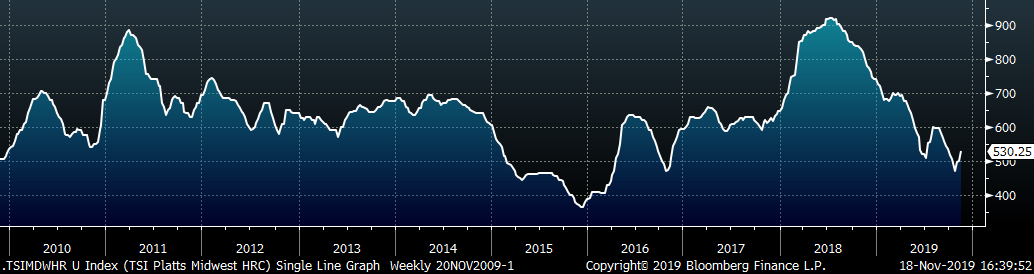
The Platts TSI Daily Midwest HRC Index was up $30.75 to $530.25.
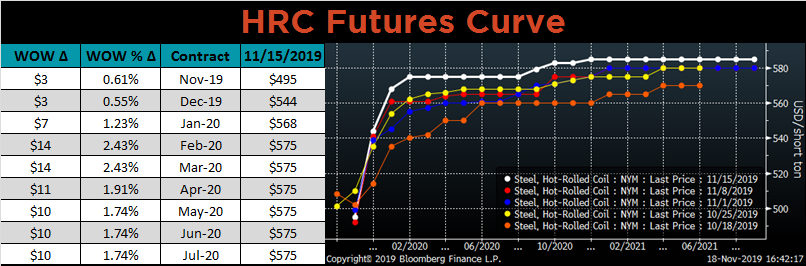
The CME Midwest HRC futures curve is below with last Friday’s settlements in white. The curve shifted higher for all expirations after November’s and is flat around the $575 level for 2020.
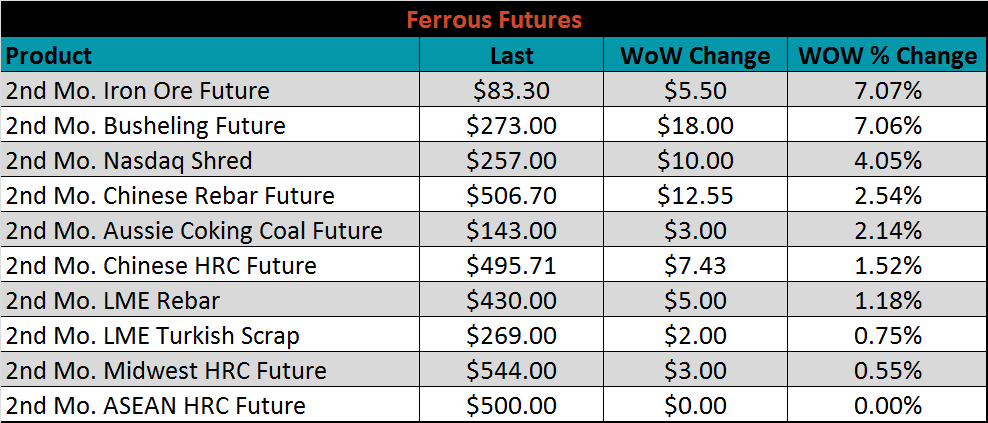
December ferrous futures were higher. The iron ore future and the busheling future both gained 7.1%.
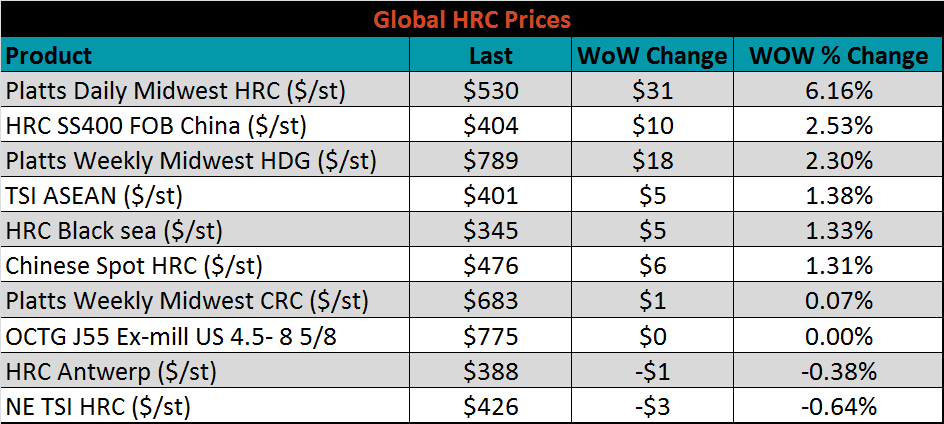
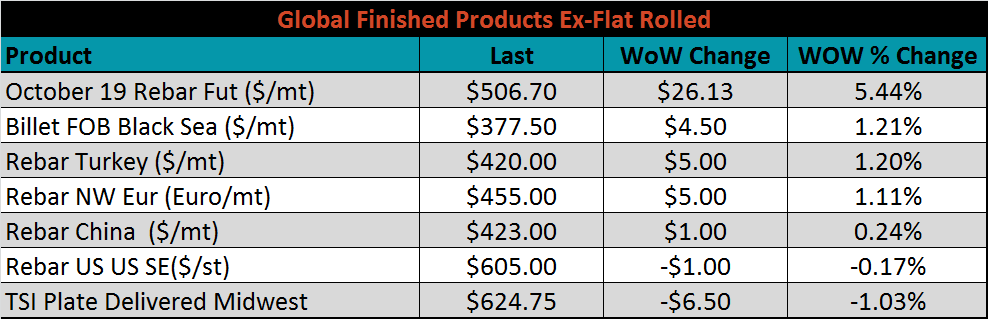
The global flat rolled indexes were mostly higher. Midwest TSI HRC was up 6.2%, while Northern European TSI HRC was down 0.6%.
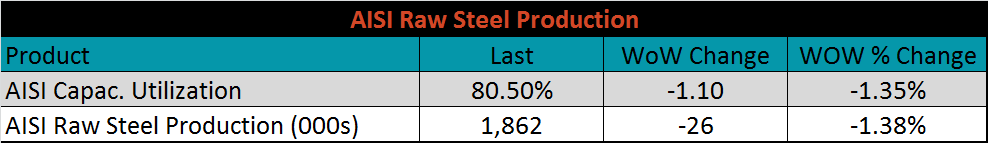
The AISI Capacity Utilization Rate was down 1.1% to 80.5%. This is the first decrease in five weeks, but capacity utilization remains above the 80% goal set by the Trump administration. Further declines in production will be supportive of prices.
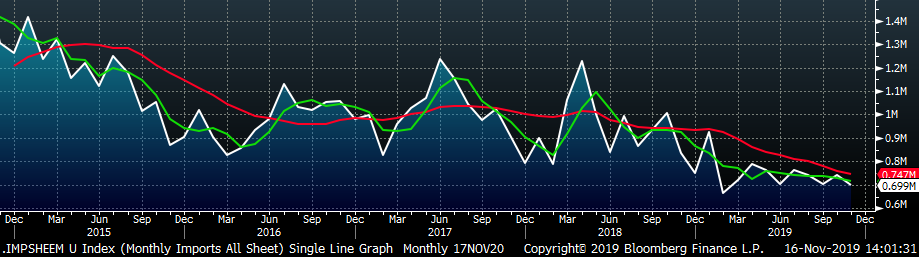
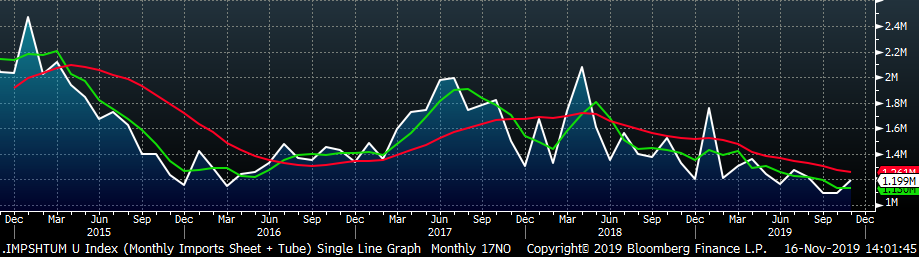
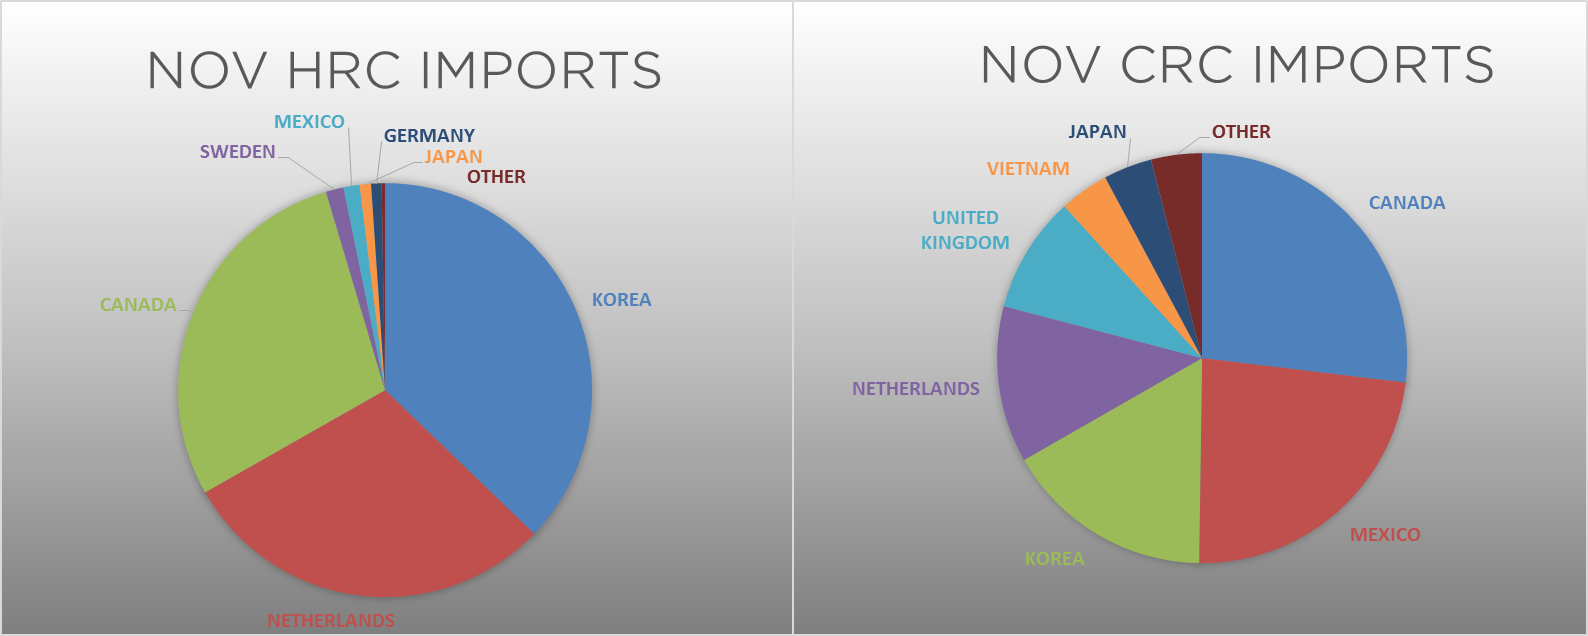
November flat rolled import license data is forecasting a decrease of 44k to 699k MoM.
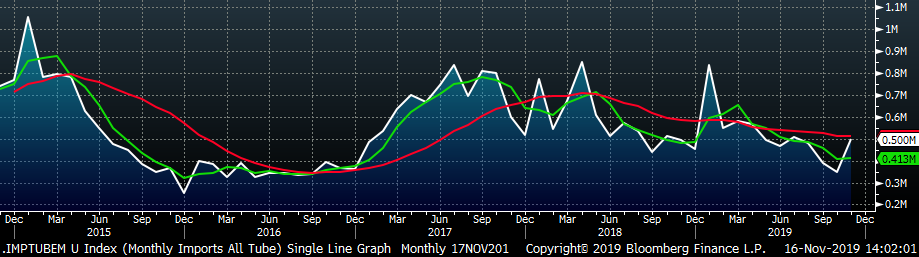
Tube imports license data is forecasting a MoM increase of 149k to 500k tons in November after declining over the last three months.
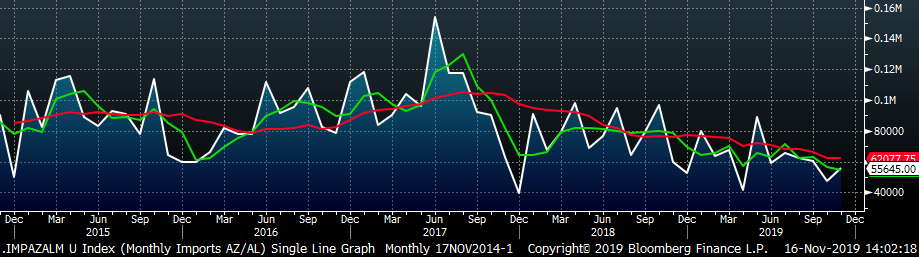
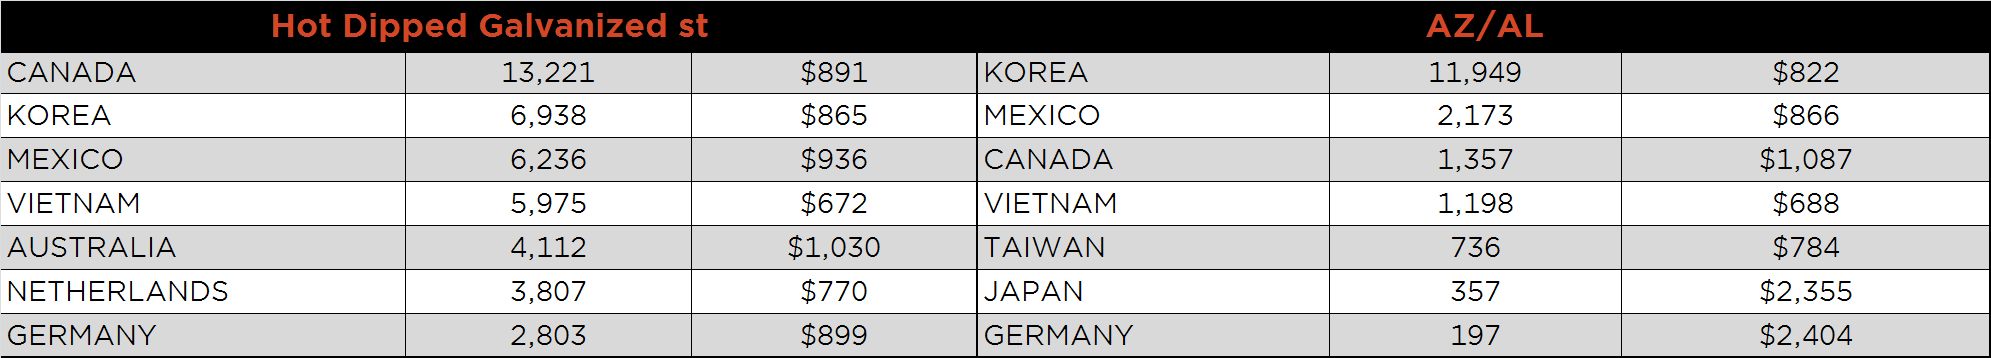
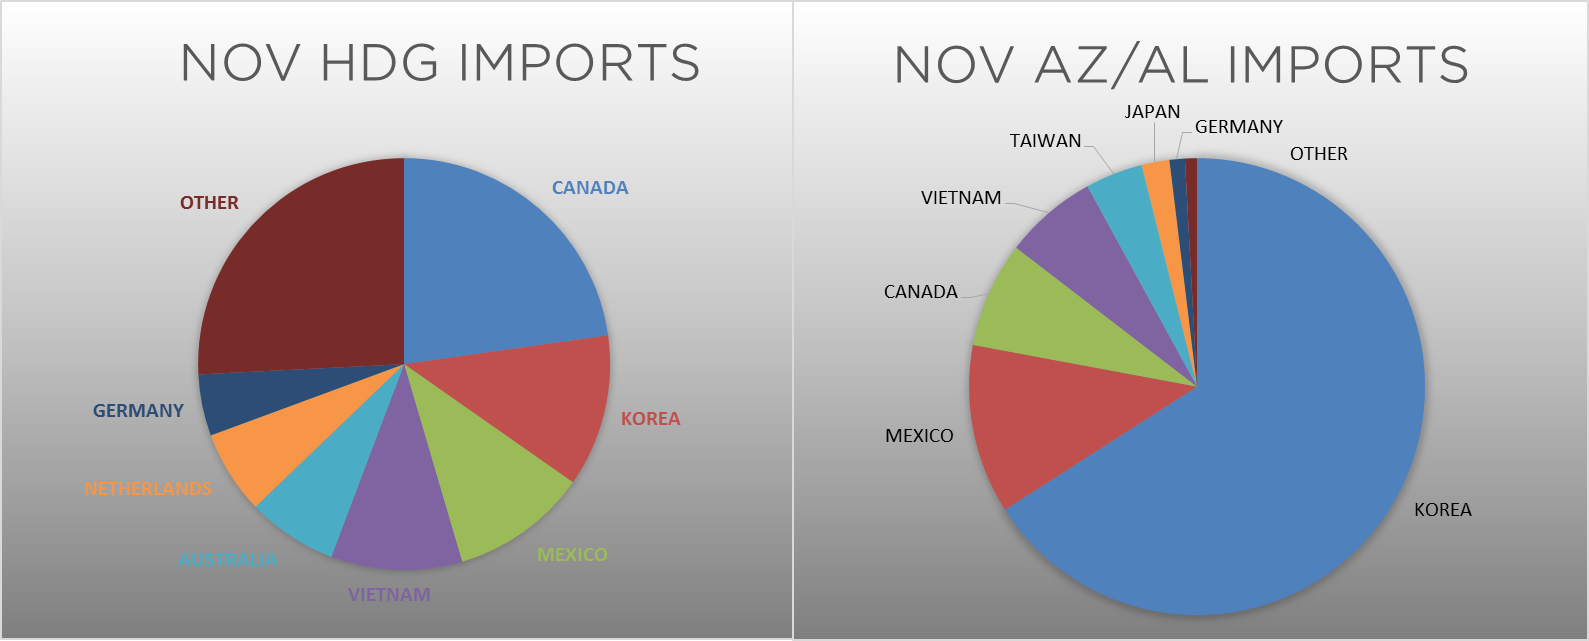
AZ/AL import license data is forecasting an increase of 8k in November to 56k.
Below is October import license data through November 12, 2019.
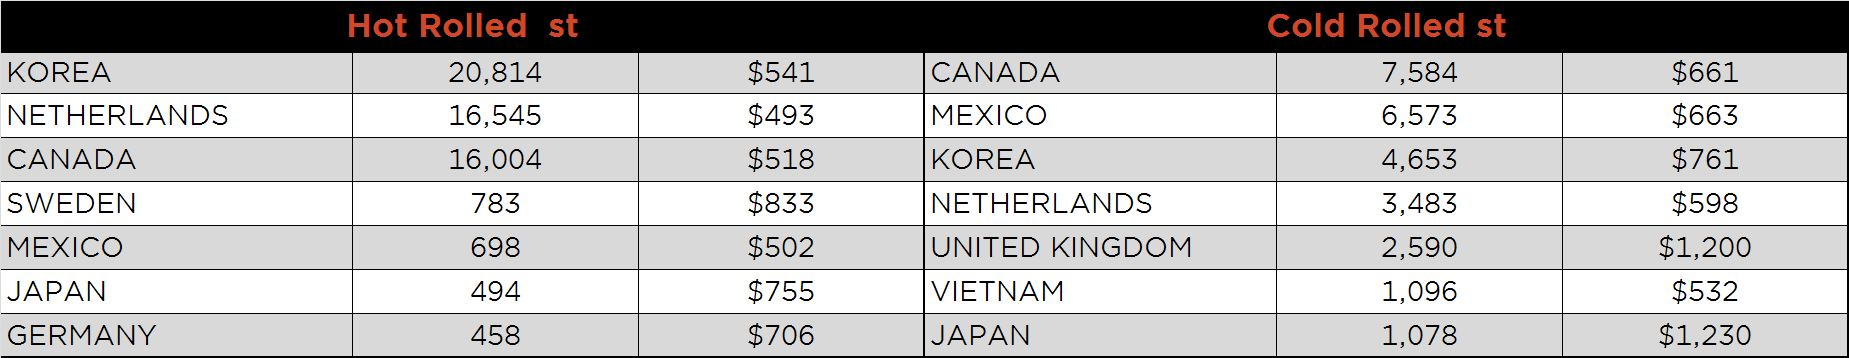
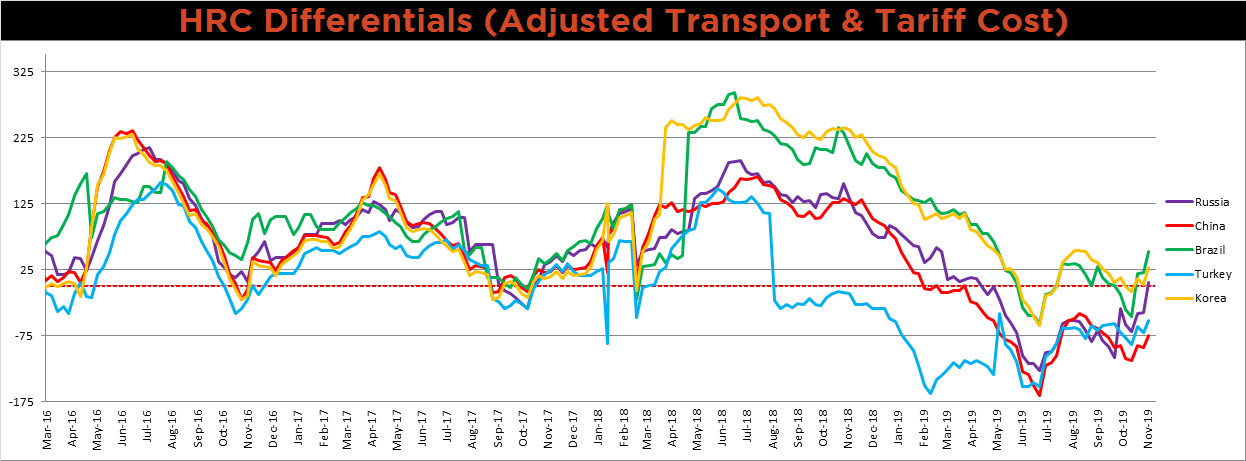
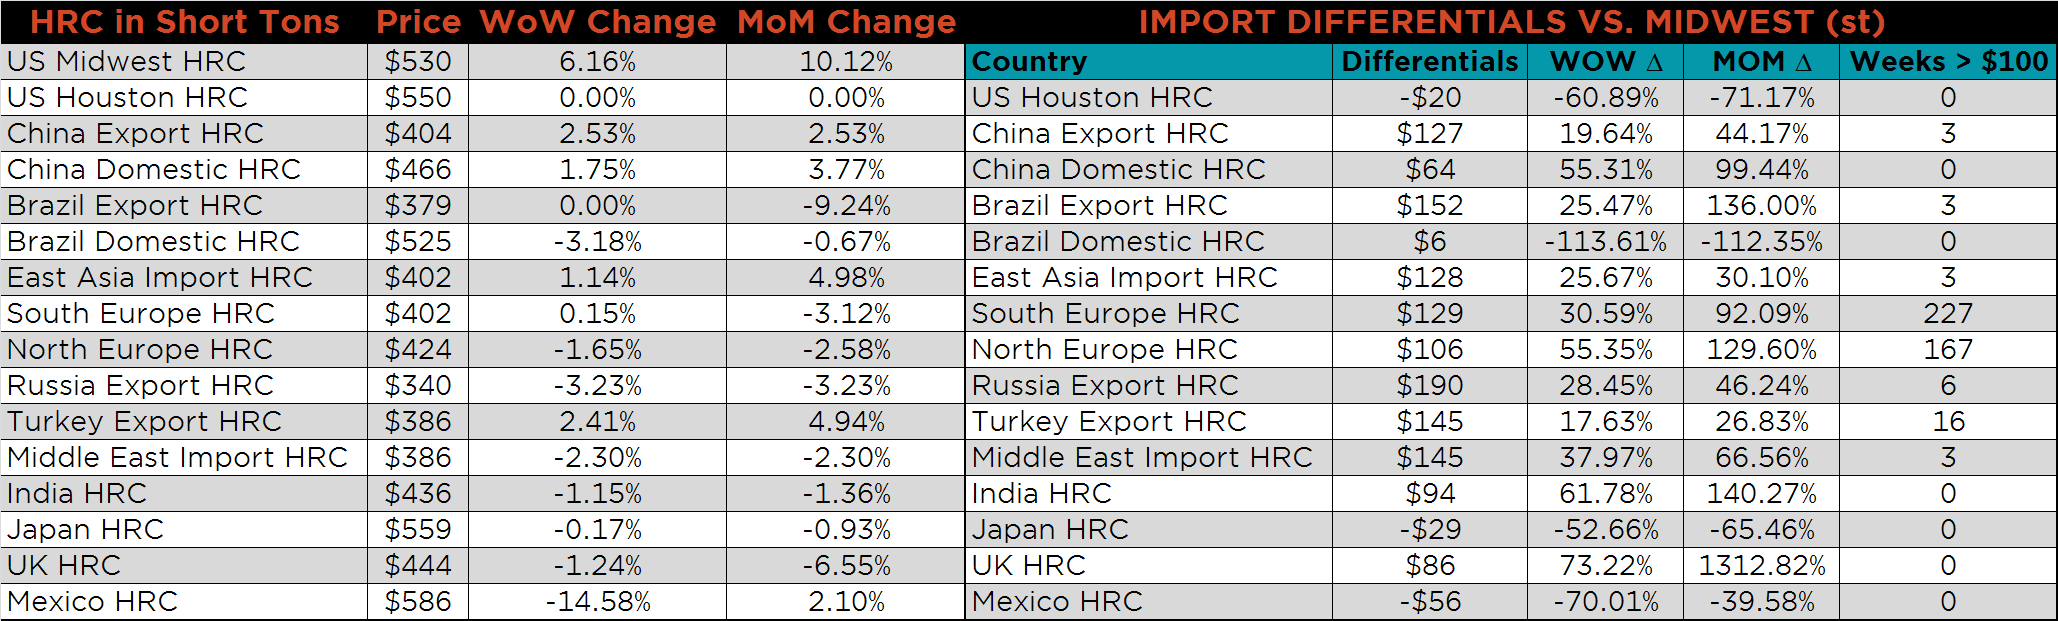
Below is the Midwest HRC price vs. each listed country’s export price using pricing from SBB Platts. We have adjusted each export price to include any tariff or transportation cost to get a comparable delivered price. The significant WoW increase in the Midwest HRC price pushed all the global differentials higher.
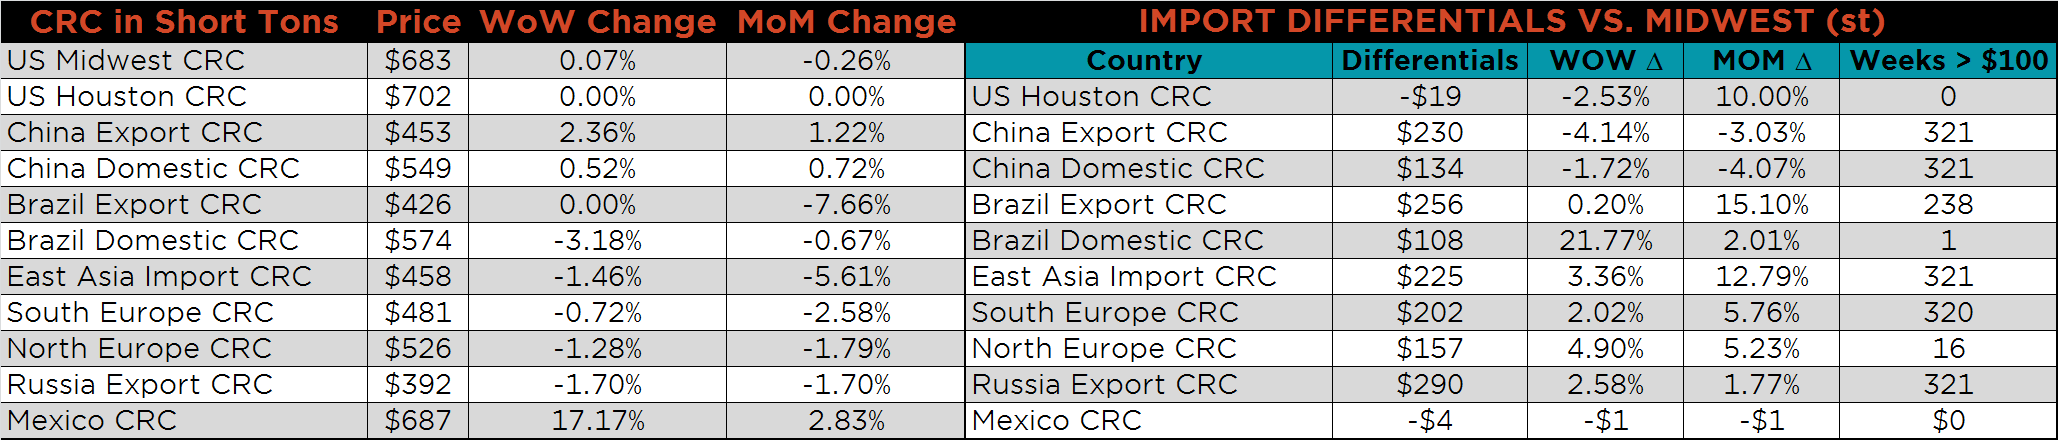
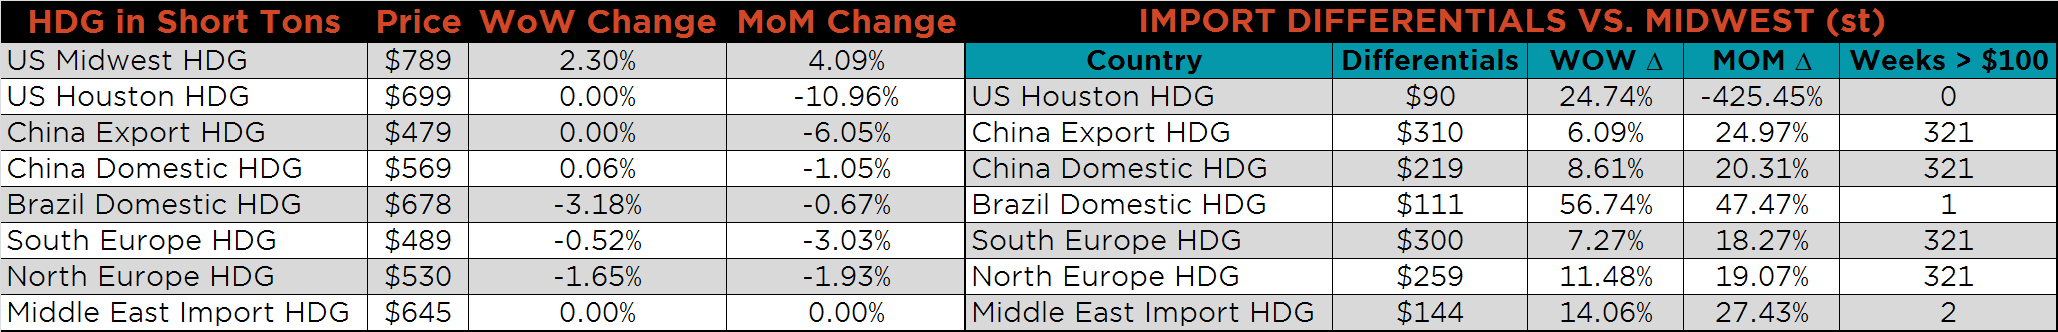
SBB Platt’s HRC, CRC and HDG pricing is below. The Midwest HRC and HDG prices were up 6.2% and 2.3%, respectively, while the CRC price rose only slightly. Globally, the Russian HRC export price was down 3.2%, while the Chinese and Turkish HRC export prices were up, 2.5% and 2.4%, respectively.
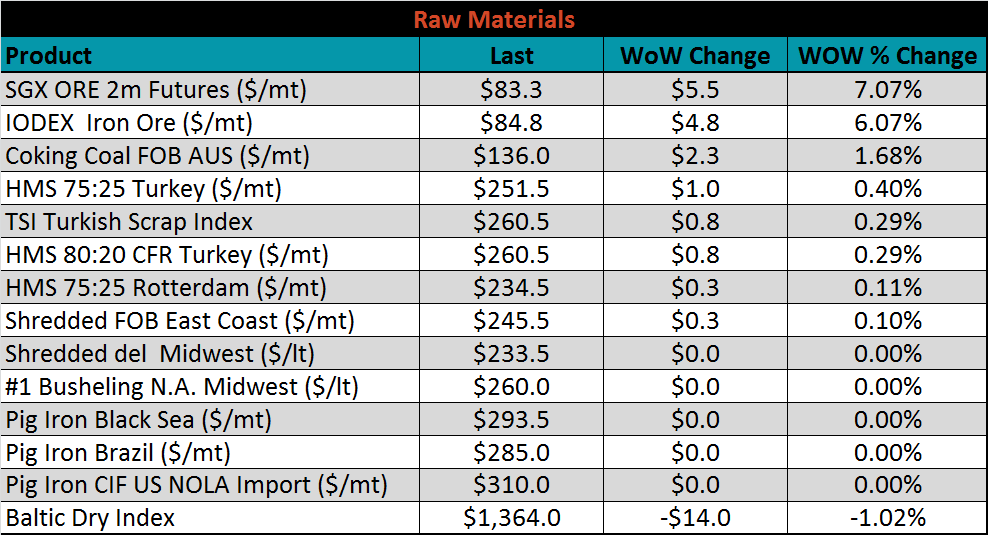
Raw material prices were mostly higher, led by the SGX ore futures, which gained 7.1%.
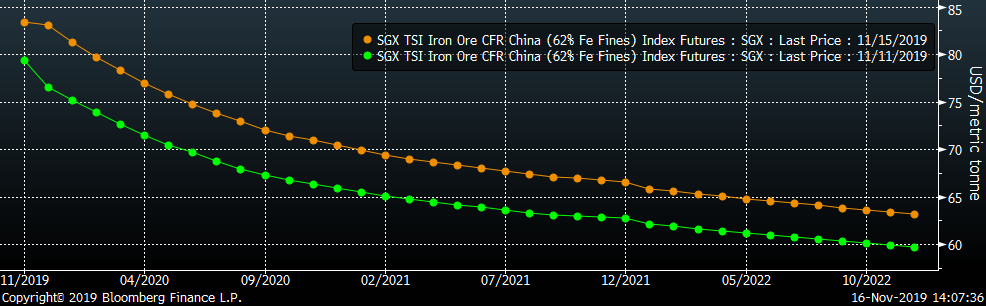
Below is the iron ore future curve with Friday’s settlments in orange, and the prior week’s settlements in green. The curve shifted higher across all expirations, most significantly in the front.
The ex-flat rolled prices are listed below.

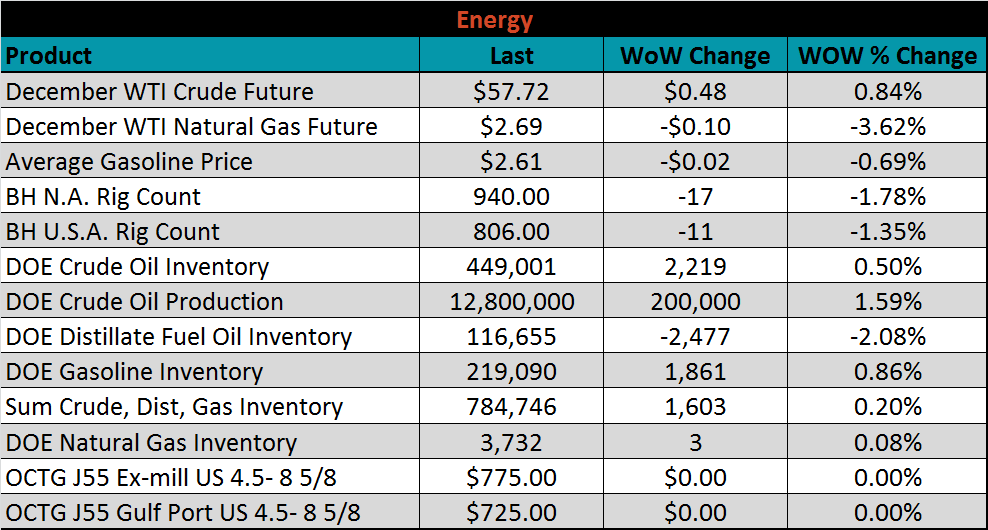
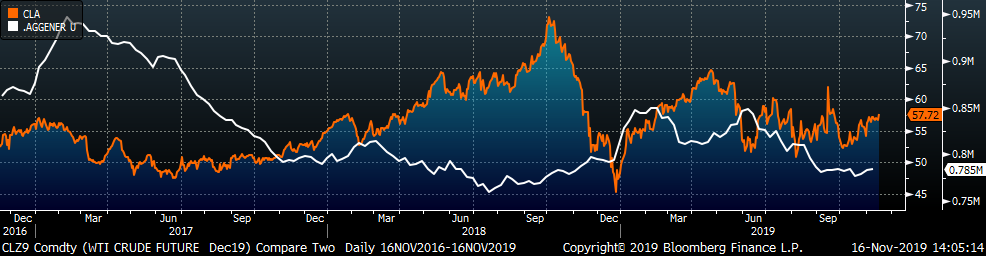
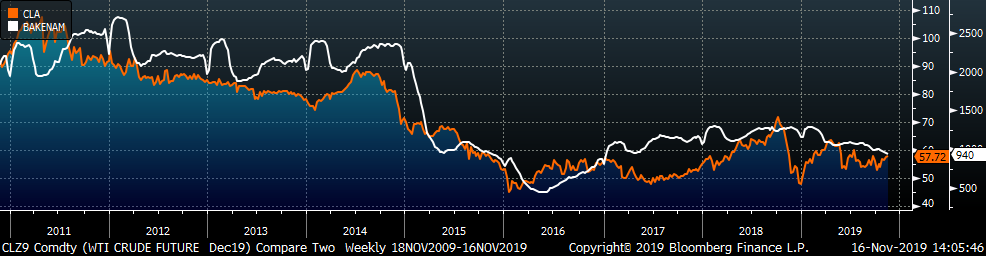
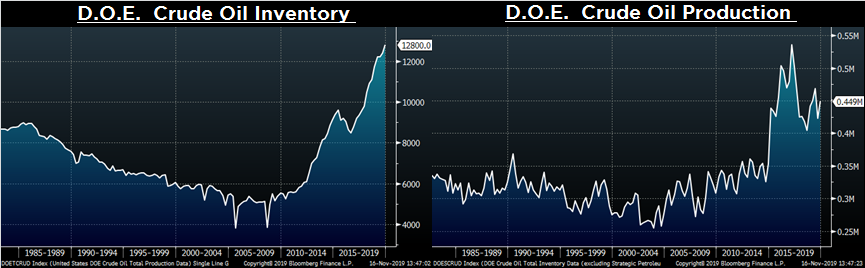
Last week, the December WTI crude oil future gained another $0.48 or 0.8% to $57.72/bbl. The aggregate inventory level was up 0.2%, while crude oil production rose to 12.8m bbl/day. The Baker Hughes North American rig count lost seventeen rigs, while the U.S. count lost eleven.
The list below details some upside and downside risks relevant to the steel industry. The orange ones are occurring or look to be highly likely. The upside risks look to be in control.
Upside Risks:
Downside Risks: