Content
-
Weekly Highlights
- Market Commentary
- Upside & Downside Risks


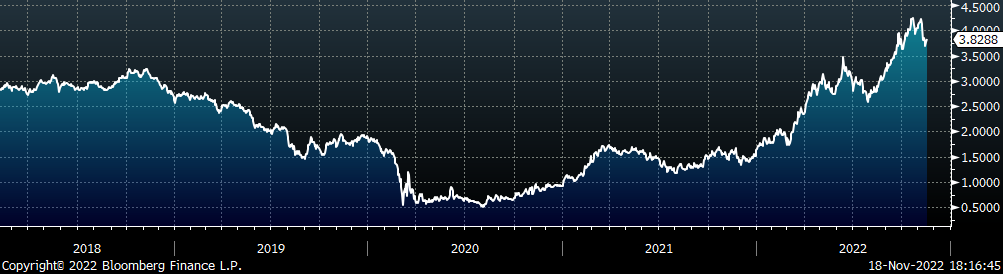
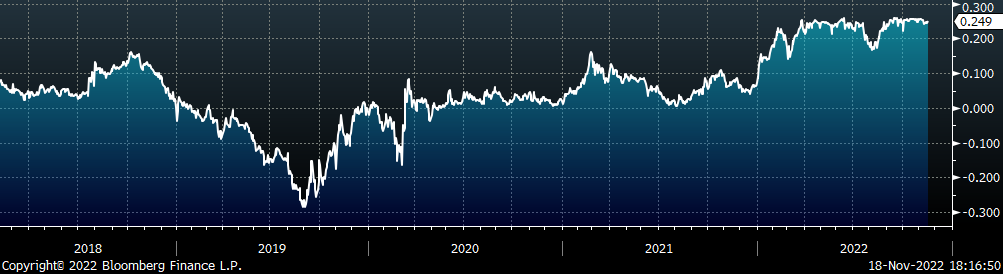
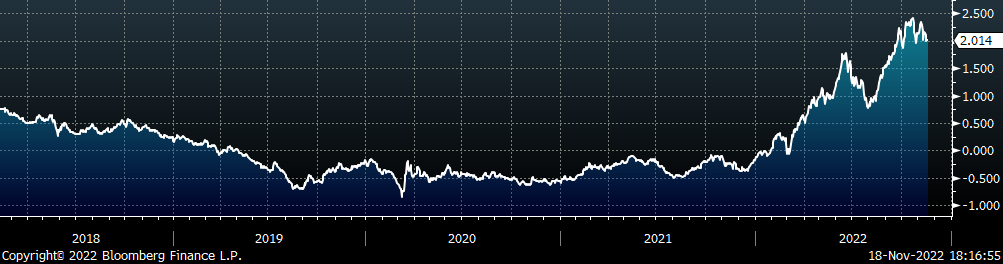
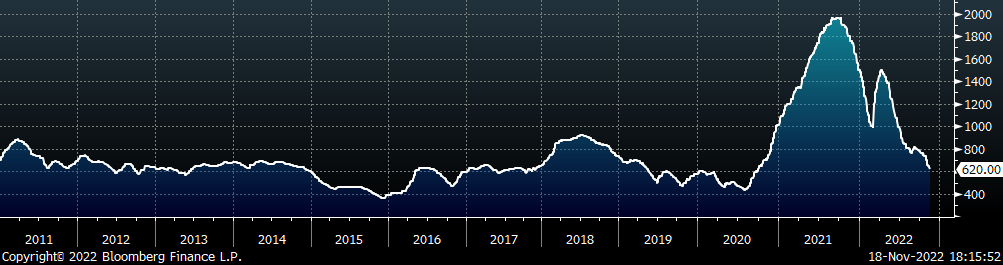
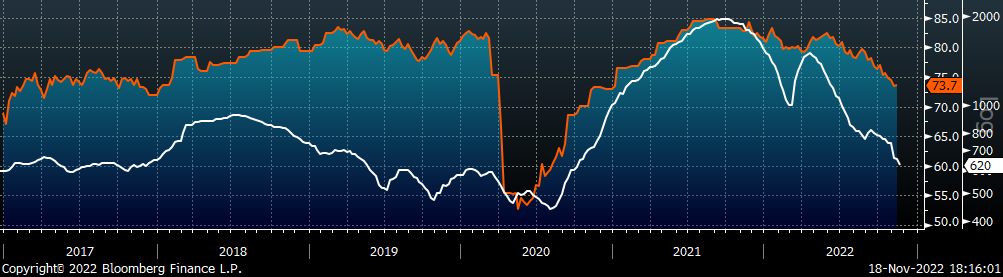
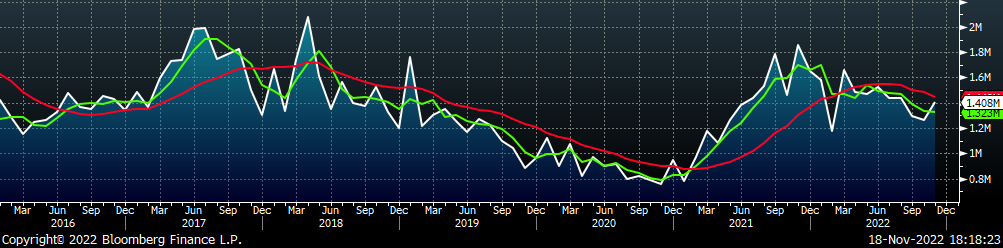
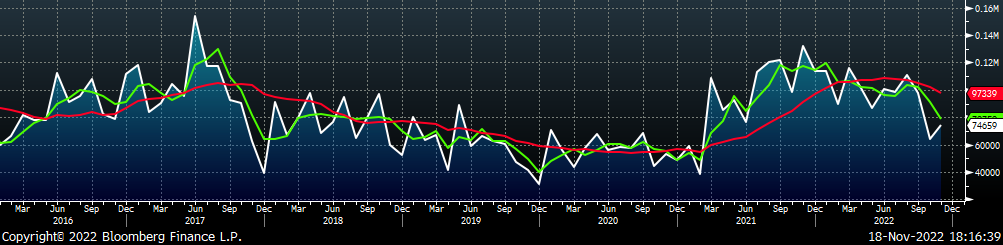
The charts below show components of the mill margin spread. On top is the 2nd month HRC future in white and the 2nd month Busheling future in orange. The second chart shows the HRC-Busheling spread in yellow.
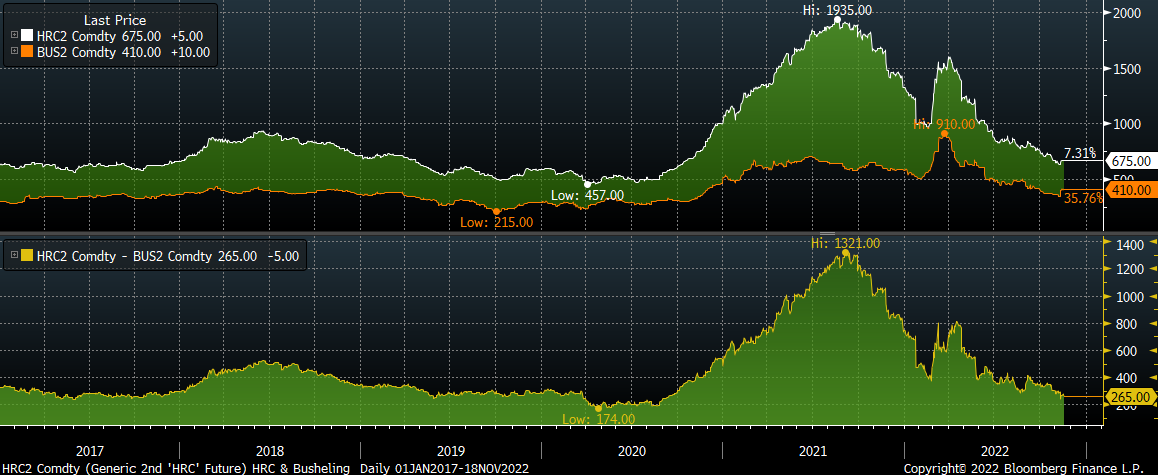
If you exclude the pandemic shutdowns and subsequent rally, the spread between the two at the current level of $265 is very low for historical standards. In the 4 years prior to the pandemic, the average of this spread was $312, and the low point in 2019 (a year which saw significant downward pressure on prices) was $251. The point here is that the downside risk to HRC prices has already materialized and at the current levels the risk to the upside is starting to be more pronounced.
Upside Risks:
Downside Risks:
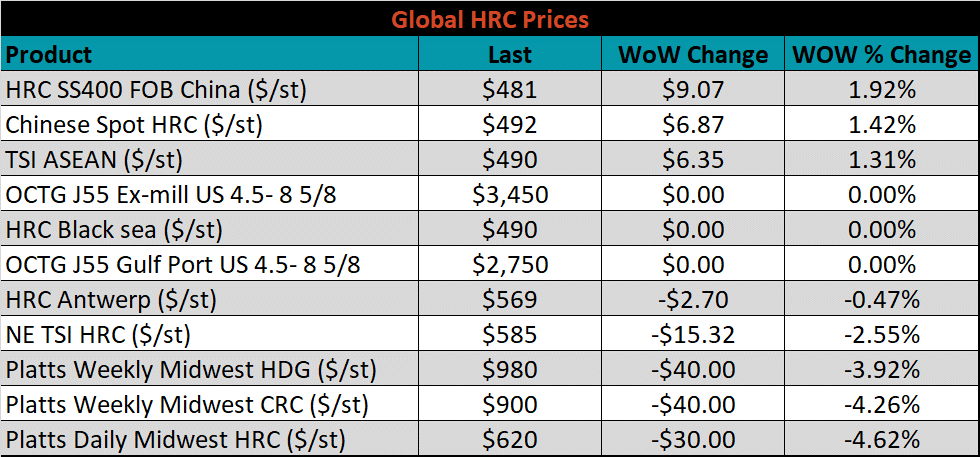
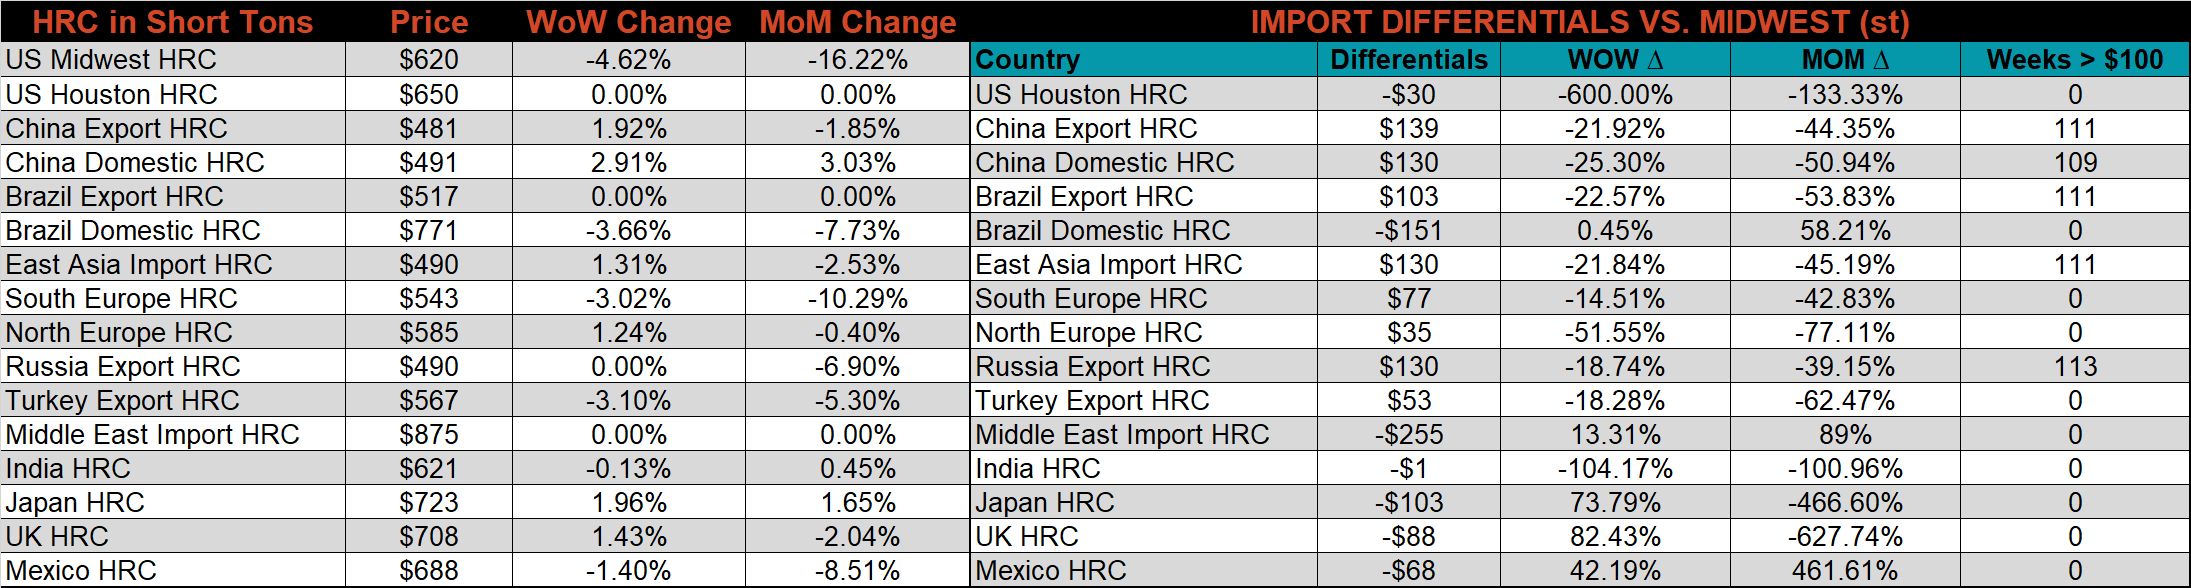
The Platts TSI Daily Midwest HRC Index was down another $30, ending at $620.
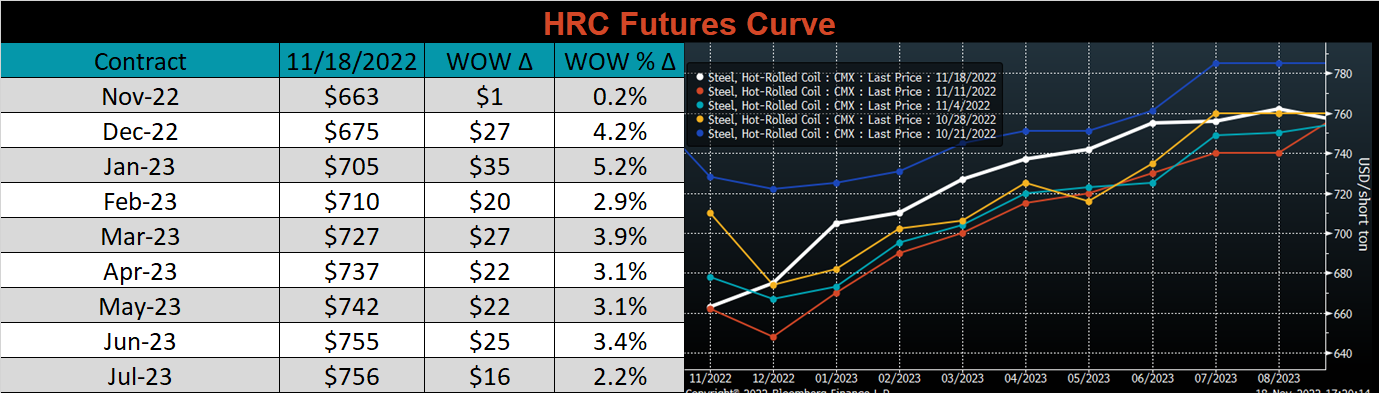
The CME Midwest HRC futures curve is below, with last Friday’s settlements in white. The forward curve increased at every expiration last week. This was the first time the entire curve shifted meaningfully higher in 10 weeks.
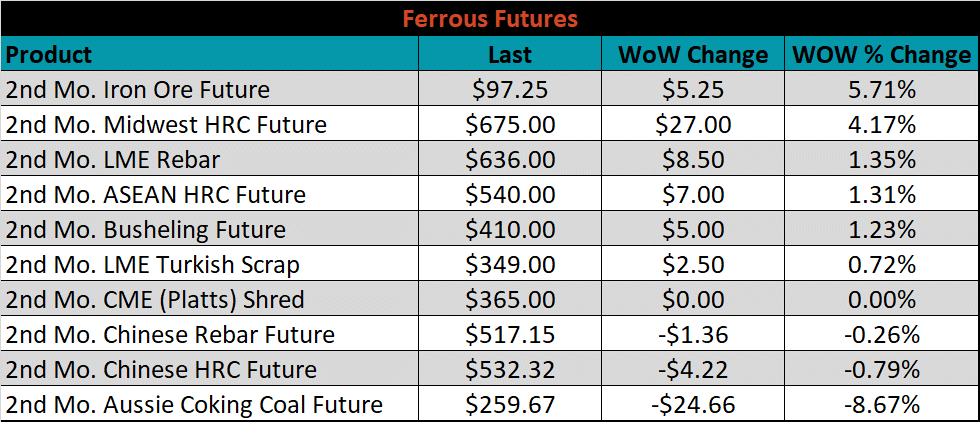
The 2nd month ferrous futures were mostly higher, led by iron ore, which gained 5.7%, while Aussie coking coal lost another 8.7%.
Global flat rolled indexes were mixed last week, with Chinese export HRC, up 1.9%, Midwest HRC was down 4.6%.
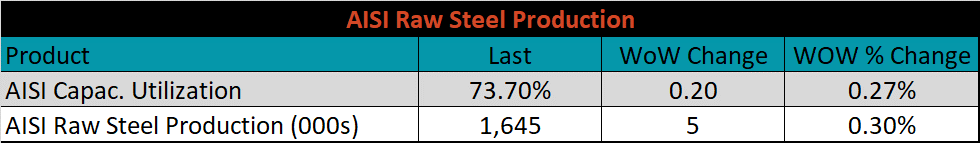
The AISI Capacity Utilization was up slightly, 0.2% to 73.7%.
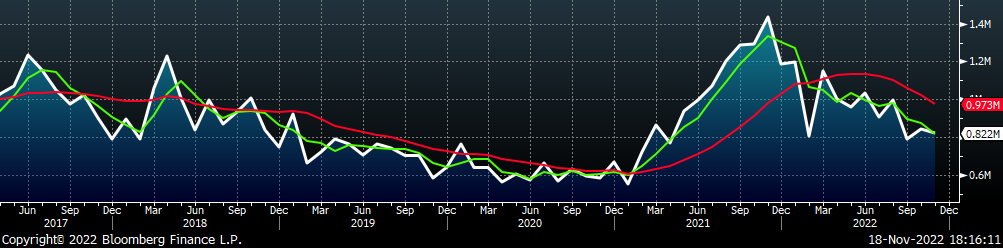
November flat rolled import license data is forecasting a decrease of 19k to 822k MoM.
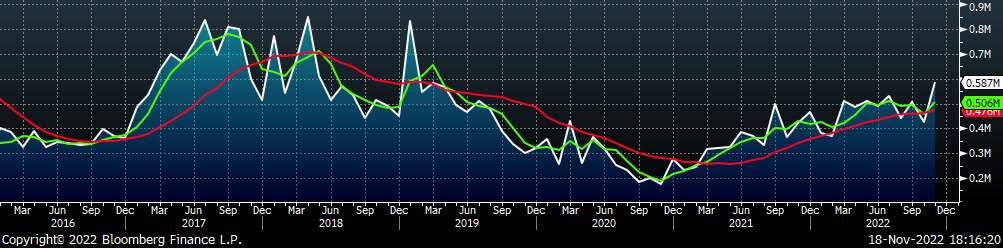
Tube imports license data is forecasting an increase of 162k to 587k in November.
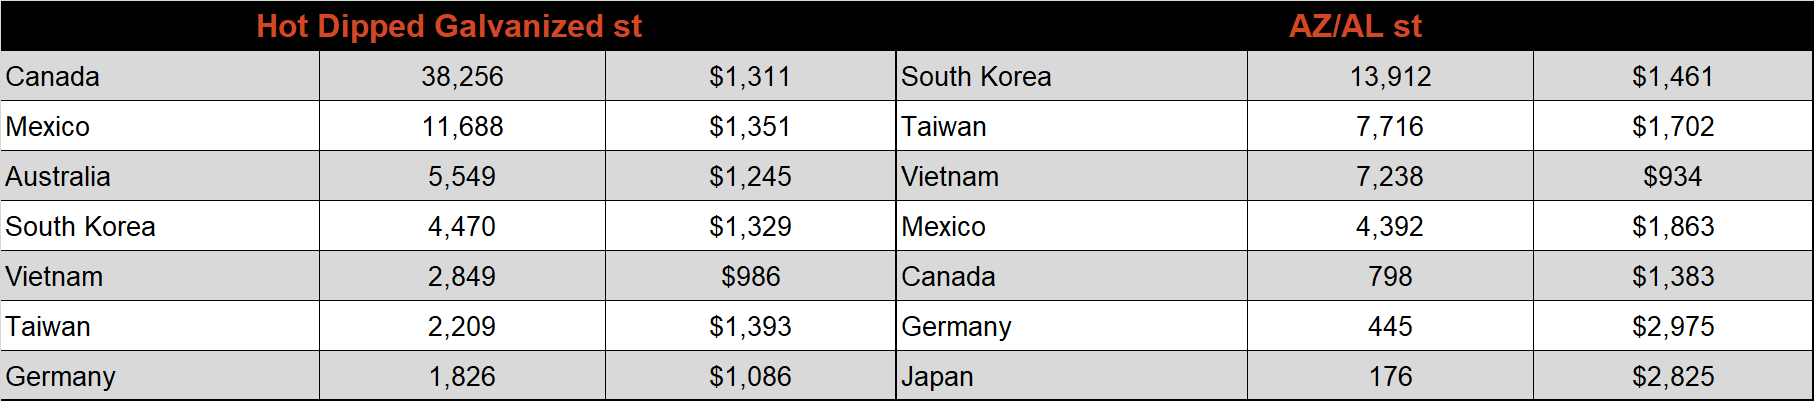
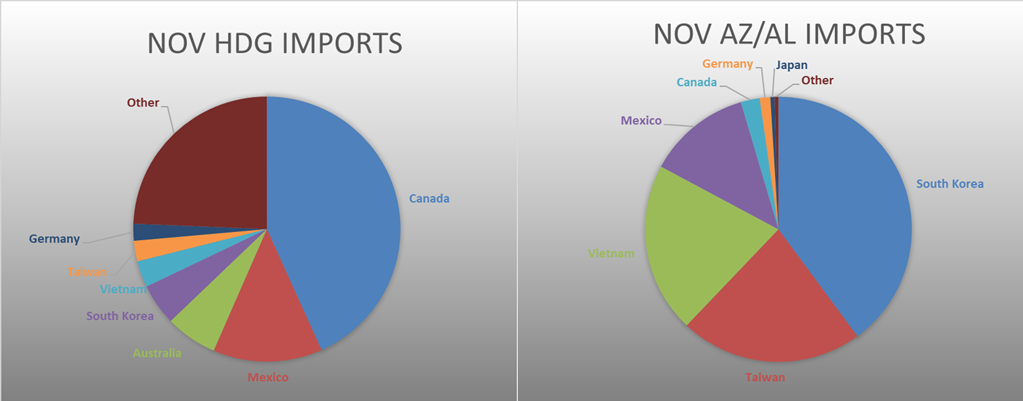
November AZ/AL import license data is forecasting an increase of 11k to 75k.
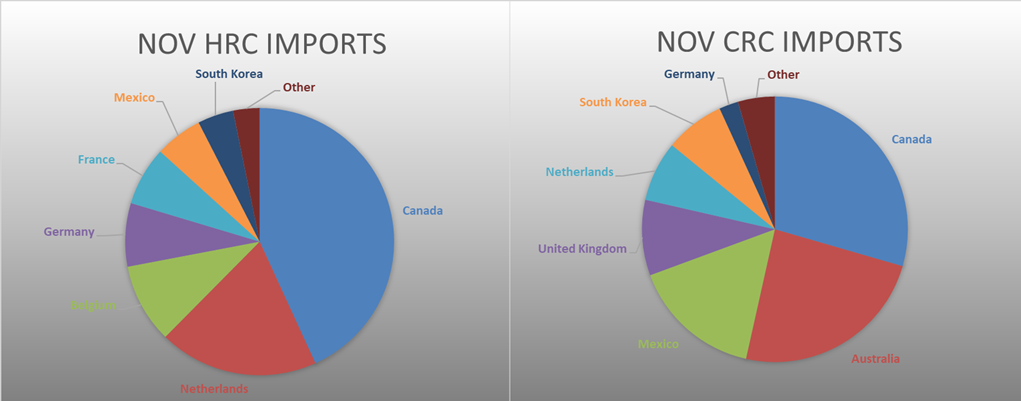
Below is November import license data through November 14th, 2022.
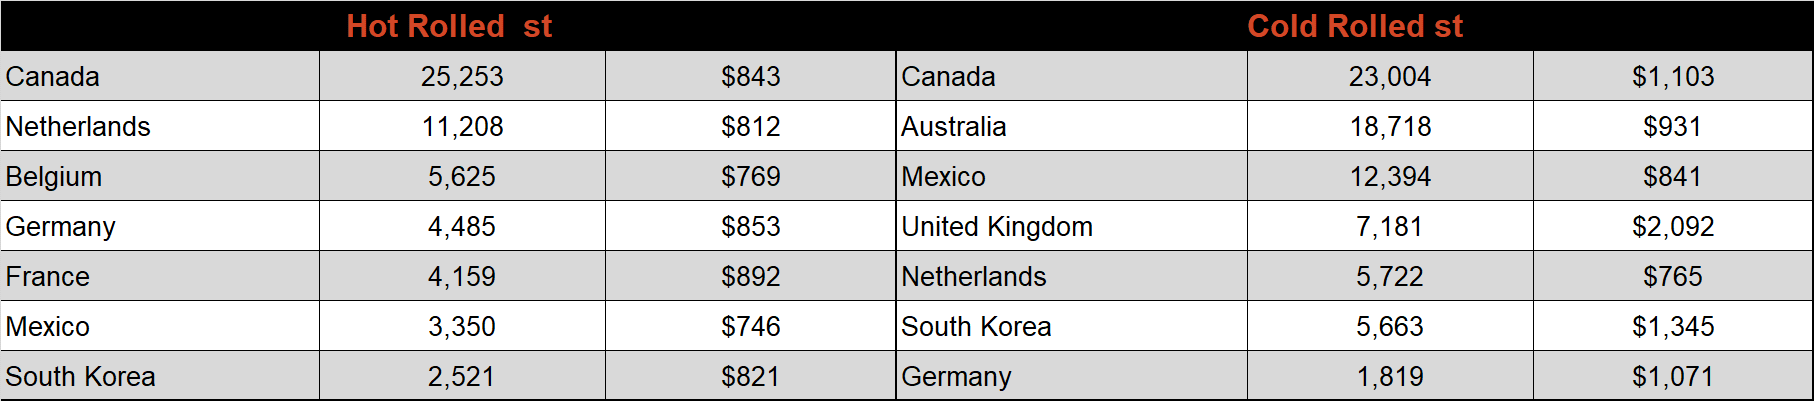
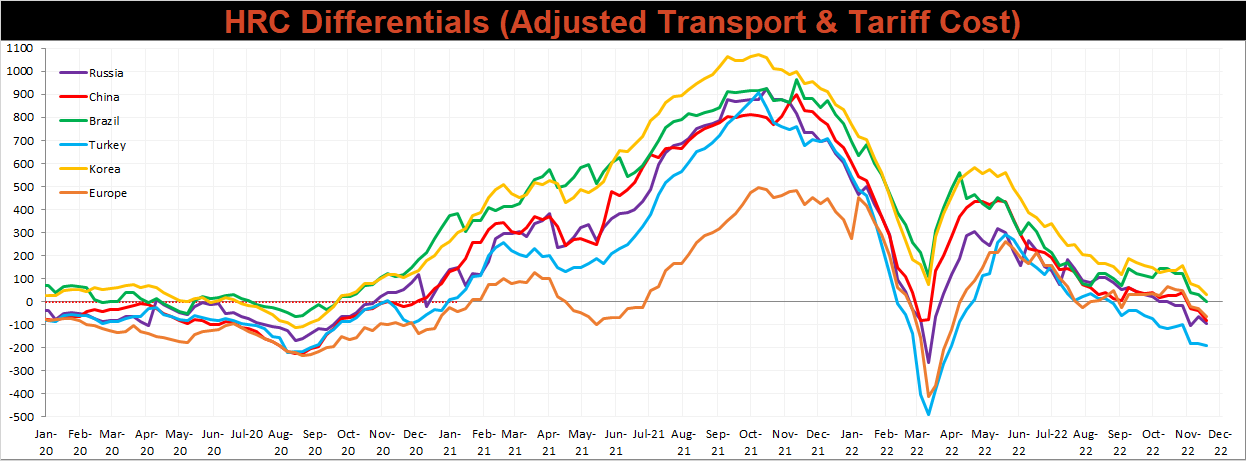
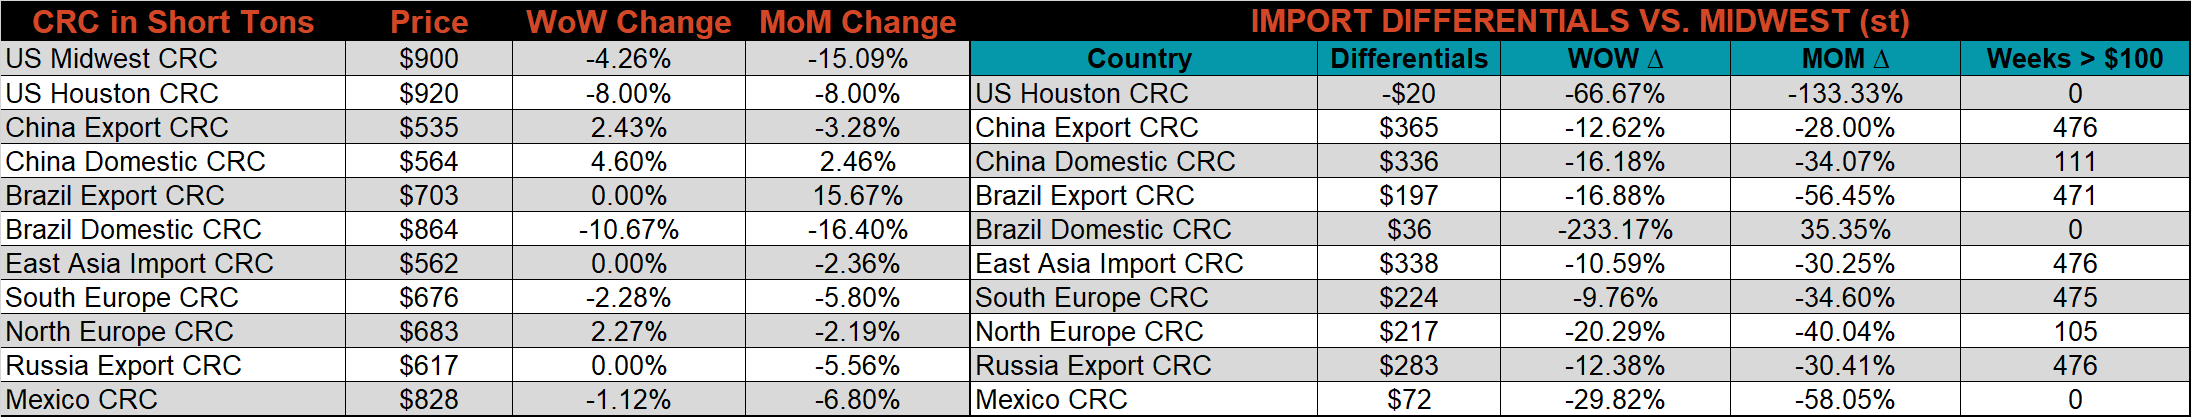
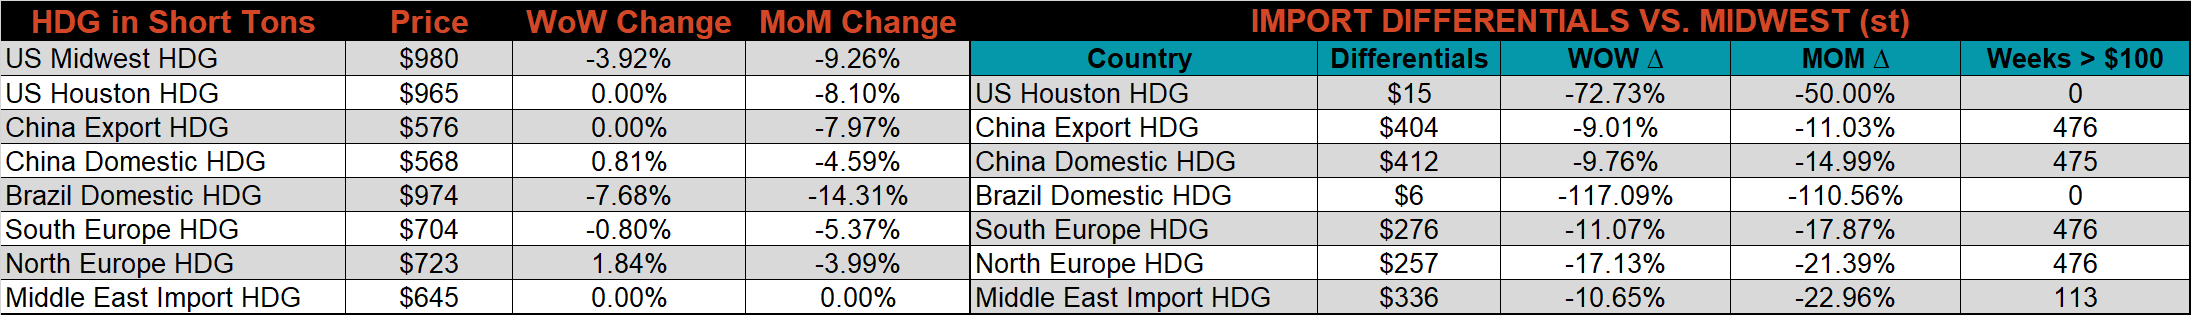
Below is the Midwest HRC price vs. each listed country’s export price using pricing from SBB Platts. We have adjusted each export price to include any tariff or transportation cost to get a comparable delivered price. All the global differentials decreased further this week as U.S. domestic prices continue to fall far more significantly than the rest of the world.
Global prices were mixed last week, with steel out of asia trending higher for the second week, led by Chinese domestic CRC, up 4.6%, while Brazilian domestic CRC was down 10.7%.
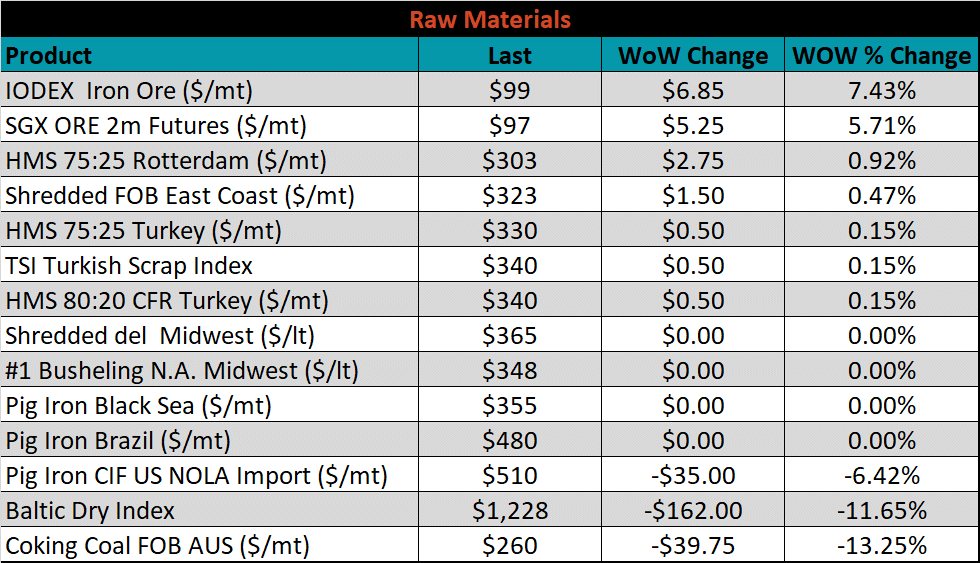
Raw material prices were mixed again this week, with Aussie coking coal continuing to fall, down another 13.3%, while the IODEX iron ore index was up 7.4%.
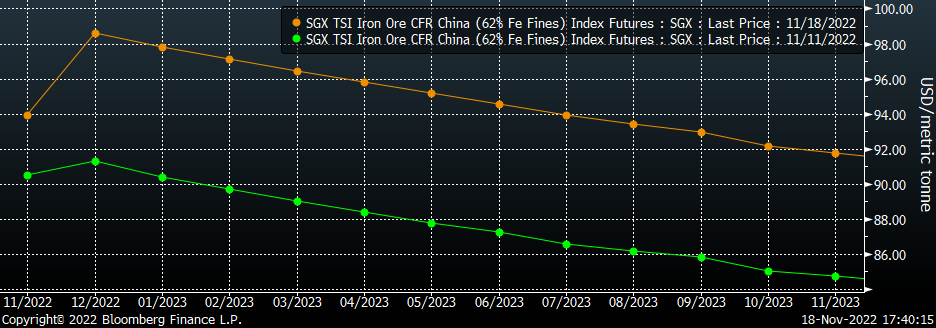
Below is the iron ore future curve with Friday’s settlements in orange, and the prior week’s settlements in green. Iron ore rallied significantly again last week across all expirations.
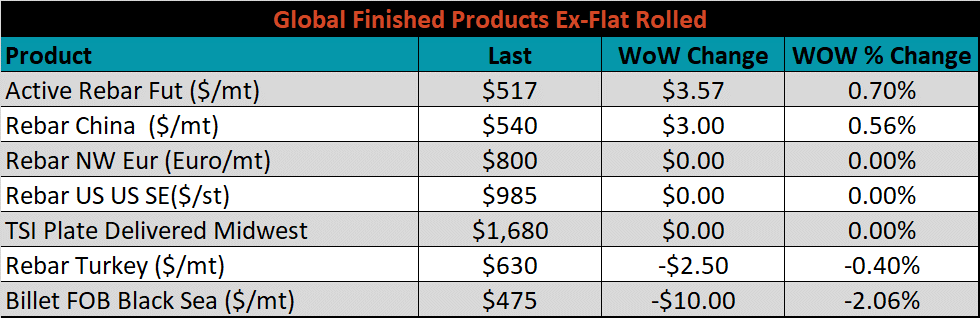
The ex-flat rolled prices are listed below.

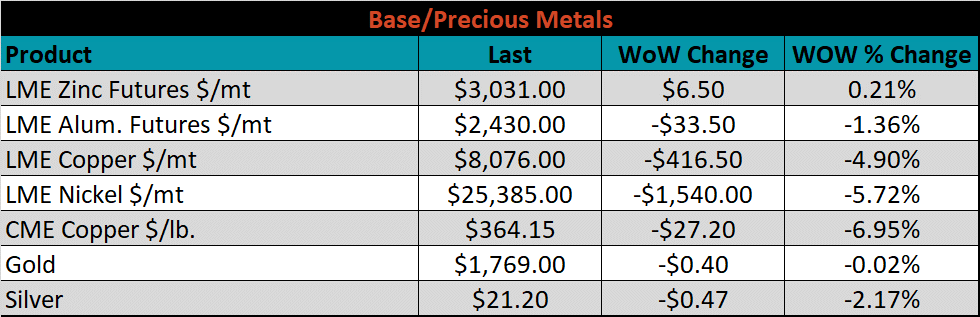
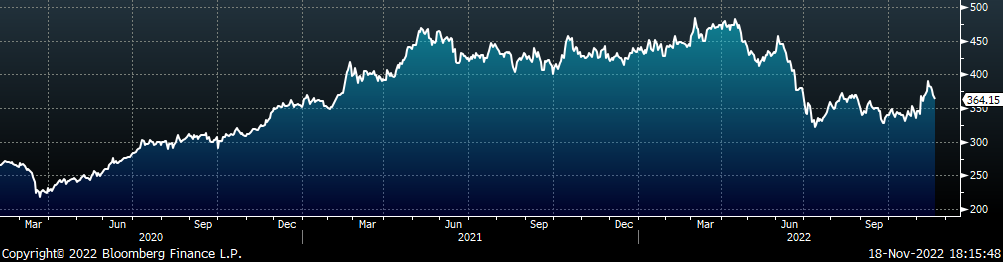
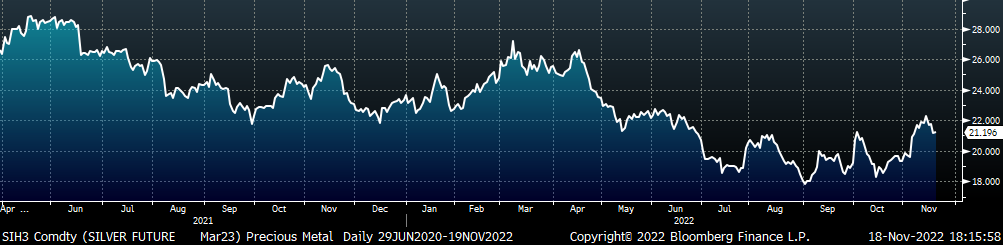
Base and precious metal futures were mostly lower last week due to rising covid cases in China and the LME’s decision not to ban Russian material. CME copper was down the most, 7%, LME copper was also under significant pressure and traded lower for 5 consecutive sessions, snapping a 2-week winning streak. This was the most significant weekly drop for copper in more than two months. Silver was also down on the week, as the Fed continues to push back on a dovish pivot.
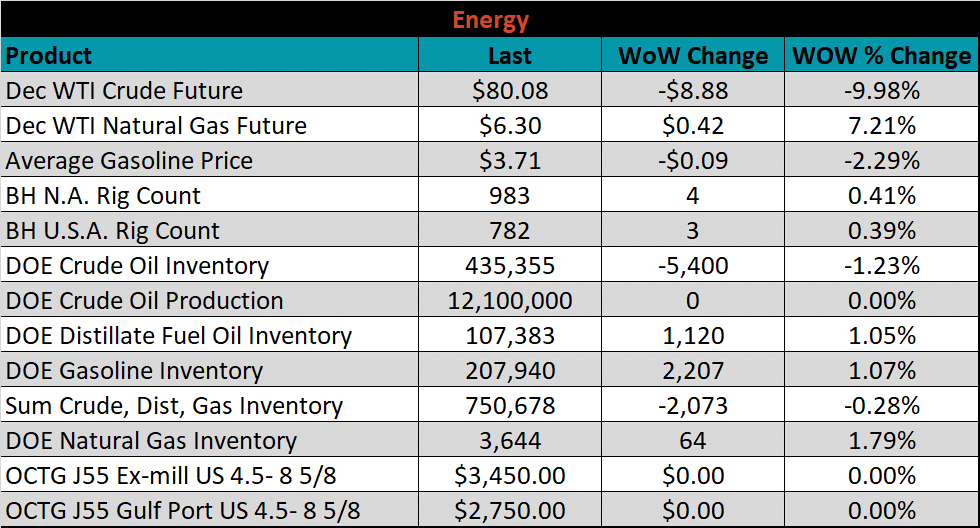
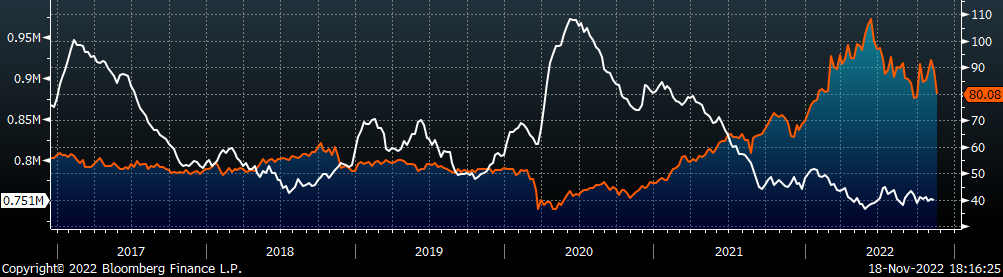
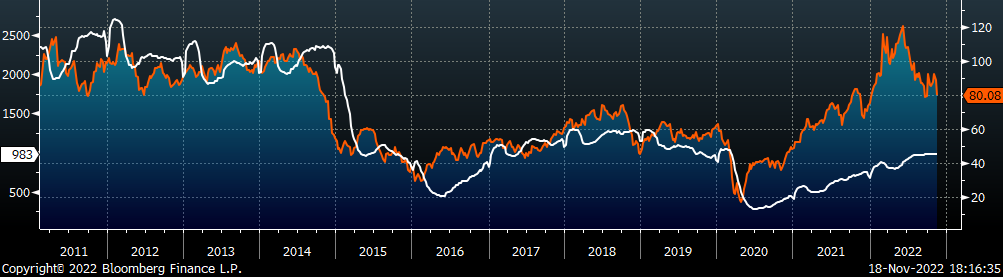
Last week, the December WTI crude oil future lost $8.88 or 10% to $80.08/bbl. The aggregate inventory level fell 0.3%. The Baker Hughes North American rig count was up 4 rigs, and the U.S. rig count increased by 3 rigs.
The list below details some upside and downside risks relevant to the steel industry. The bolded ones are occurring or highly likely.
Upside Risks:
Downside Risks: