Content
-
Weekly Highlights
- Market Commentary
- Upside & Downside Risks


Over the last couple of weeks, very little new information has come forward around the physical market. Lead times continue to come in and are approaching historic norms, while a true spot price is largely unknown due to limited business activity. As we approach the end of a truly historic year, the tone and tenor around prices is clearly negative. While it is important to note that no one knows how long this downside move will last, or how rapidly prices will fall, the concept of “recency bias” should be front and center as we prepare for next year. In the remainder of this report, we will discuss the recent price cycles and highlight the major differences between then and now.
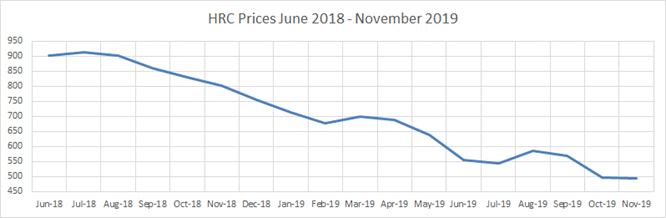
Recency bias refers to the phenomenon where individuals place too significant a probability on the future repeating the not so distant past. To better understand what this means for steel in this scenario, let’s look at the most recent downside move in steel prices (excluding the 2020 sell-off), which began in 2018. The chart below shows HRC prices from June 2018 until November 2019, where there were only two months that saw increasing prices.
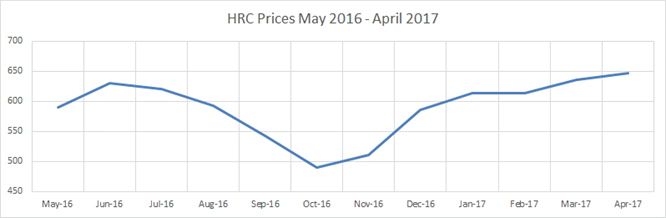
Looking back, buyers who owned unhedged physical material, probably felt like they could not catch a break, especially those on a lagging contract, who continuously received tons priced out of the market. However, when reading commentary published in the early stages of that down cycle move, most believed it was only going to be a blip on the radar. Section 232 tariffs, which fueled the initial rally, had only been enacted a few months prior and were continually in the news. On top of that, the 2016 correction, which was the most recent downside move at the time, saw an immediate rebound. The chart below shows the monthly HRC price from May 2016 to April 2017, where 4 straight months of lower prices preceded 5 straight months of higher prices and an eventual higher peak.
Under the influence of recency bias, many believed that the 2018 downside move would be a short-lived correction, as evidenced by higher-than-average inventories across all steel consuming sectors at the time. Then, much like now, risks that were not properly considered at the beginning of the down move ended up being significant. Rather than relying on the most recent experience when evaluating these risks, it will be important to remember that differences between this cycle and the prior ones will drive prices.
So, what is different now compared to 2018? The most significant difference between now and then is that the shortage of steel and rally in prices was primarily demand driven, rather than by protectionist trade policy. And while supply chain disruption (namely in the auto sector), and the seasonal slowdown in steel intensive activity have ended the rally, we view demand for steel as dormant rather than destroyed. Additionally, the recent passage of the infrastructure bill ensures the U.S. government will be a more active participant in the purchase of domestic steel. The timeline for when this additional demand will come online is not clear and we do not anticipate an immediate impact on prices because of the bill, however, this is another factor that will certainly raise the floor in coming years. From the supply side, imports continue to arrive at historic levels. However, rumors around how quickly prices may be falling have anecdotally halted new import inquiries which would be late 1Q22 early 2Q22 arrivals. This is, in part, a result of buyers fearing they will be stuck with out of the market priced steel when it finally arrives, much like in 2018 and 2019.
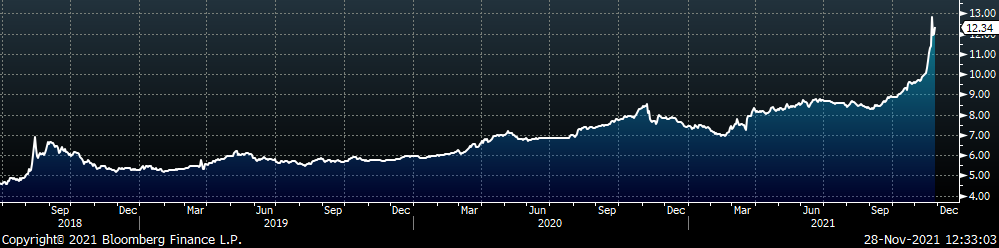
With these factors in mind, we anticipate lower prices well into the first quarter, with significant downside risks still looming. Sustained strong inflation, which would cause the Federal Reserve Bank to react with higher rates earlier than broadcast, could weigh significantly on the economy. Additionally, an economic slowdown or further supply chain disruption caused by the emergence of the omicron variant, or any new variants are impossible to forecast. Simply put, there will be significant price volatility within the futures and physical market over the coming months. To take advantage of these opportunities it is vital that you are not stuck in a historical market mentality.
Below are the most pertinent upside and downside price risks:
Upside Risks:
Downside Risks:
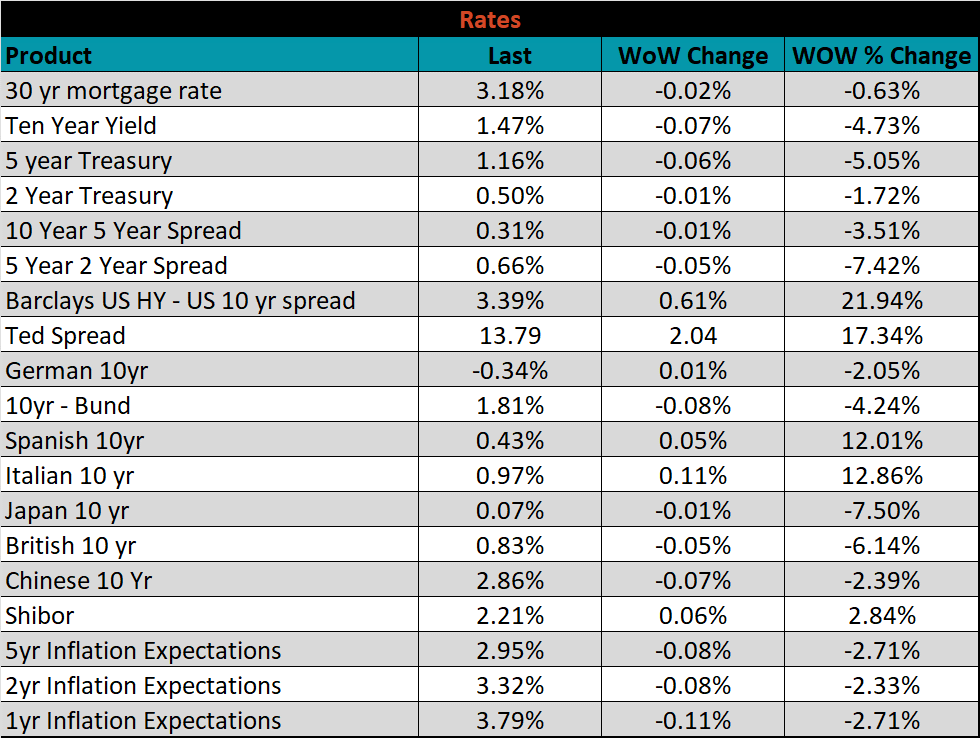
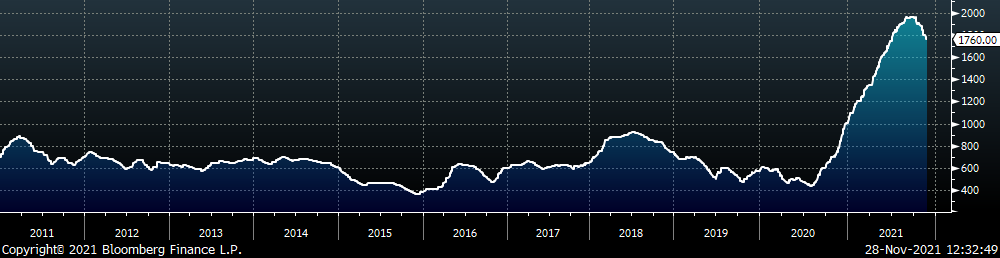
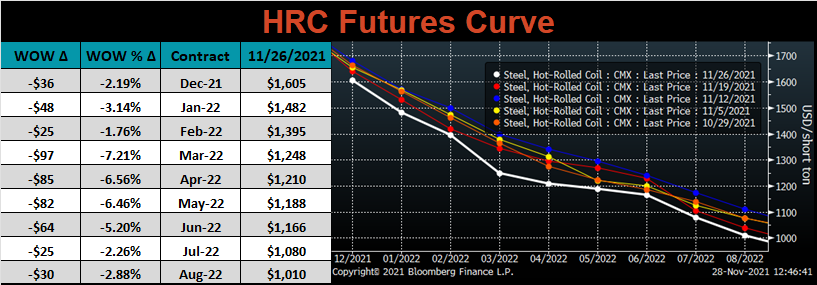
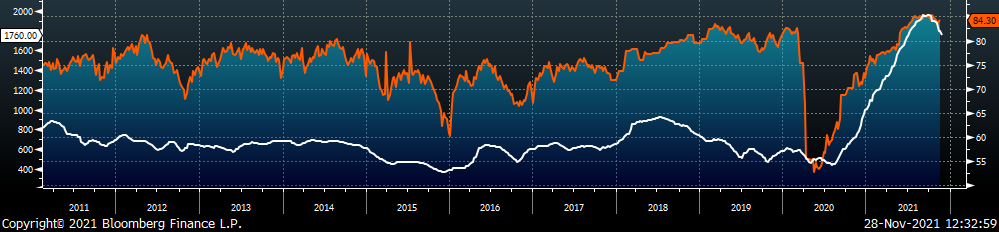
The Platts TSI Daily Midwest HRC Index decreased by $40 to $1,760.
The CME Midwest HRC futures curve is below with last Friday’s settlements in white. Last week, the entire curve was lower, most significantly from March – June of 2022.
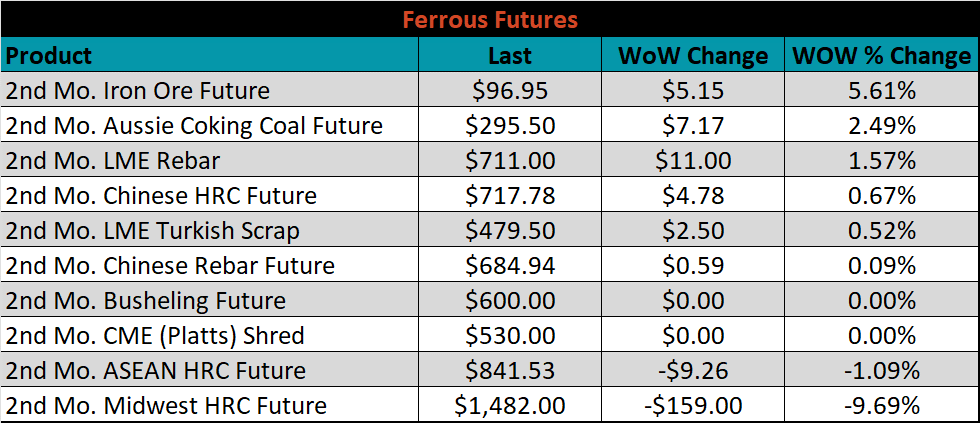
January ferrous futures were mostly higher, led by iron ore which gained 5.6%. Midwest HRC, in contrast, moved sharply lower, losing 9.7%.
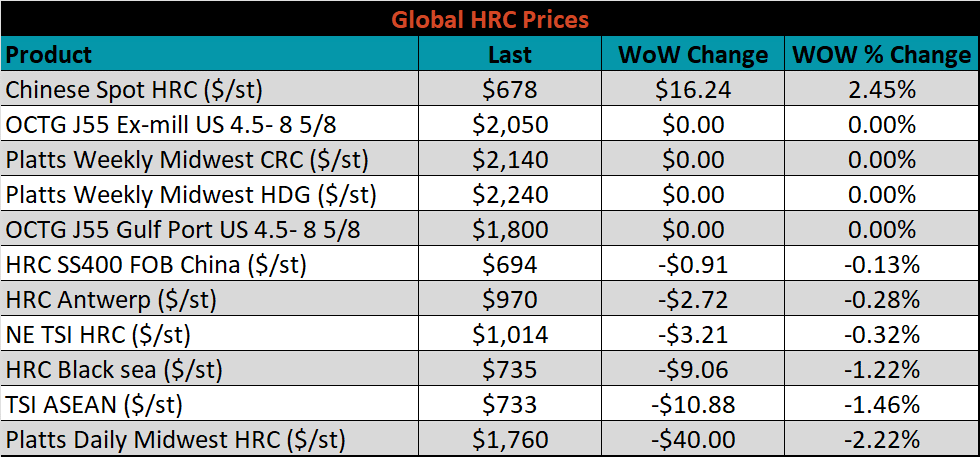
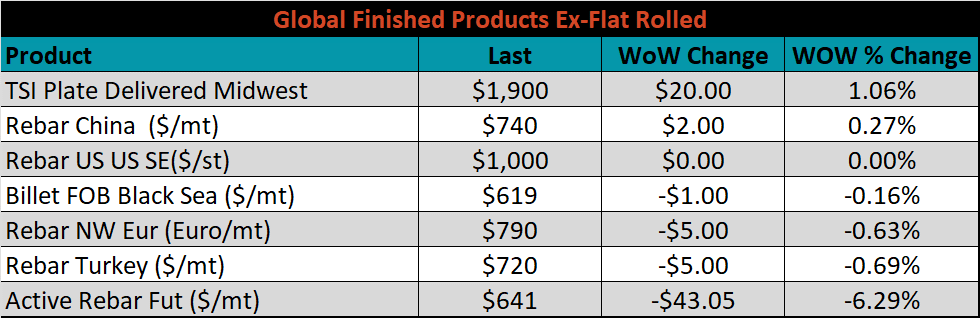
Global flat rolled indexes were mostly lower, led by TSI Platts Midwest HRC, down another 2.2%.
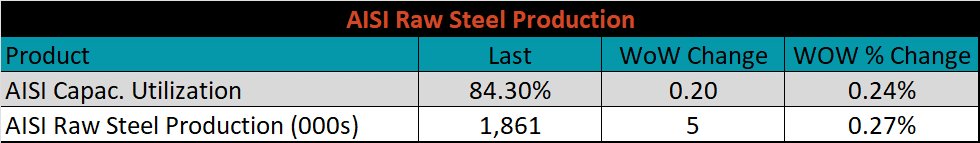
The AISI Capacity Utilization rose 0.2% to 84.3%.
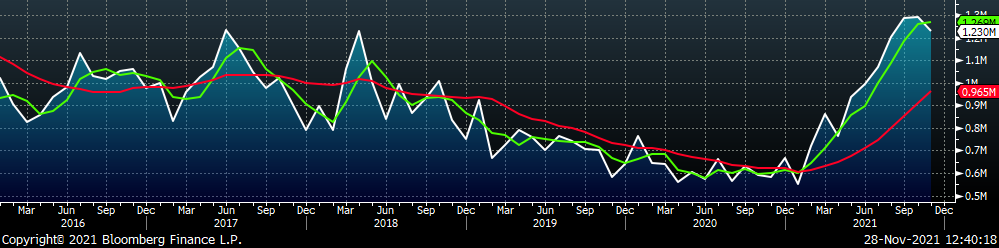
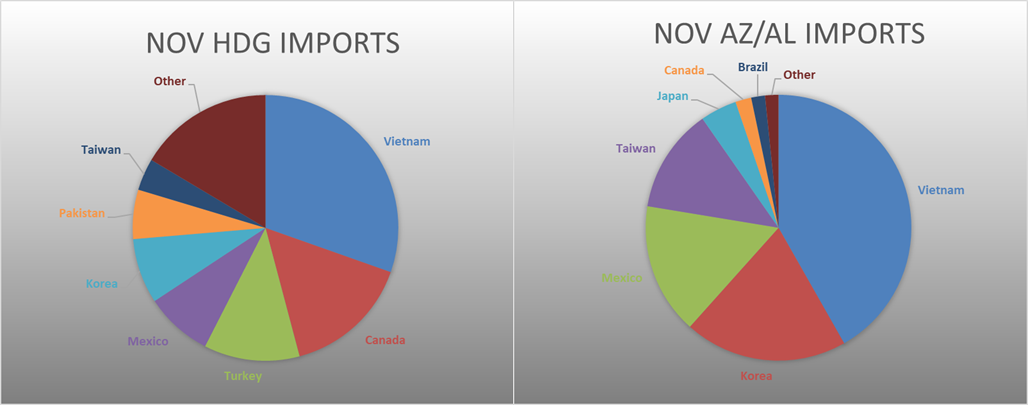
November flat rolled import license data is forecasting a decrease of 61k to 1.23M MoM.
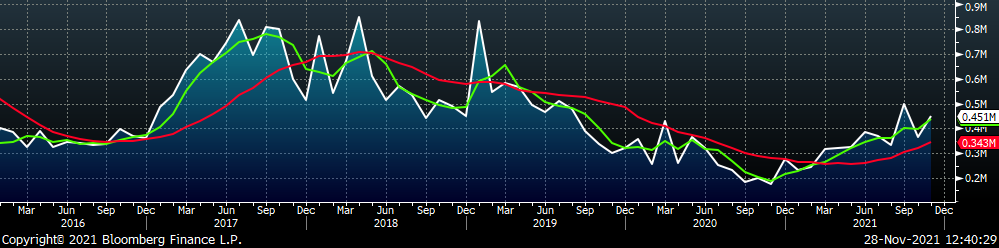
Tube imports license data is forecasting an increase of 85k to 451k in November.
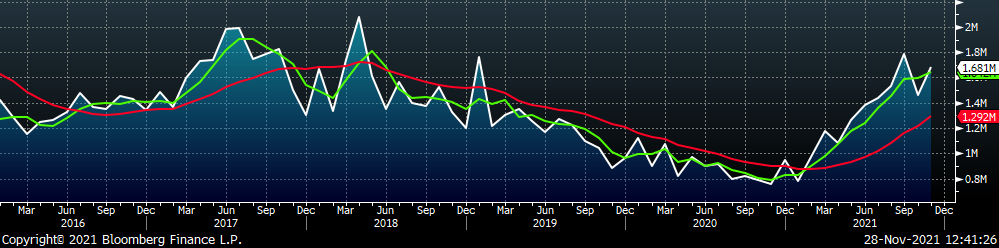
November AZ/AL import license data is forecasting an increase of 39k to 138k.
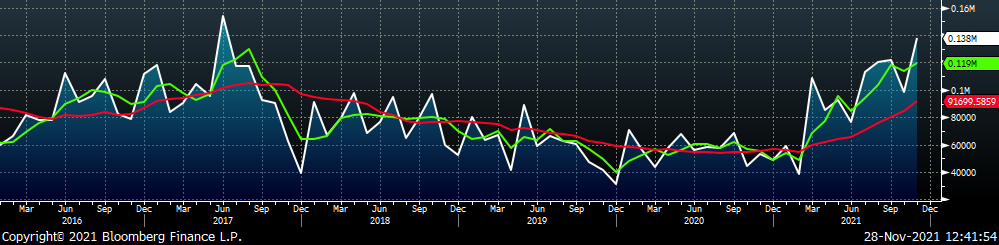
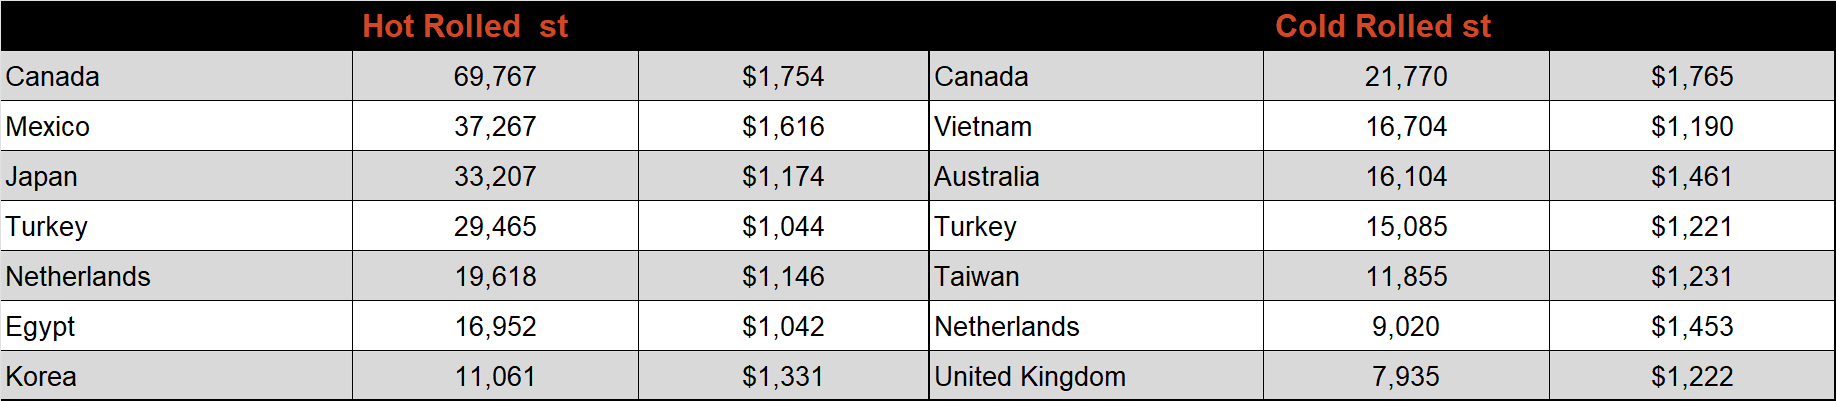
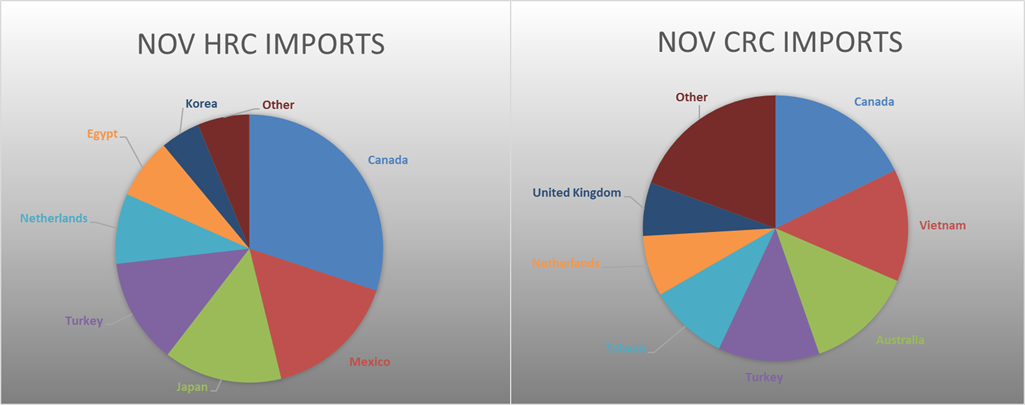
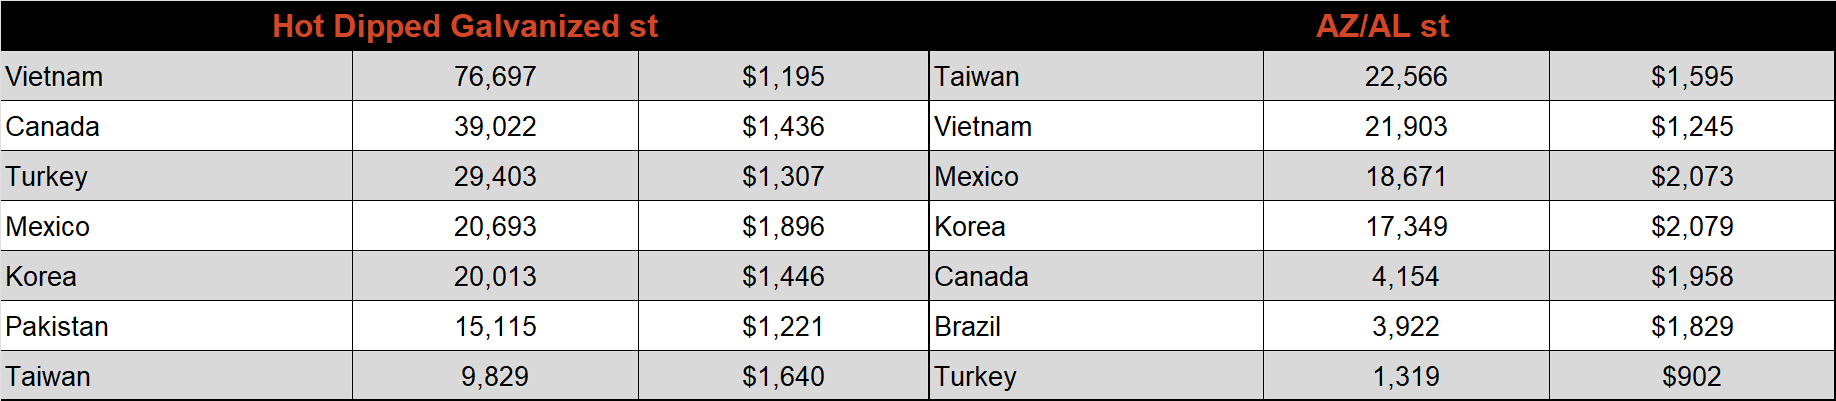
Below is October import license data through November 22th, 2021.
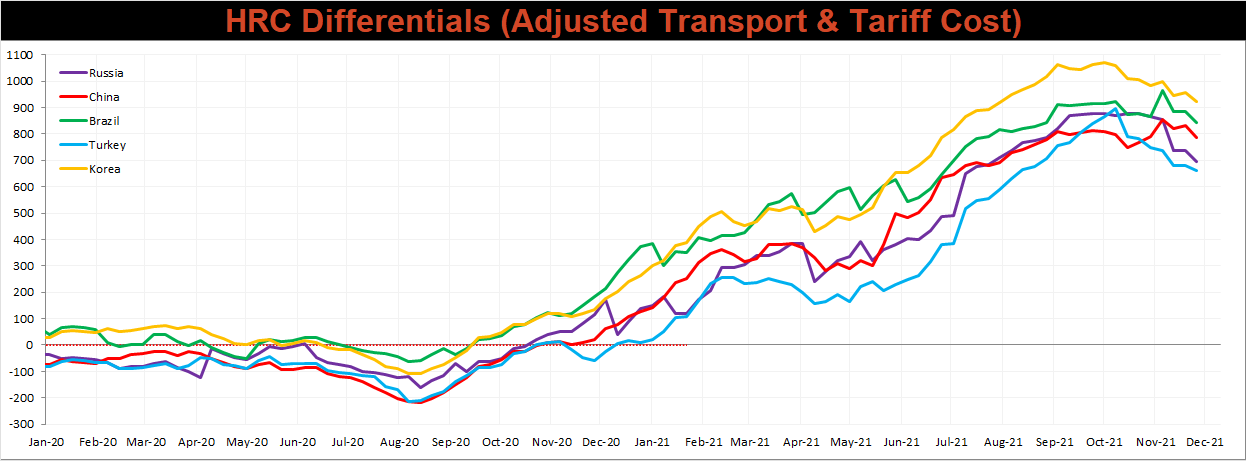
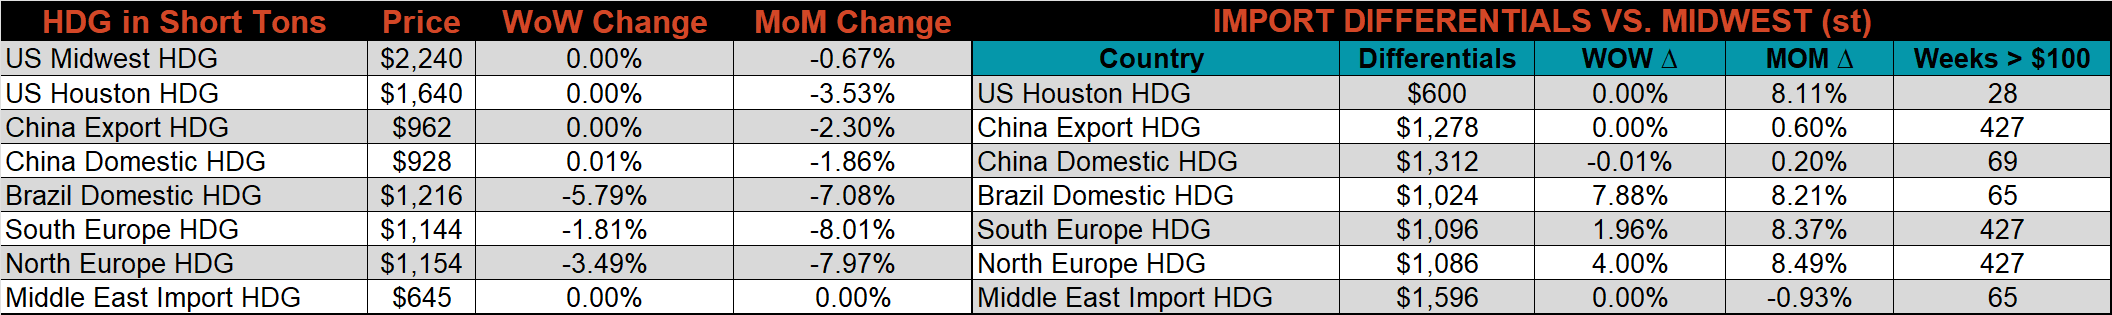
Below is the Midwest HRC price vs. each listed country’s export price using pricing from SBB Platts. We have adjusted each export price to include any tariff or transportation cost to get a comparable delivered price. All the differentials continued to move lower this week as the Midwest HRC price fell more significantly than any other global prices.
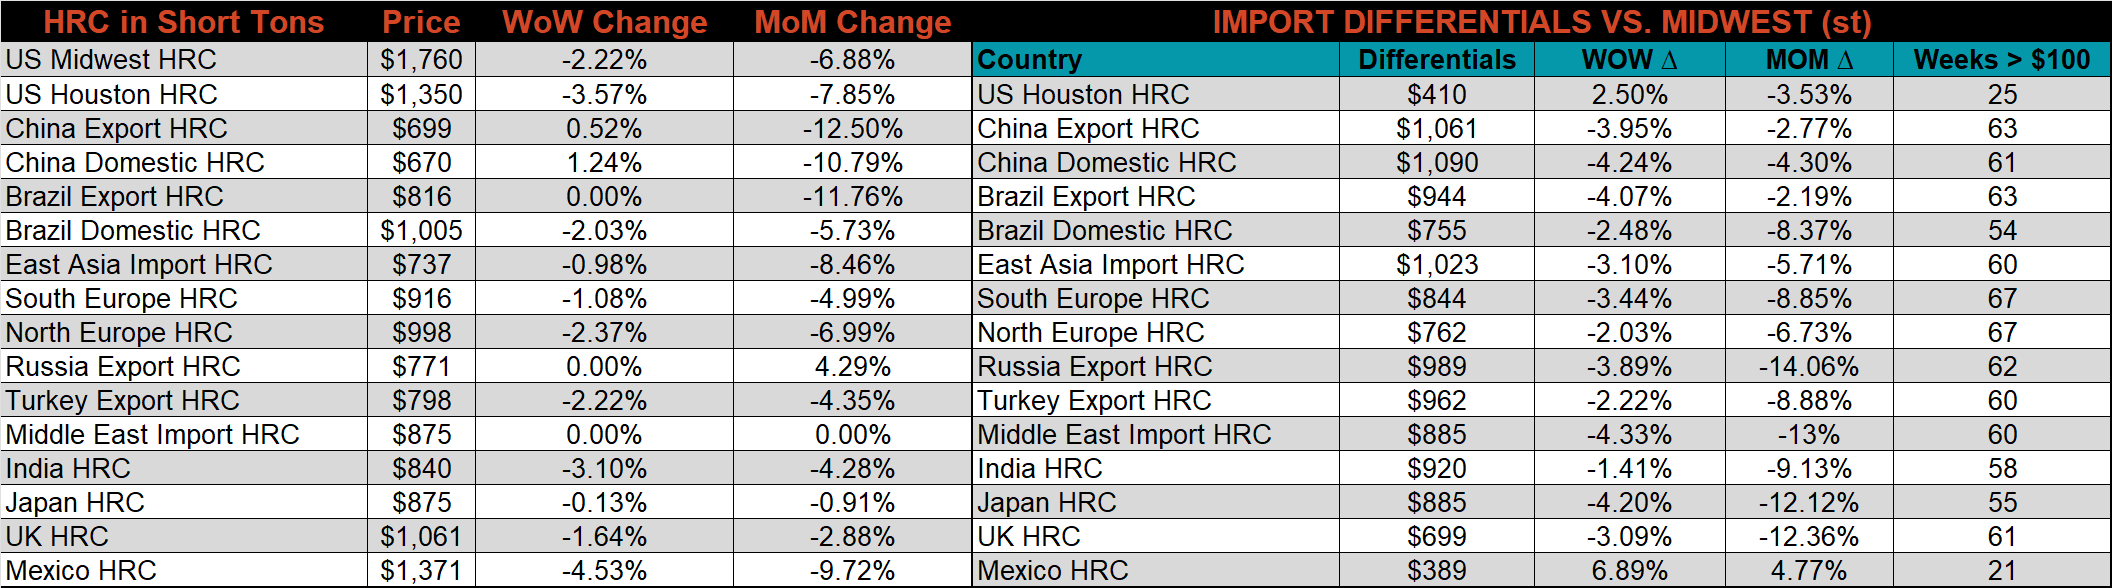
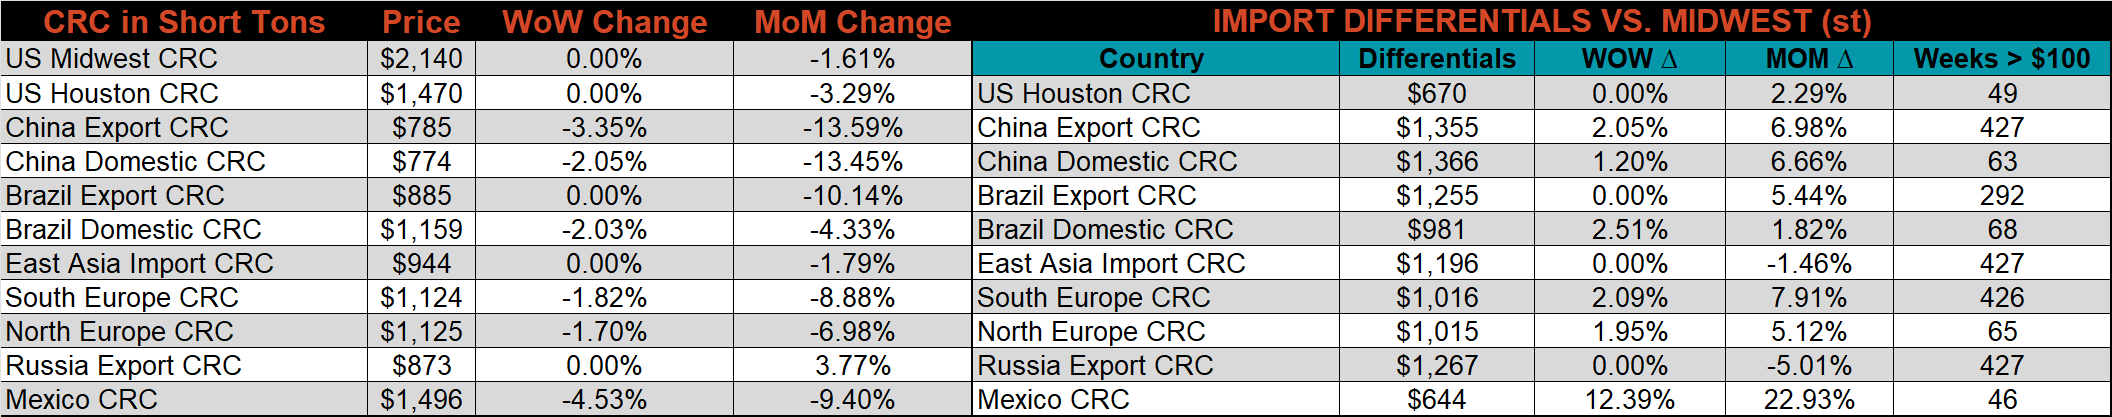
SBB Platt’s HRC, CRC and HDG pricing is below. The Midwest HRC price was down 2.2%, while the CRC and HDG prices were unchanged. Outside of the U.S., the Mexican HRC price was down 4.5%.
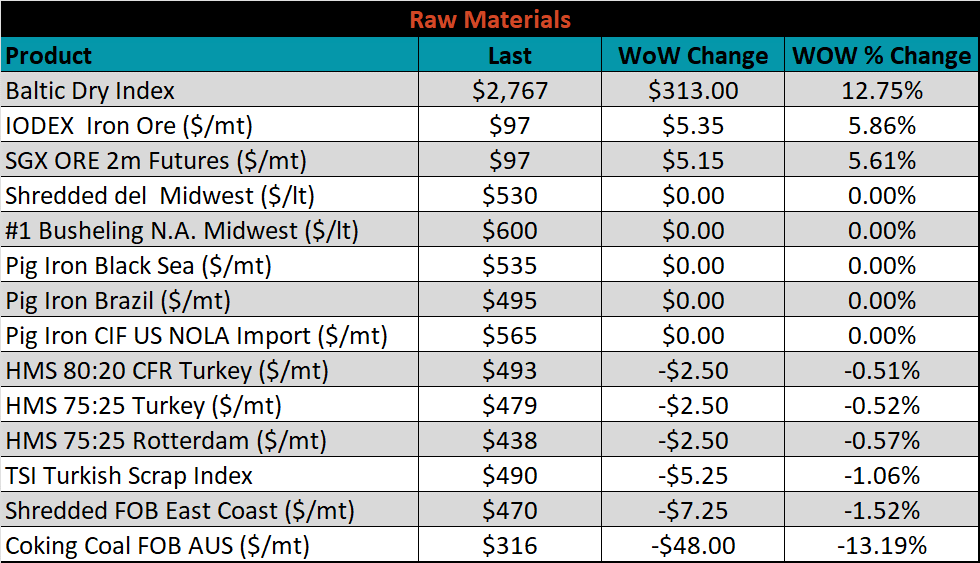
Raw material prices were mixed. The IODEX rose 5.9%, while Aussie coking coal was down 13.2%.
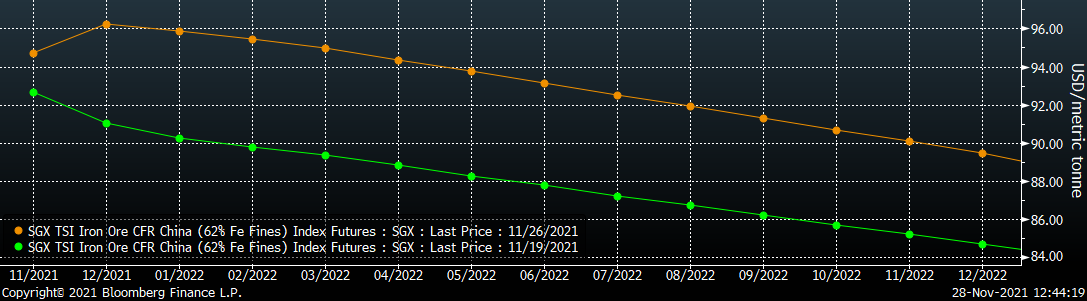
Below is the iron ore future curve with Friday’s settlements in orange, and the prior week’s settlements in green. Last week, the entire curve shifted ~$4 higher at all expirations.
The ex-flat rolled prices are listed below.

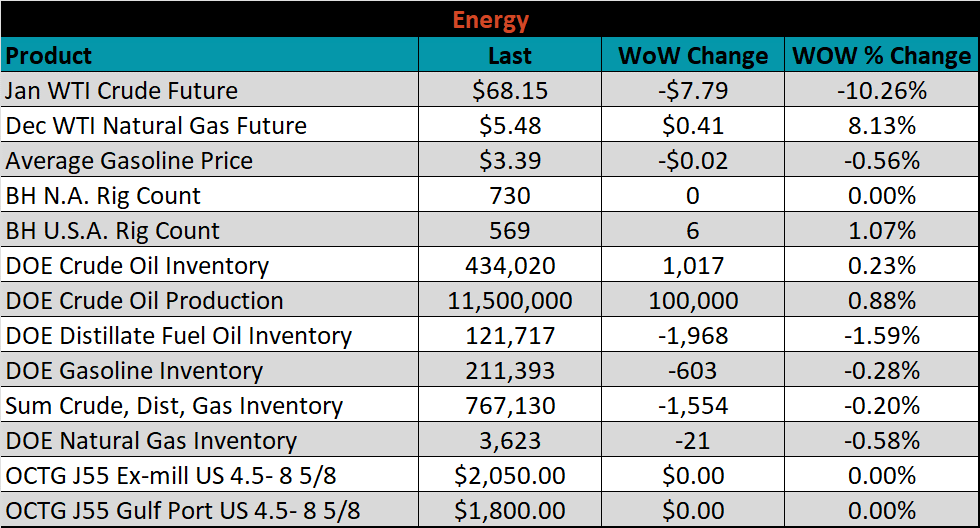
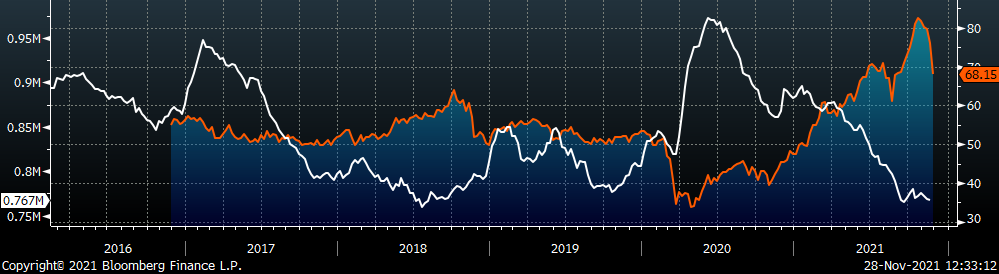
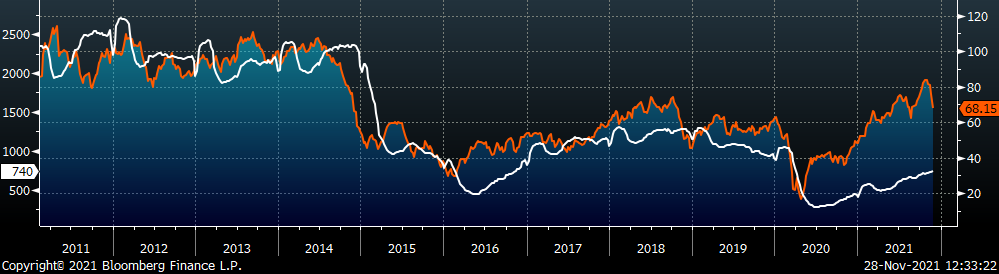
Last week, the January WTI crude oil future was down another $7.79 or 10.3% to $68.15/bbl. The aggregate inventory level was down 0.4%, while crude oil production remains at 11.5m bbl/day. The Baker Hughes North American rig count was up 14 rigs, while the U.S. rig count was up another 6 rigs.
The list below details some upside and downside risks relevant to the steel industry. The bolded ones are occurring or highly likely.
Upside Risks:
Downside Risks: