Content
-
Weekly Highlights
- Market Commentary
- Risks


In the weeks and months leading up the Thanksgiving holiday, not much had changed regarding the outlook and pace of the current HRC price rally. Supply disruptions, elevated lead times, shrinking inventory levels and steadily increasing demand drove the spot price to increase at an average pace of approximately $20 per ton each week – the fastest pace price rally in recent history. However, over the last week, market dynamics changed, further damaging the beaten up buying community. Spot offers from mills are now at $840/st with limited January availability. This represents a $90/st price increase this week, and has already spurred some buyers to transact at that price. Moreover, this increase occurred even as news broke that U.S. Steel would restart its blast furnace #4 at Gary Works. If there were any doubts as to whether this market was in a shortage, the drastic moves over the past week should solidify this narrative. If this market is currently in a shortage and buyers cannot secure material today, they should look at possibly locking prices and tonnage into the future using the forward curve. This week, we will look at the evolution of this strategy over the past month, and how it can be used today given the current market dynamics.
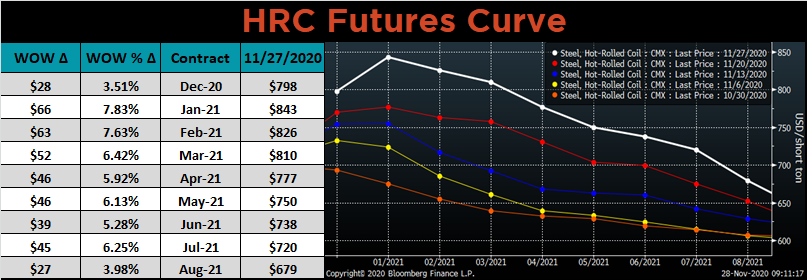
The below chart shows today’s forward curve in green, compared to the curve one month ago in orange. The bottom panel shows the dollar per ton change in each forward expiration over the past month. This represents the savings that buyers are currently sitting on if they locked in prices a month ago – almost $200 per ton for each month in the first quarter of next year.
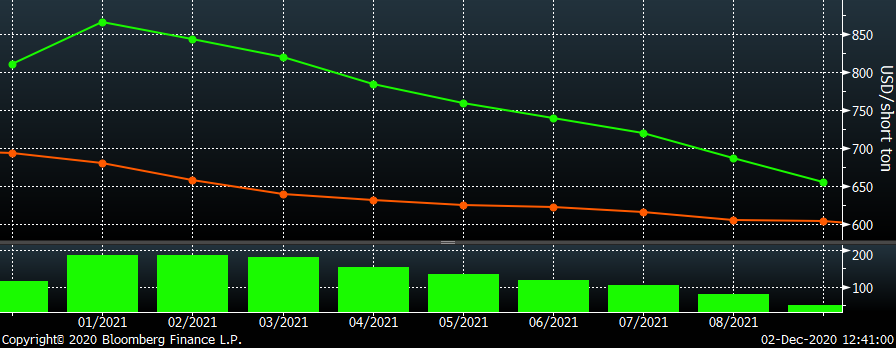
We have assisted multiple customers in locking prices and secure future tons over the past month, positioning them at a significant advantage compared to their competitors. Unfortunately, we have also seen many buyers pass on offers and predict lower prices next year. Let’s explore how this will play out for steel consuming companies over the next few months assuming that they are right and HRC prices decline starting in January. If the spot price falls $40/st over the month from its peak near $850 (representing a significant drop based on historical cycles), the spot price entering February will still be above $800. Furthermore, lead times will be into at least March. While the buyer may feel good about predicting a peak in prices, their company will be replenishing their depleted inventory in late March or early April with $800 HRC. The lead-time and price look even worse if the rally lasts longer or peaks at a higher price.
Thankfully, the curve offers an alternative that is risk reducing and more attractive pricing on the same timeline. The second quarter is trading near $750, allowing buyers to lock in that price, receive material at that time, and reduce the risk that prices continue higher. Due to the shape of the curve, the prices get more attractive further out into the future. Our recommendation – Buy when you can, not when you have to.
Below are the most pertinent upside and downside price risks:
Upside Risks:
Downside Risks:
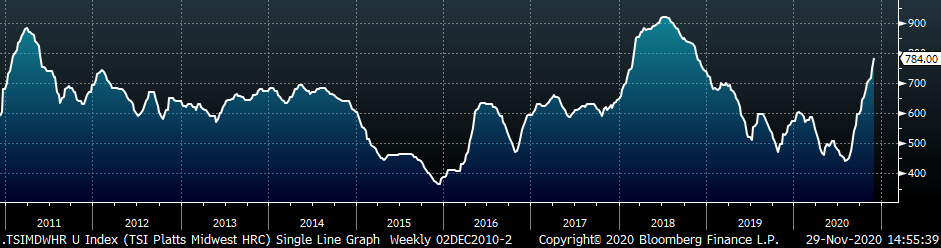
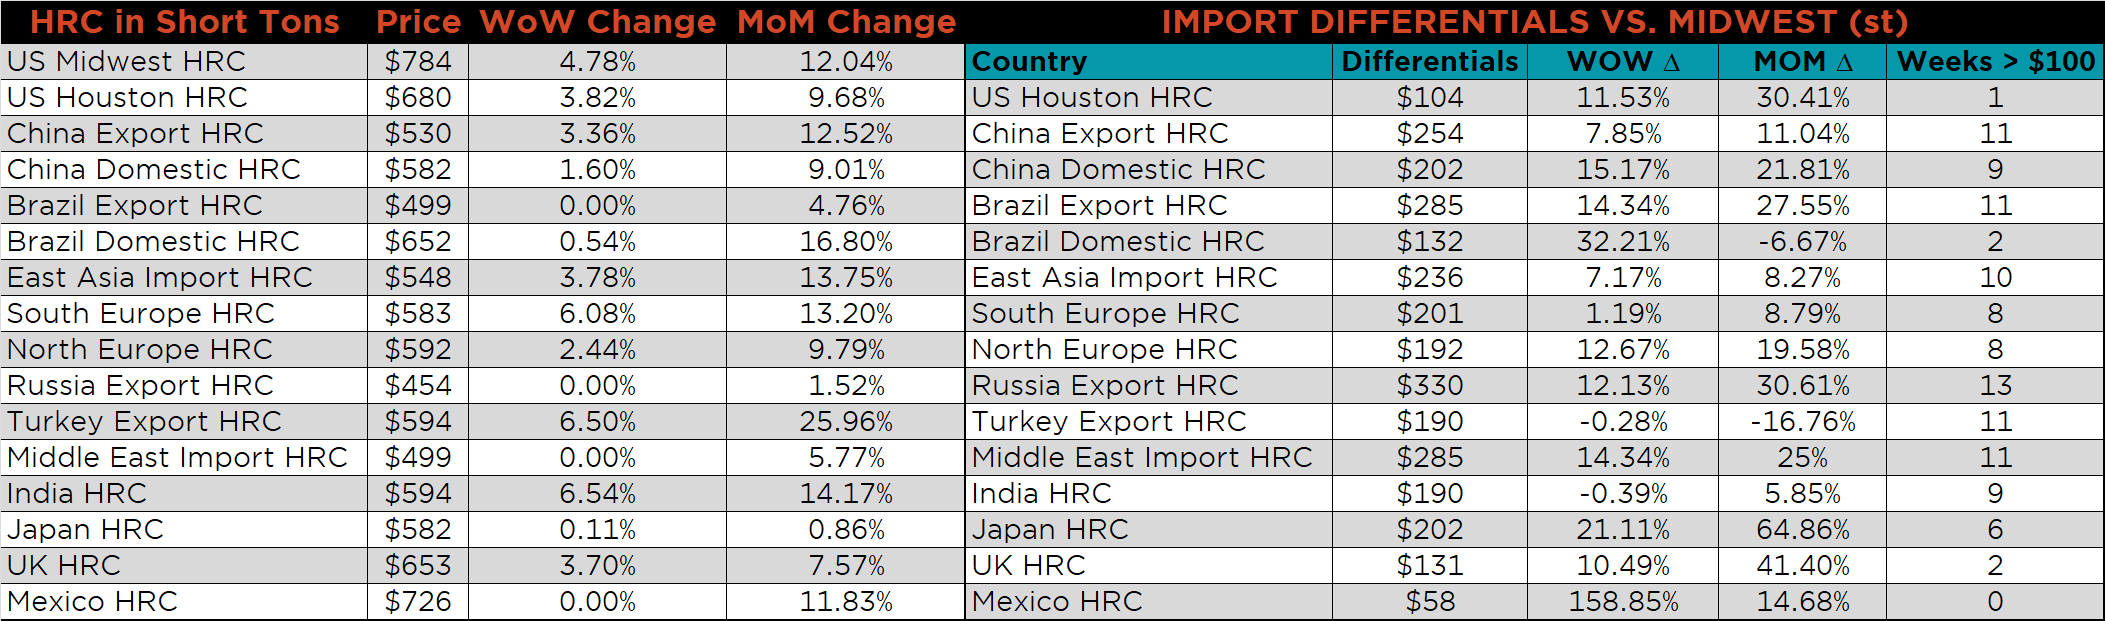
The Platts TSI Daily Midwest HRC Index increased by $35.75 to $784.
The CME Midwest HRC futures curve is below with last Friday’s settlements in white. Last week, the entire curve shifted higher, most significantly in the front expirations.
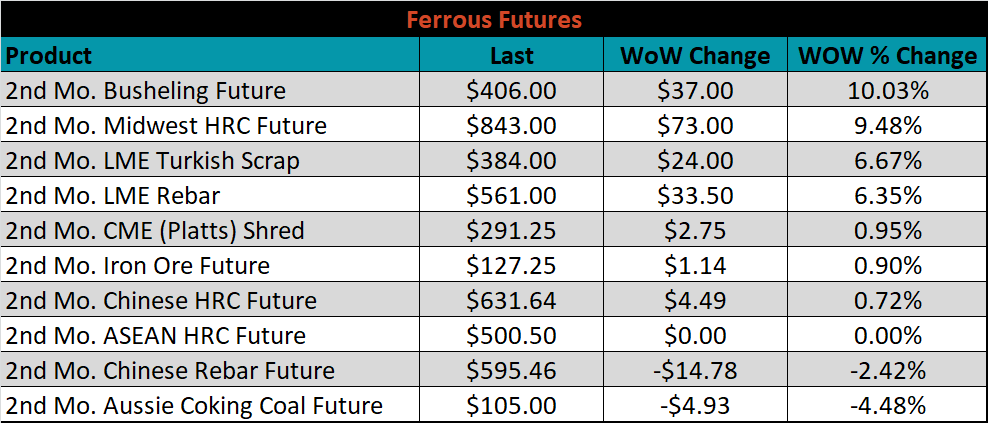
December ferrous futures were mostly higher. Busheling gained 10%, while Aussie coking coal fell 4.5%.
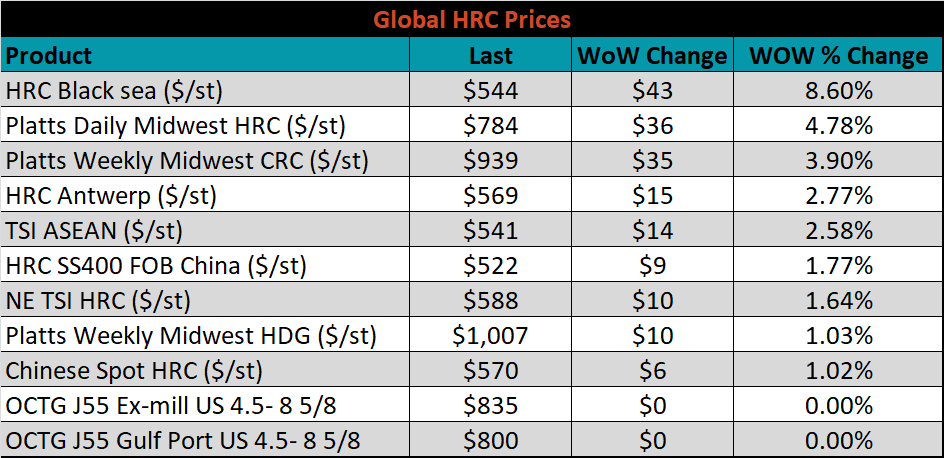
The global flat rolled indexes were all higher, led by Black Sea HRC, up 8.6%.
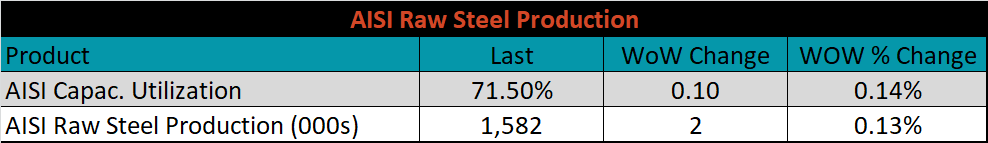
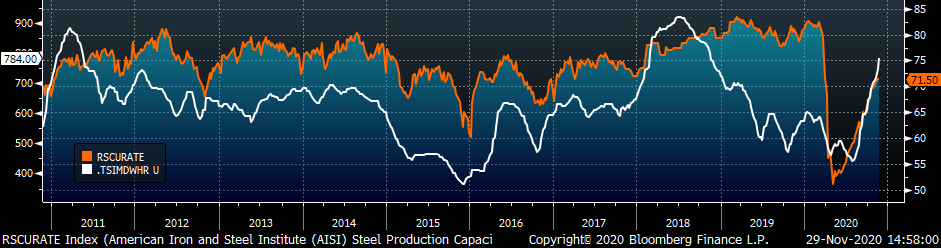
The AISI Capacity Utilization rate increased 0.1% to 71.5%.
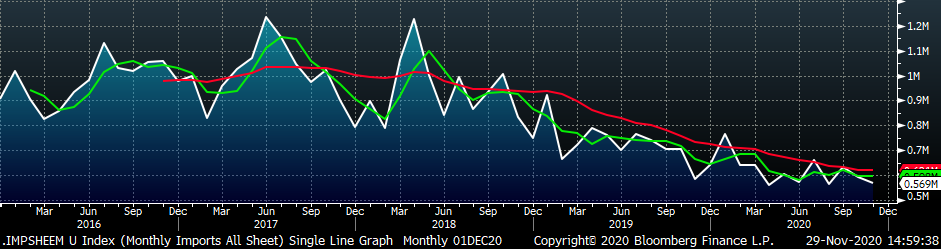
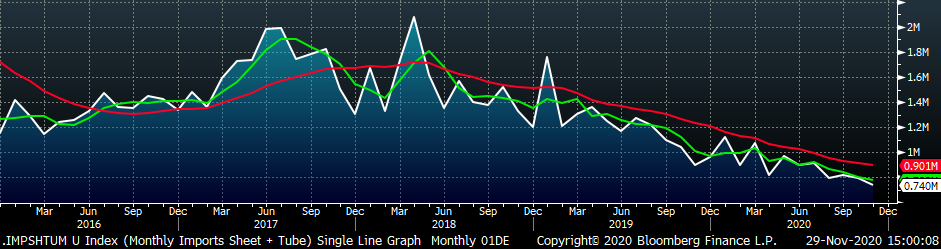
November flat rolled import license data is forecasting a decrease of 24k to 569k MoM.
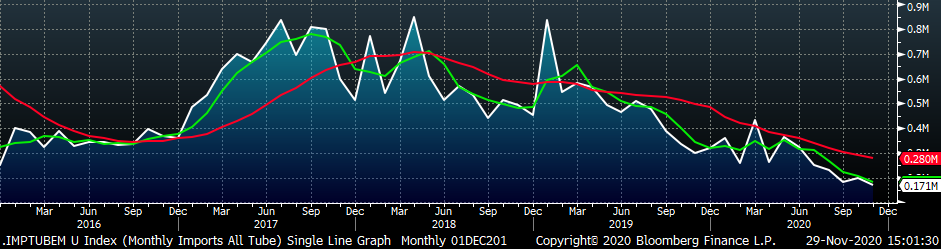
Tube imports license data is forecasting a decrease of 28k to 171k in November.
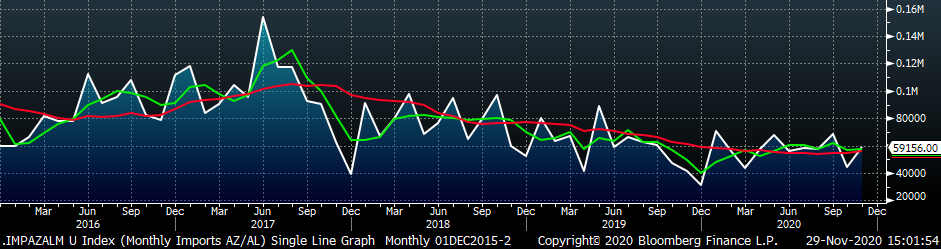
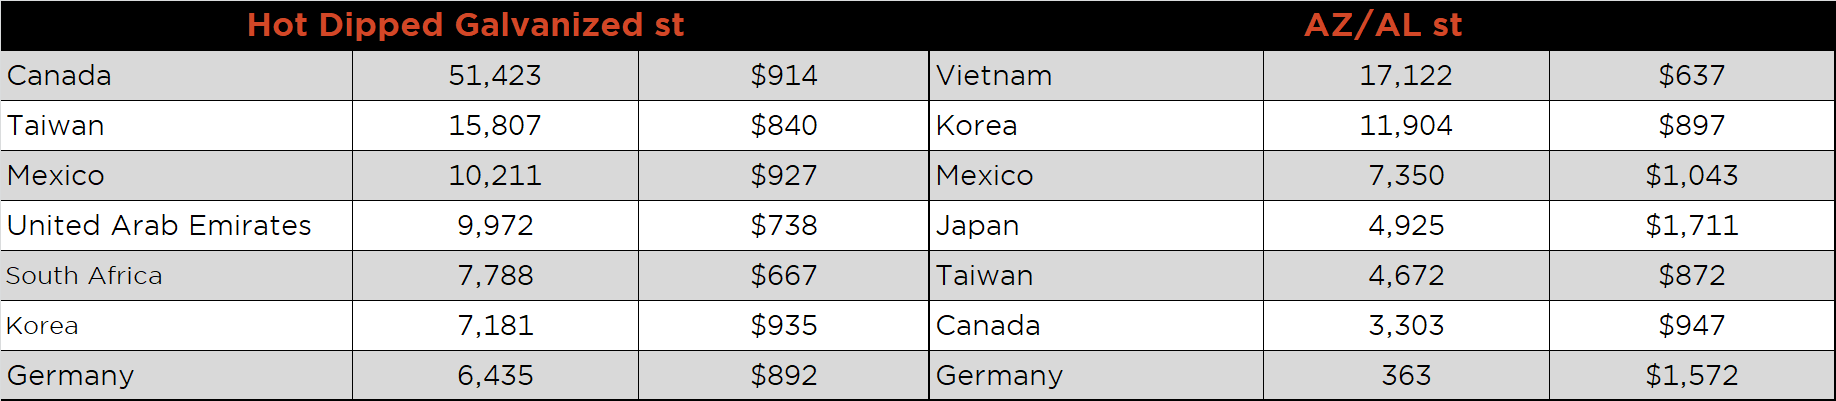
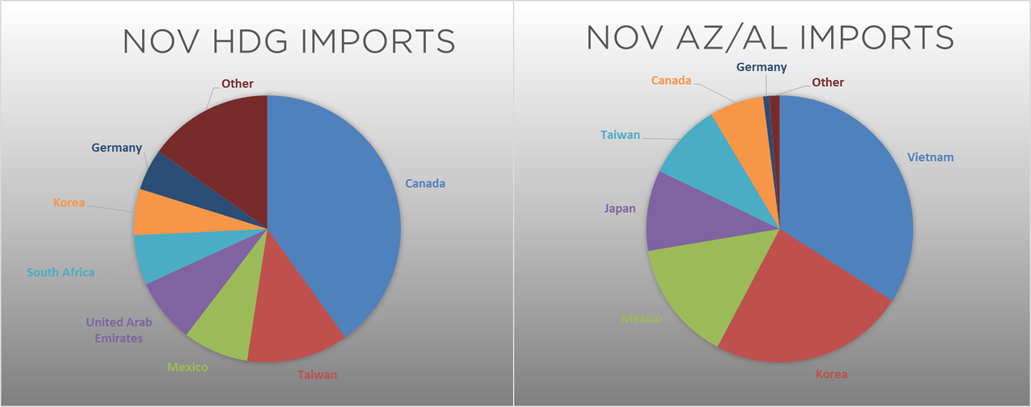
November AZ/AL import license data is forecasting a 16k increase to 59k.
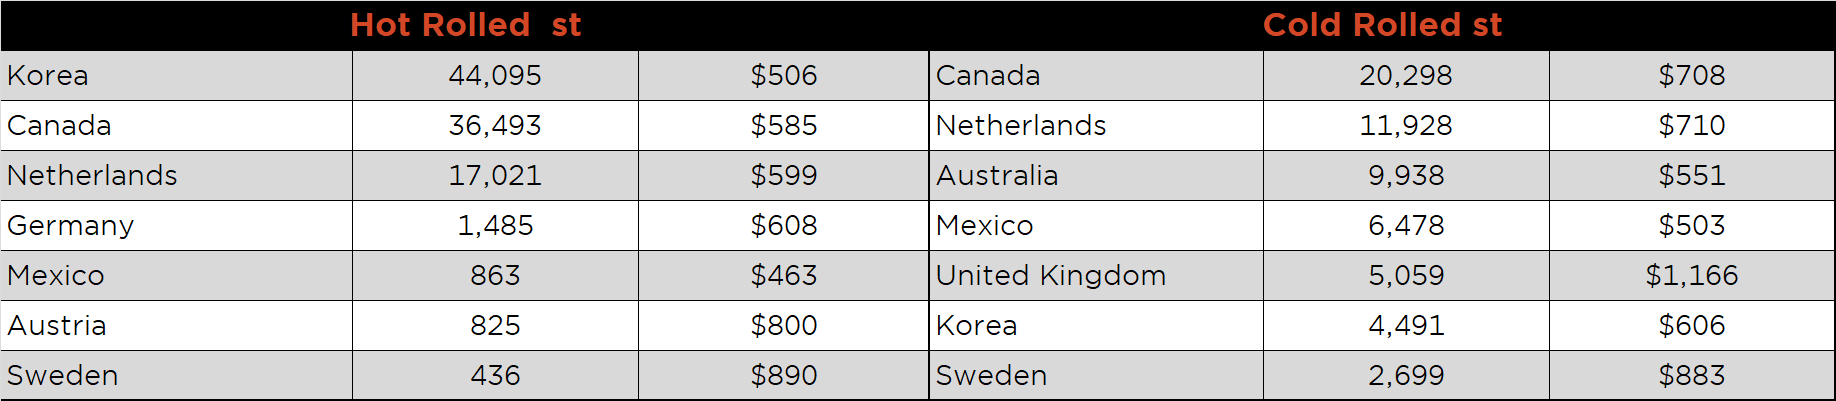
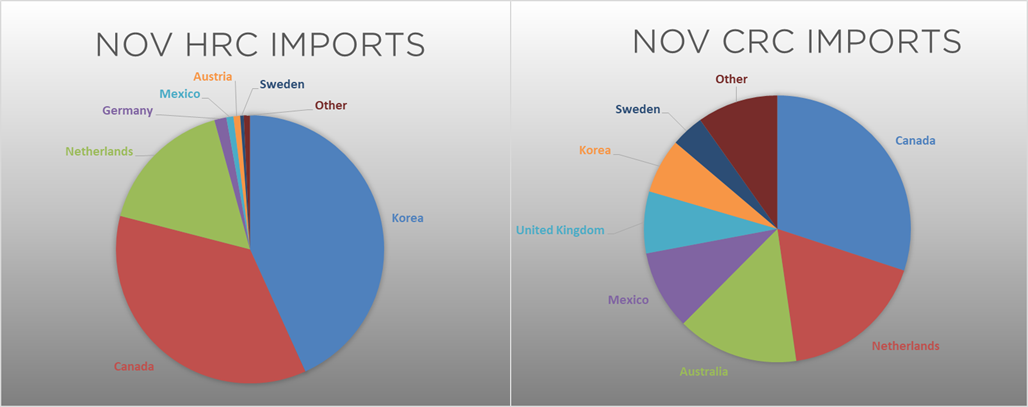
Below is November import license data through November 24, 2020.
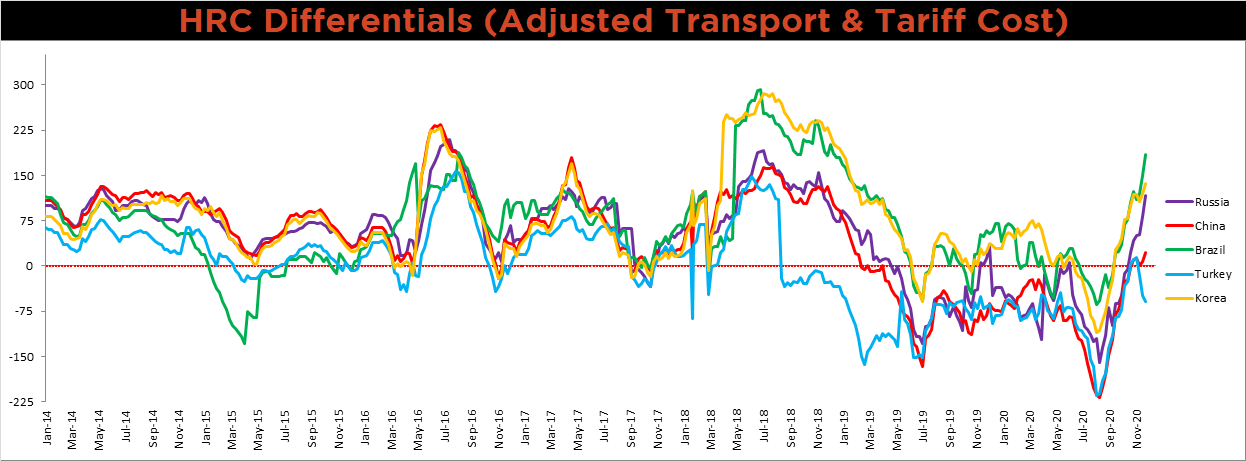
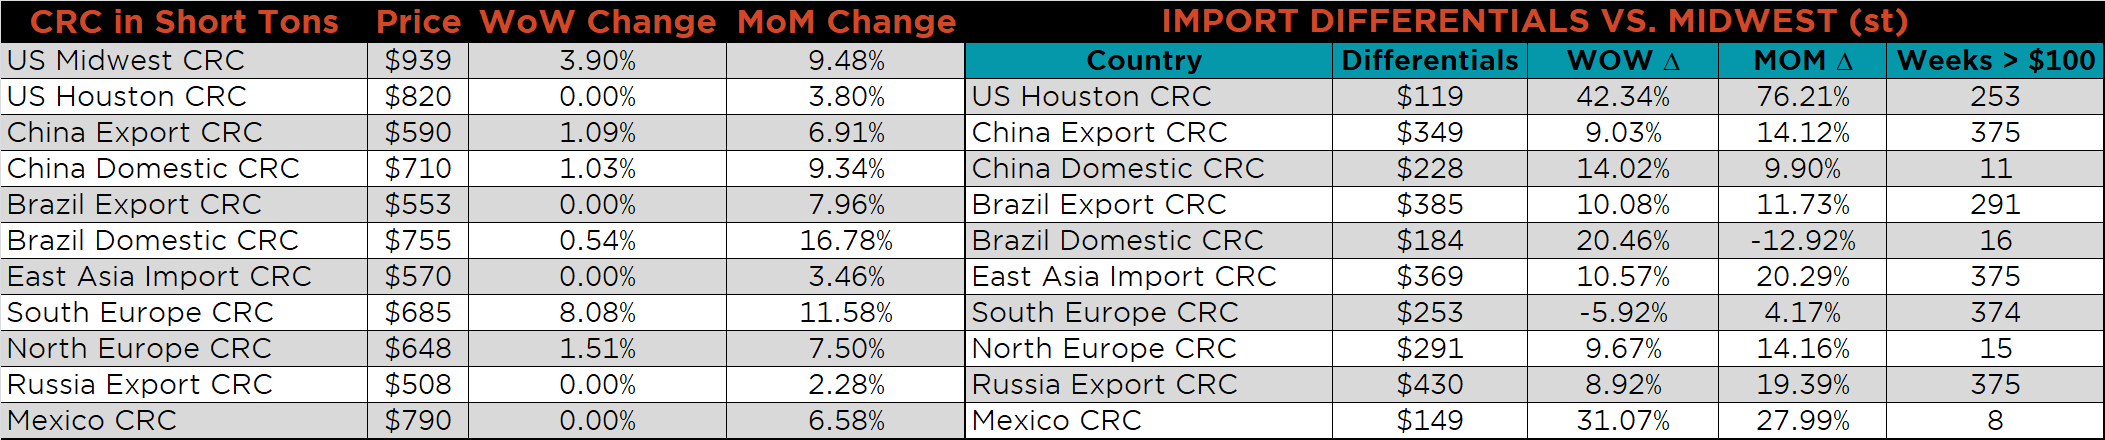
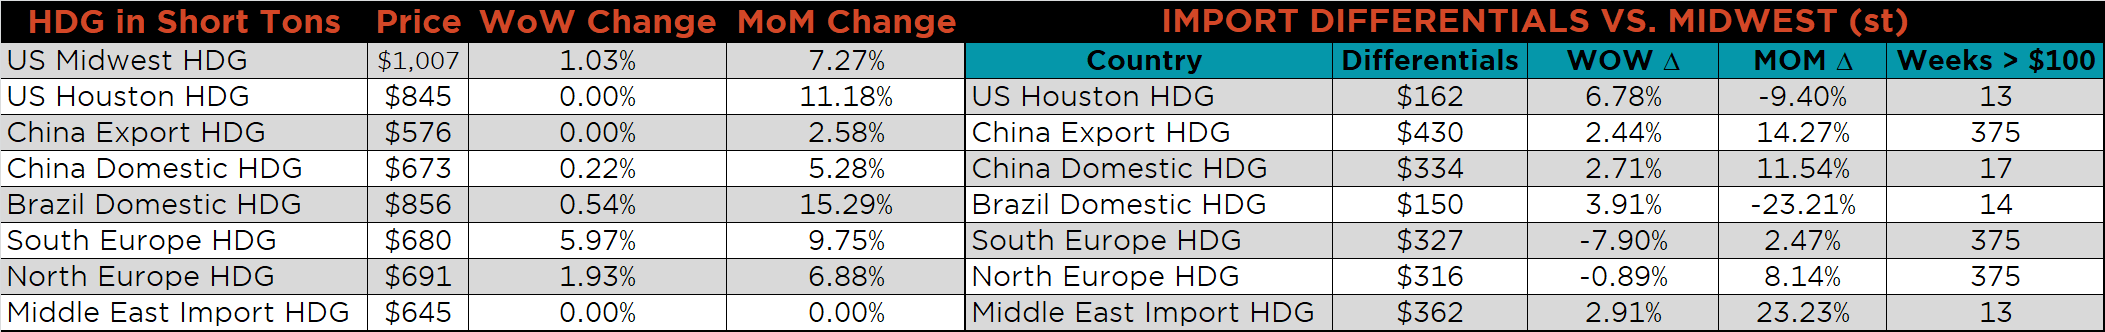
Below is the Midwest HRC price vs. each listed country’s export price using pricing from SBB Platts. We have adjusted each export price to include any tariff or transportation cost to get a comparable delivered price. All the watched differentials moved higher except for Turkey.
SBB Platt’s HRC, CRC and HDG pricing is below. The Midwest HRC, CRC and HDG prices were up 4.8%, 3.9% and 1%, respectively. Globally, the Turkish HRC price was up, 6.5%.
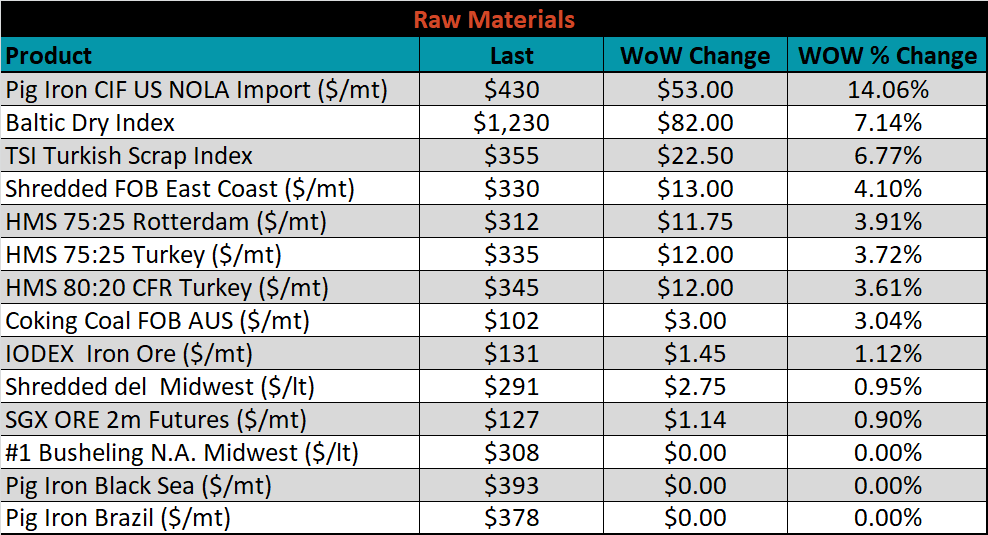
Raw material prices mostly higher, led by NOLA pig iron, up 14.1%.
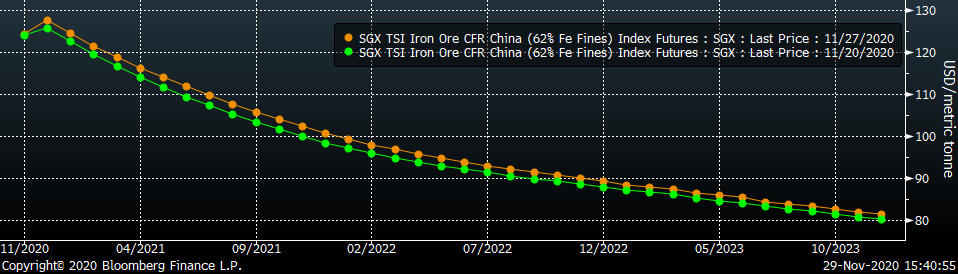
Below is the iron ore future curve with Friday’s settlements in orange, and the prior week’s settlements in green. Last week, the curve shifted slightly higher across all expirations.
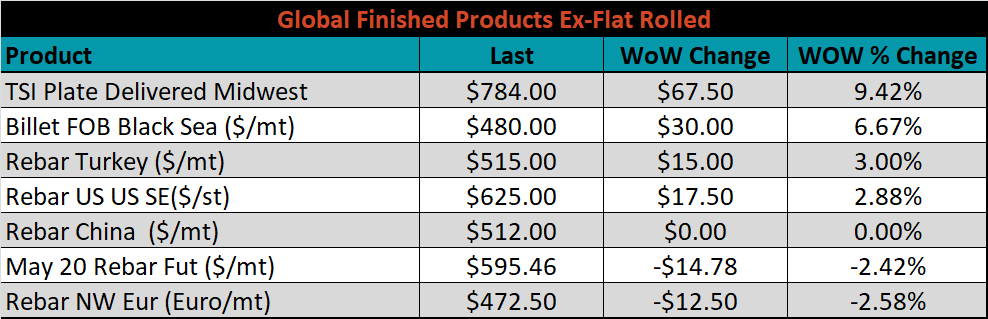
The ex-flat rolled prices are listed below.

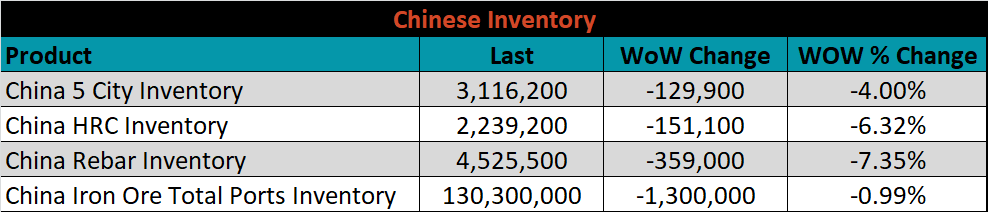
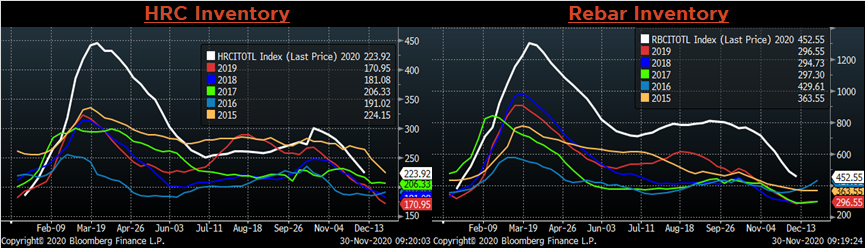
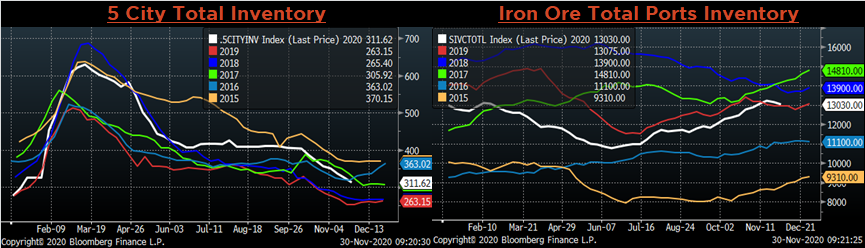
Below are inventory levels for Chinese finished steel products and iron ore. Last week, all watched inventory levels moved lower. At this point, it appears that inventory levels should end the year near where they started it. The rapid destocking of inventory suggests that the supply shortage seen in the U.S. domestic market is occurring around the world.
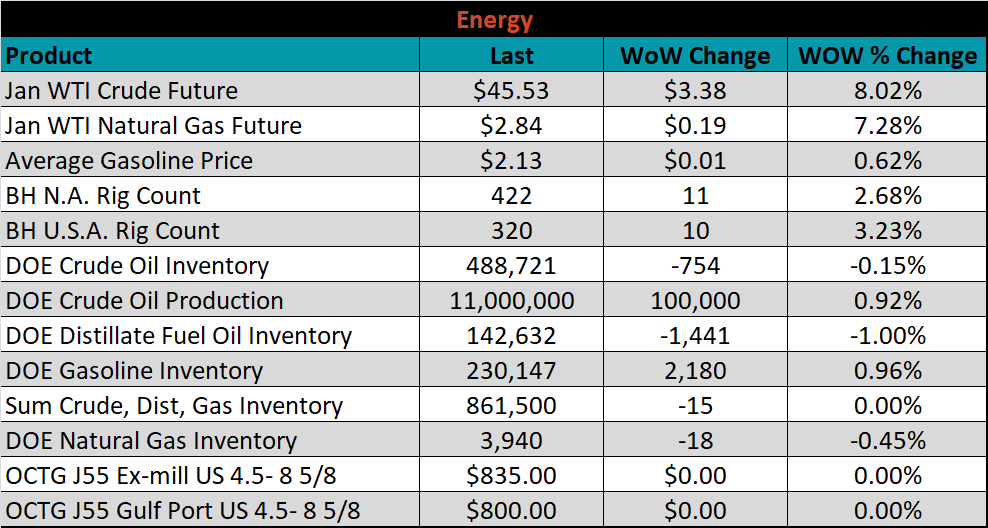
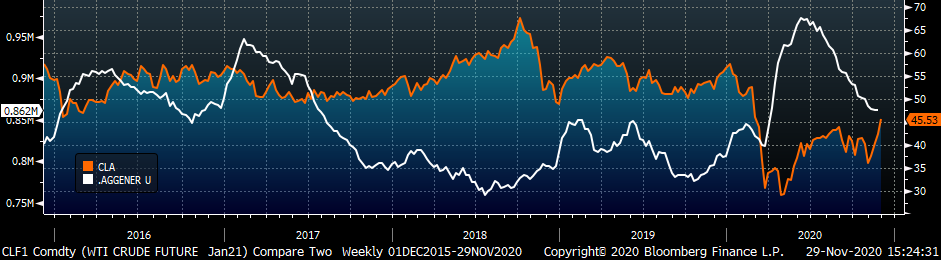
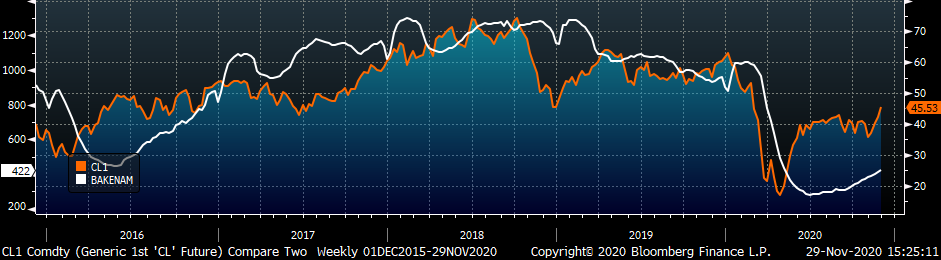
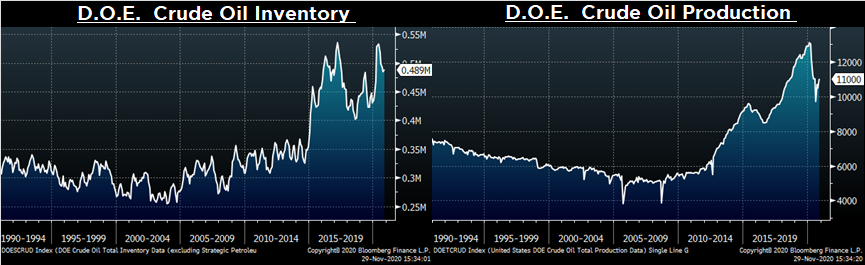
Last week, the January WTI crude oil future gained another $3.38 or 8% to $45.53/bbl. The aggregate inventory level was unchanged, while crude oil production increased to 11m bbl/day. The Baker Hughes North American rig count was up 11 rigs and the U.S. rig counts was up 10 rigs.
The list below details some upside and downside risks relevant to the steel industry. The orange ones are occurring or look to be highly likely. The upside risks look to be in control.
Upside Risks:
Downside Risks: