

November 4, 2022

Market Commentary
The chart below is comprised of the orders subindexes (new orders & backlog) minus inventories which has been a reliable 2-month leading indicator for the topline manufacturing PMI number.
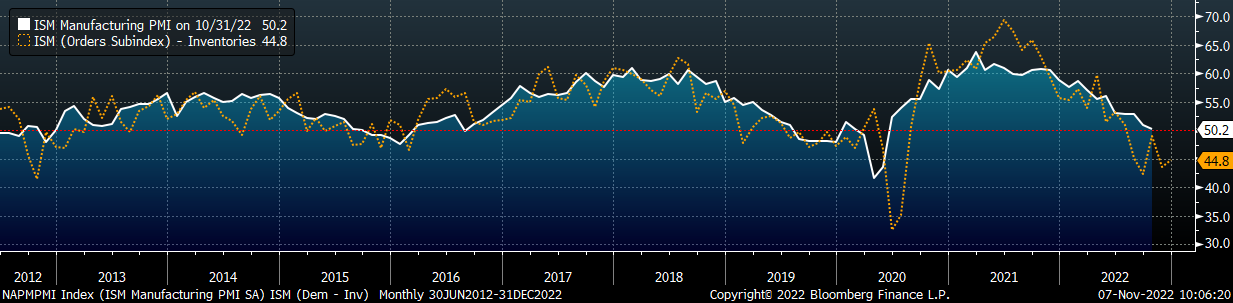
The leading indicator has been pointing to a sharp contraction for 4 of the last 5 months, but the topline manufacturing has remained surprisingly resilient. There are further indications in the data, however, that suggest a slowdown in manufacturing is approaching. The chart below shows the three major demand subindexes in the report, new orders (white), backlog of orders (orange), and new export orders (blue).
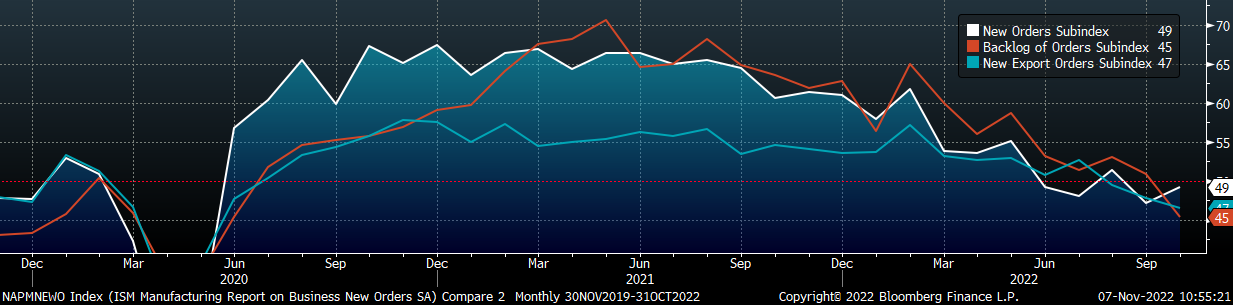
While each of these will fluctuate for different reasons, they have been trending lower since the summer of 2021, and this is the first month that all three contracted. While this does clearly signal a slowdown in demand, it is important to keep the base effect in mind. We have seen record levels of expansion over the past 2 years, and a moderate slowdown would still signify overall demand at higher levels than before the pandemic.
ISM PMI
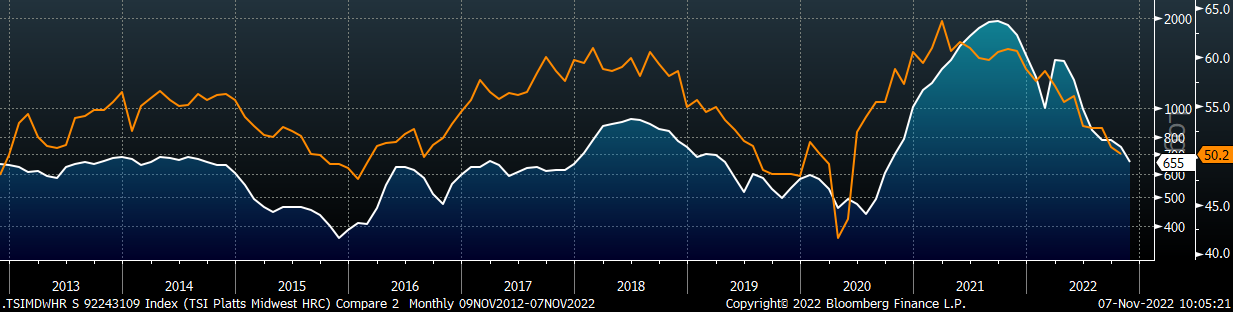
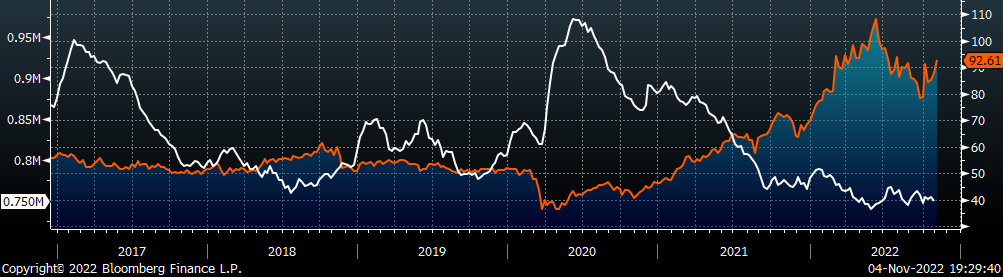
The chart below is the Platts Midwest HRC index (white) and the ISM Manufacturing PMI (orange). Both the HRC price and the topline ISM Manufacturing PMI index are continuing to trend lower. As it stands, the manufacturing index remains slightly in expansion territory at 50.2.
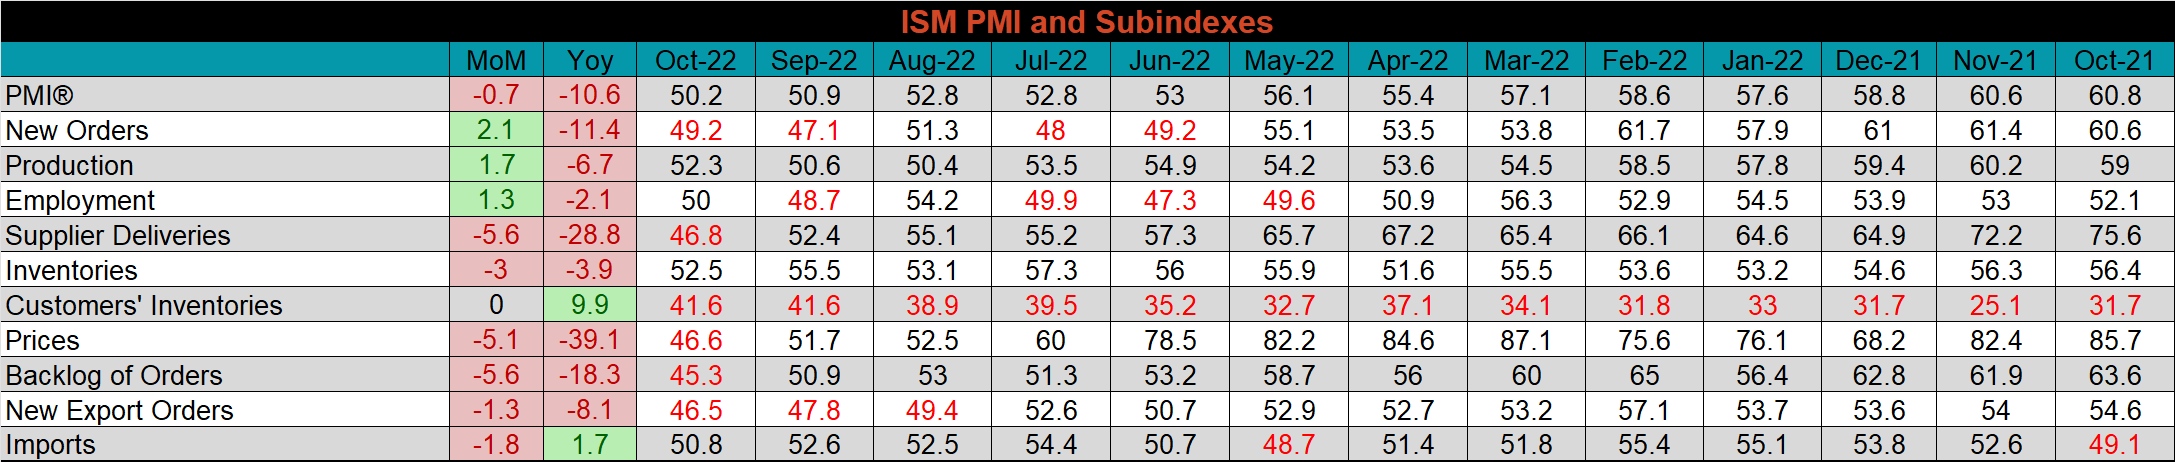
The October ISM Manufacturing PMI and subindexes are below.
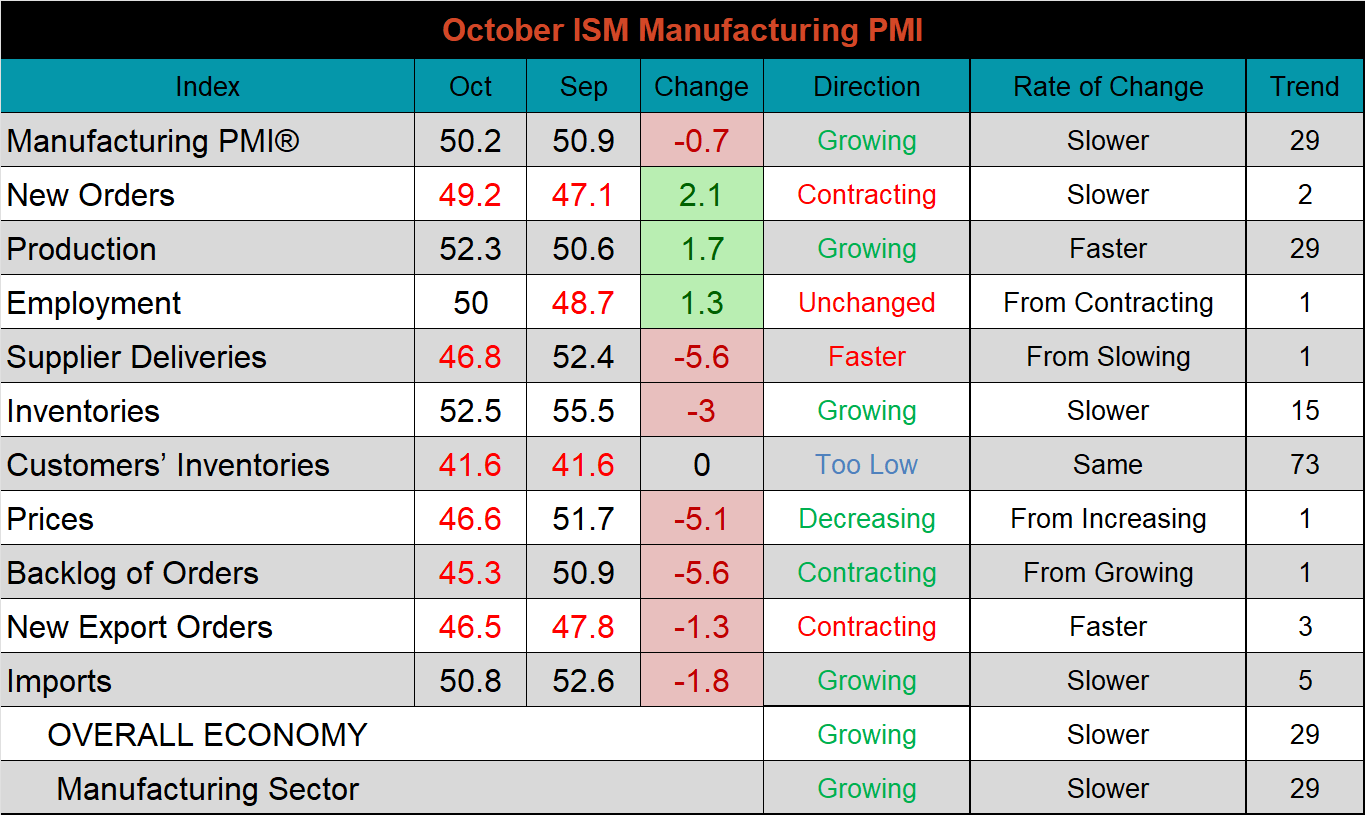
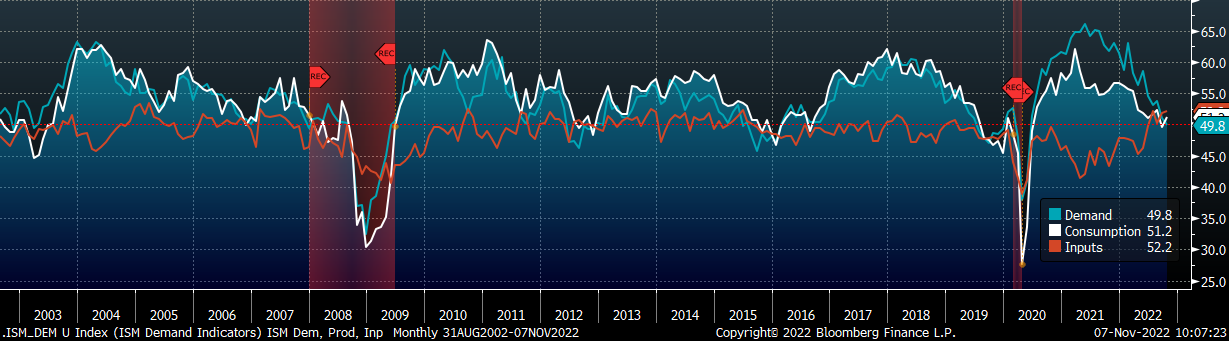
The chart below breaks down all the subcomponents of the ISM Manufacturing report into 3 categories: demand, consumption, and inputs. Earlier in the report we mentioned the significance of the demand side subindexes contracting for the first time since June 2020, but it should also be noted that the consumption and inputs subindexes both increased this week. This was the result of supply chains finally easing to a point where logistics are normalizing, while production and employment both grew. These two dynamics highlight the fact that although demand is trending lower it has not evaporated, and the manufacturing remains resilient.
ISM Manufacturing PMI: Demand (blue), Consumption (white), & Inputs (orange)
The table below shows the historical values of each subindex over the last twelve months.
Global PMI
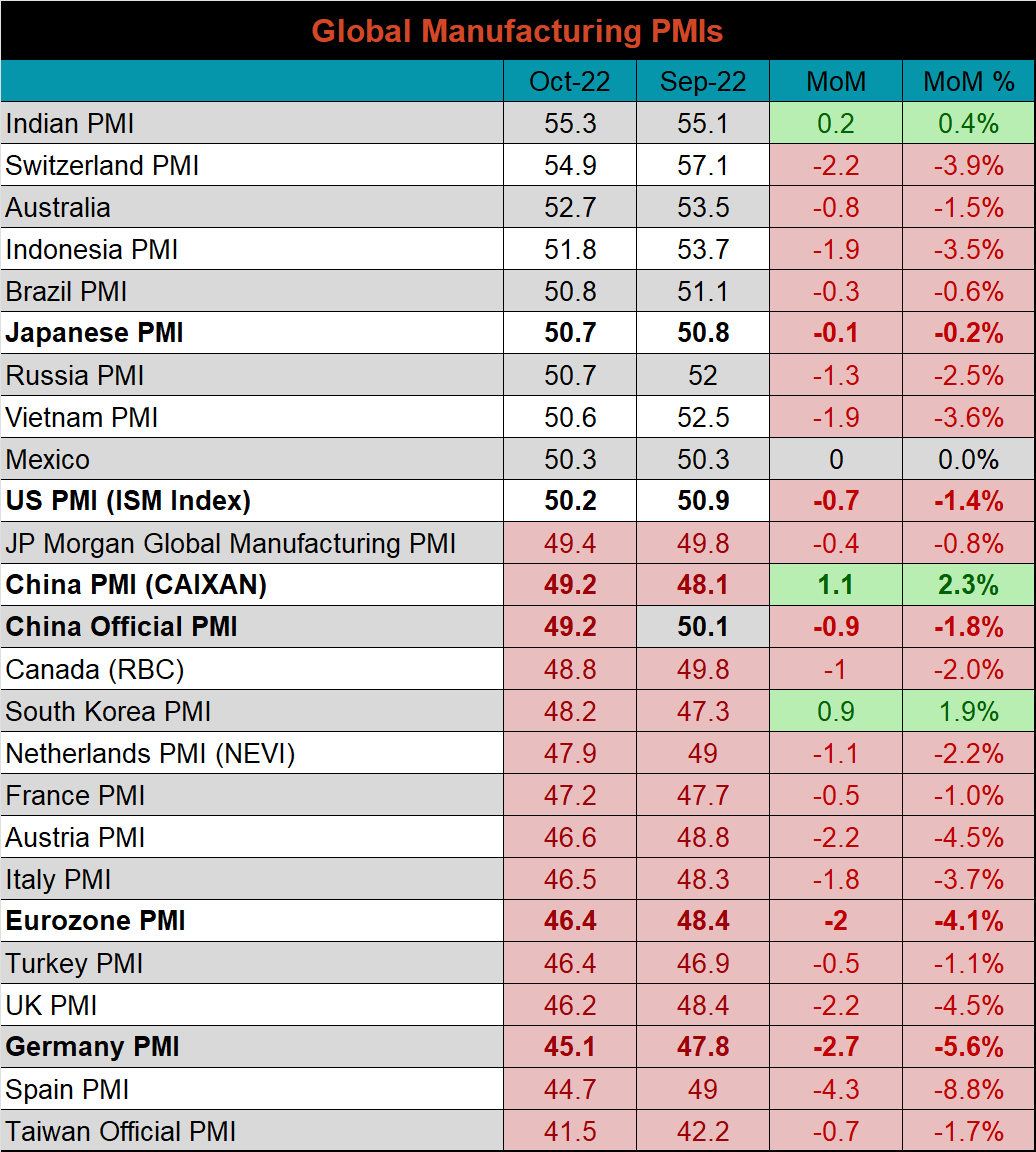
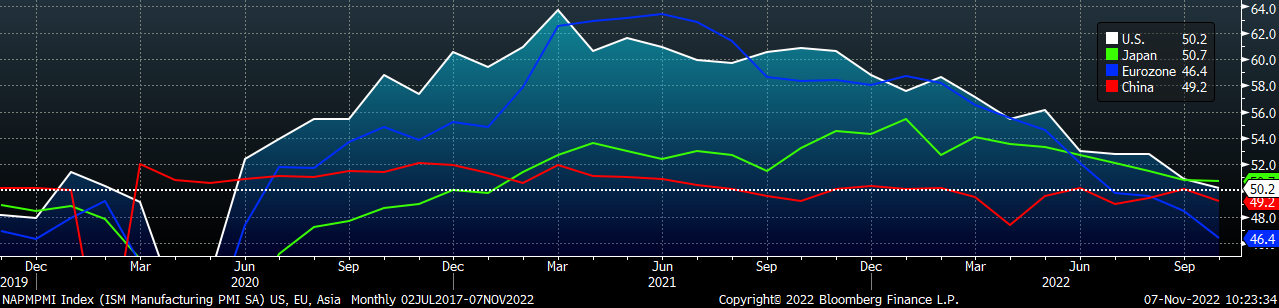
October global PMI data was discouraging again, and highlights concerns around the manufacturing sector abroad. 19 of the 23 monitored global manufacturing sectors printed lower this month, while the official Chinese manufacturing PMI slipped back into contraction territory. Of the major manufacturing sectors (bold), only the U.S. and Japan are still experiencing slow expansion.
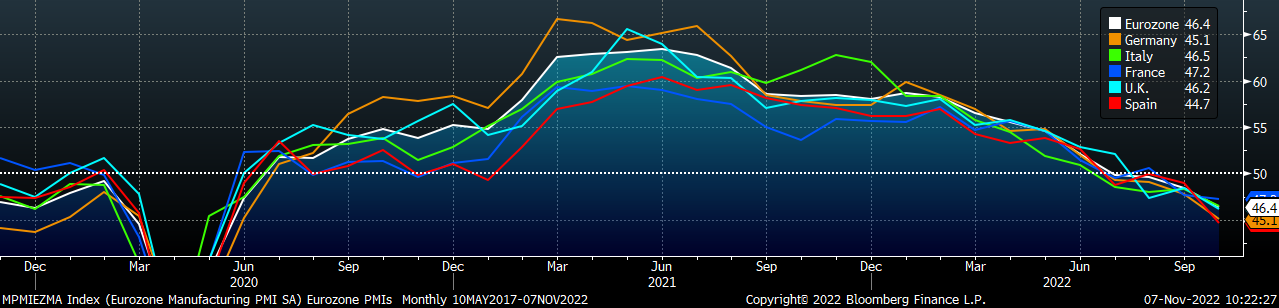
Eurozone (white), German (orange), Italian (green), Spanish (red), and French (blue), U.K. (teal) Manufacturing PMIs
US (white), Euro (blue), Chinese (red) and Japanese (green) Manufacturing PMIs
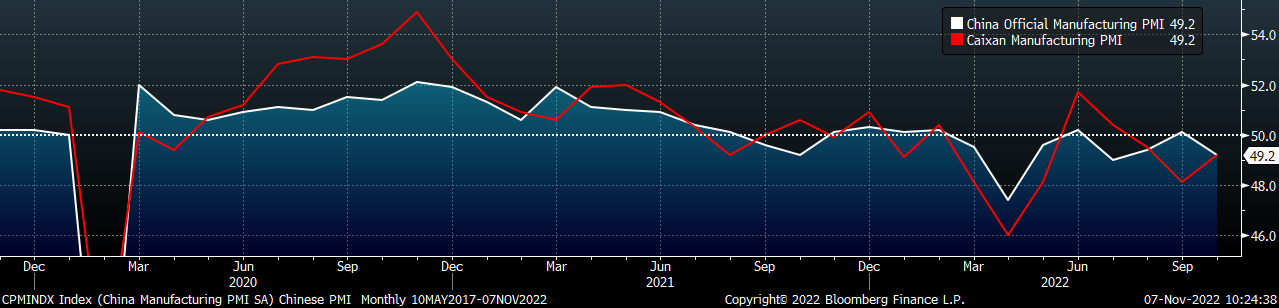
The Caixin PMI and the Chinese official PMI index are both in contraction territory, printing at 49.2.
China Official (white) and Caixan (red) Manufacturing PMIs
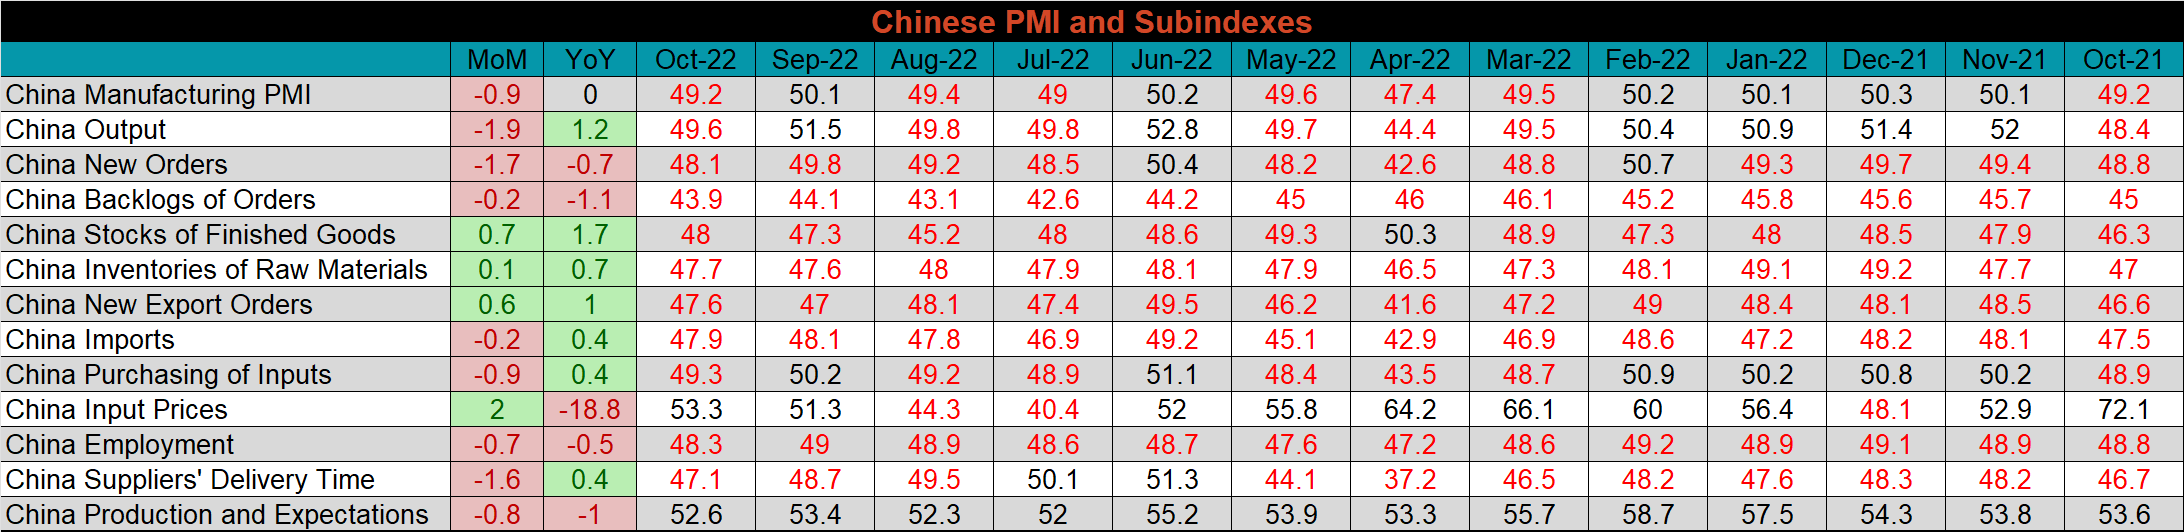
The table below breaks down China’s official manufacturing PMI subindexes. The Chinese manufacturing sector has now experienced contraction in 6 of the last 8 months. The input price subindex saw the most significant MoM increase, while the output subindex was down the sharpest compared to September.
Construction Spending
September seasonally adjusted U.S. construction spending was down 0.7% MoM but continues to be up 8.5%, compared to a year ago. This is the 3rd month in a row that seasonally adjusted growth was negative.
September U.S. Construction Spending
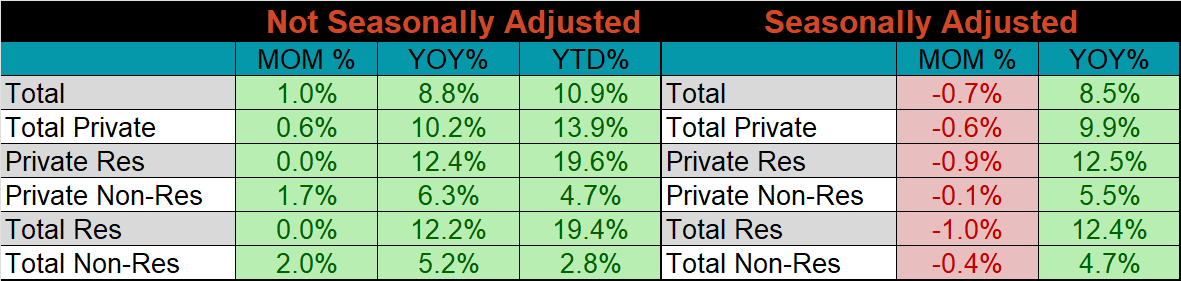
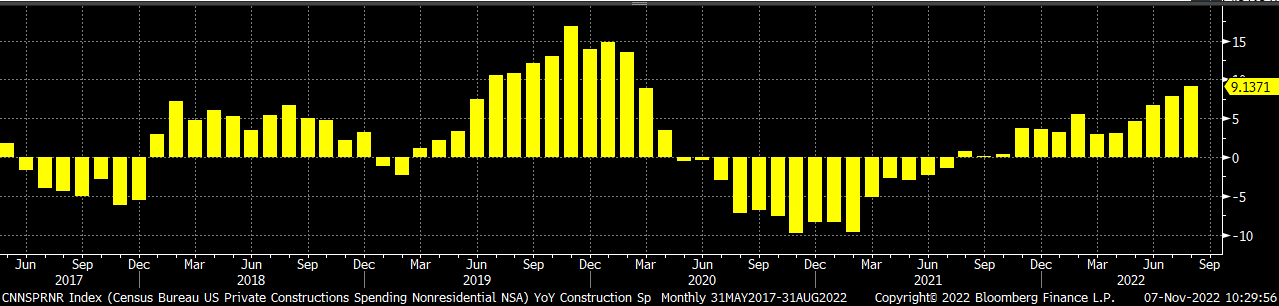
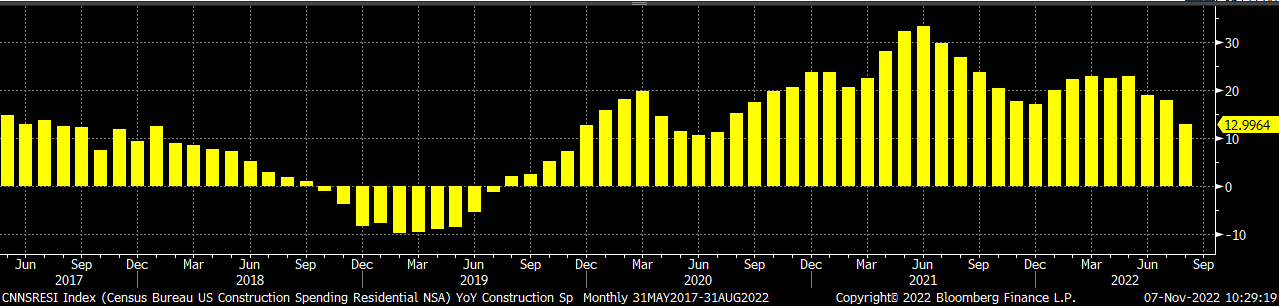
The charts below show the YoY changes in construction spending. Both residential and non-residential spending continue to grow, however non-residential is trending higher, while residential is not.
U.S. Private Nonresidential Construction Spending NSA YoY % Change
U.S. Residential Construction Spending NSA YoY % Change
Auto Sales
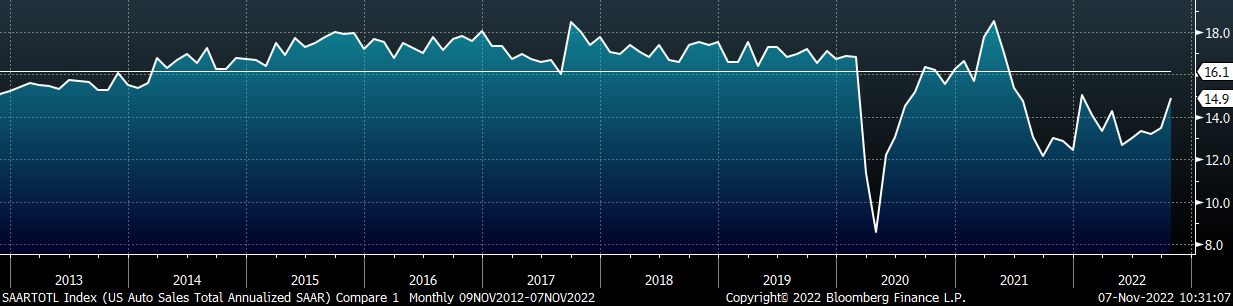
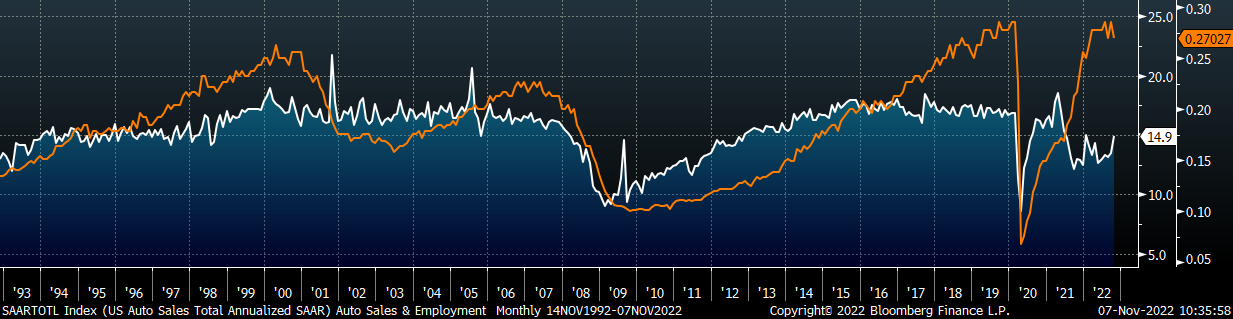
October U.S. light-vehicle sales increased to a 14.9M seasonally adjusted annualized rate (S.A.A.R). This was above expectations of a 14.5M rate and while it remains below the 10-year average of 16.1M, it was a good sign of increased production and availability from the auto sector. The second chart shows the relationship between the unemployment rate and auto sales. The unemployment rate is inverted to show that declining unemployment typically leads to increasing auto sales. This month’s jobs report showed preliminary signs of rolling over, as the October unemployment rate moved back up to 3.7%. This was a case of bad news is good news, because it shows that the labor market is reacting to the Federal Reserves rate hikes which rose another 75 basis points last week. While there is a significant amount of uncertainty in regard to a “soft landing,” the accumulated gap between low unemployment and auto sales continues to point to pent-up demand for steel, in our view.
October U.S. Auto Sales (S.A.A.R.)
October U.S. Auto Sales (white) and the Inverted Unemployment Rate (orange)
Risks
Below are the most pertinent upside and downside price risks:
Upside Risks:
- A sudden dovish shift in financial policy leading to less aggressive rate hikes
- Strategic outages overshooting and causing production to fall below demand levels
- Easing supply chain restraints and labor shortages causing an increase in activity
- Energy issues abroad curtailing global production
- China reopening its economy with further stimulus measures
Downside Risks:
- Economic slowdown caused by increasing interest rates and sustained restrictive policy from the Federal Reserve
- Decreasing input costs allowing mills to aggressively sell lower while remaining profitable
- Increased domestic production capacity leading to an increase in competitive pricing
- Sustained levels of import arrivals keeping pressure on domestic mill pricing
- Limited desire to restock and persistently short lead times causing a “Buyer’s Strike”
HRC Futures
All of the below data points are as of November 4, 2022.
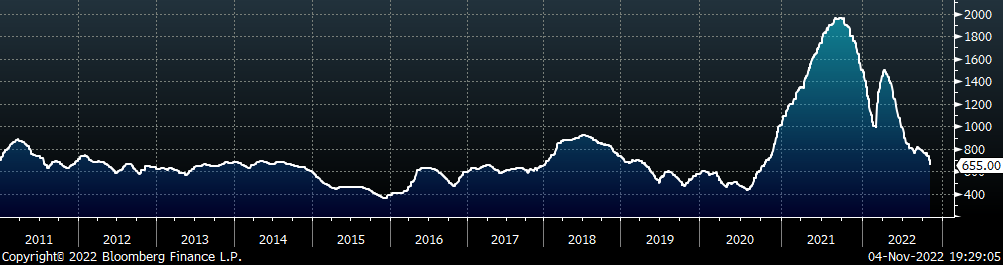
The Platts TSI Daily Midwest HRC Index was down sharply this week, $85 ending at $655.
Platts TSI Daily Midwest HRC Index
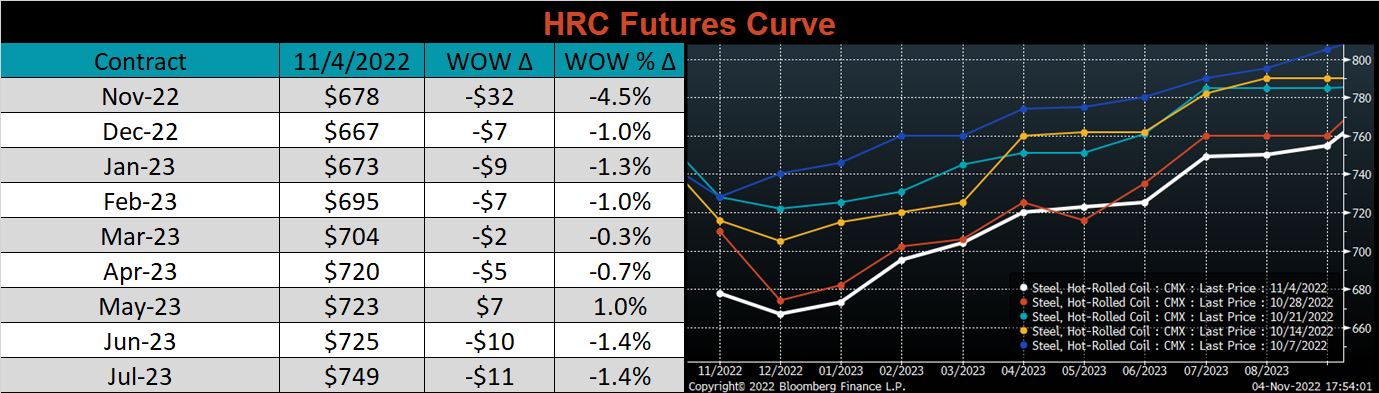
The CME Midwest HRC futures curve is below, with last Friday’s settlements in white. The curve moved sharply lower in the front month, but was down only slightly on the remainder of the curve.
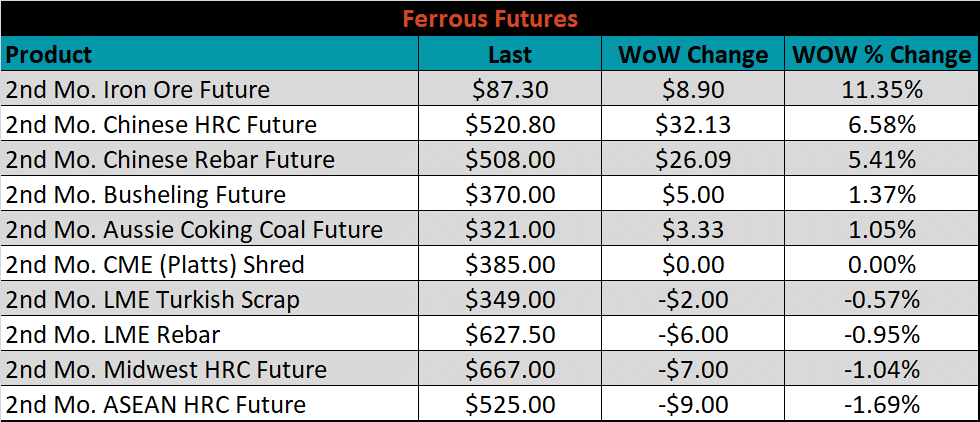
The 2nd month ferrous futures ended the week mixed, iron ore gained 11.4%, while ASEAN HRC lost 1.7%.
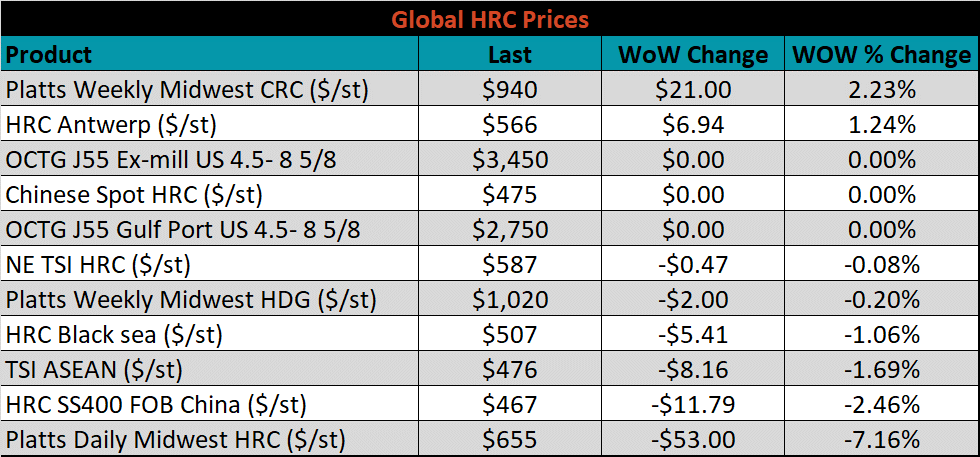
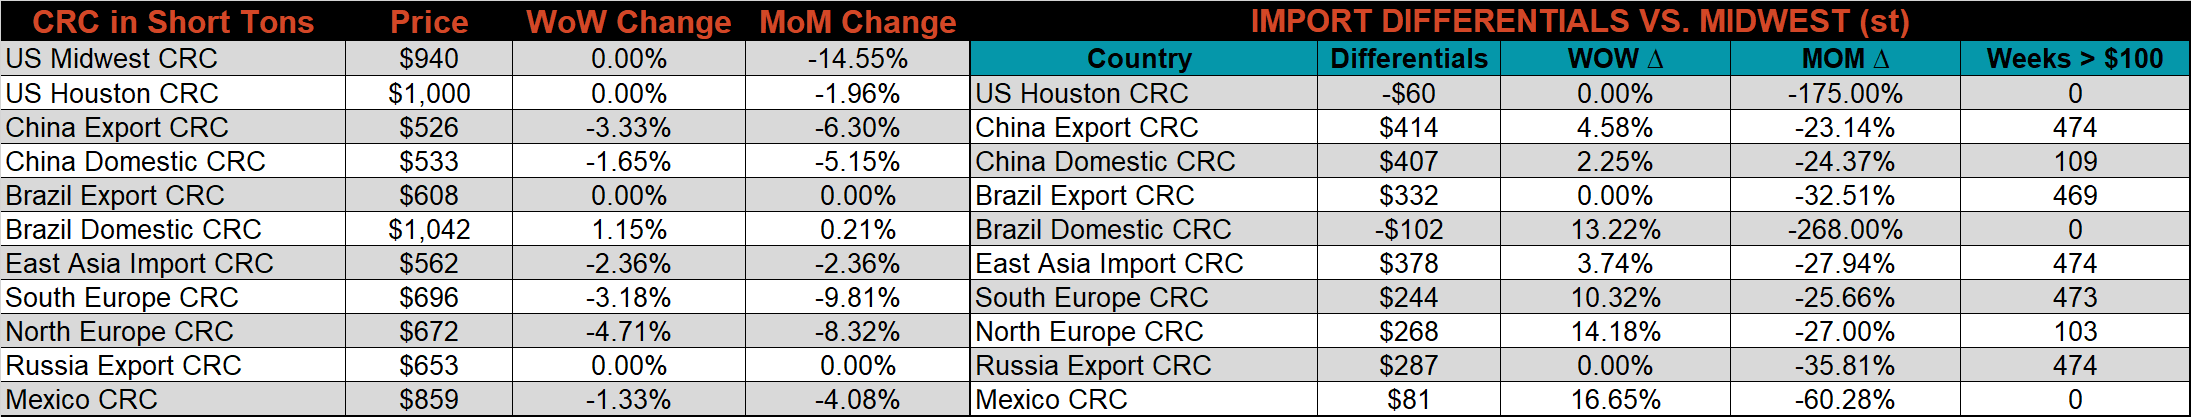
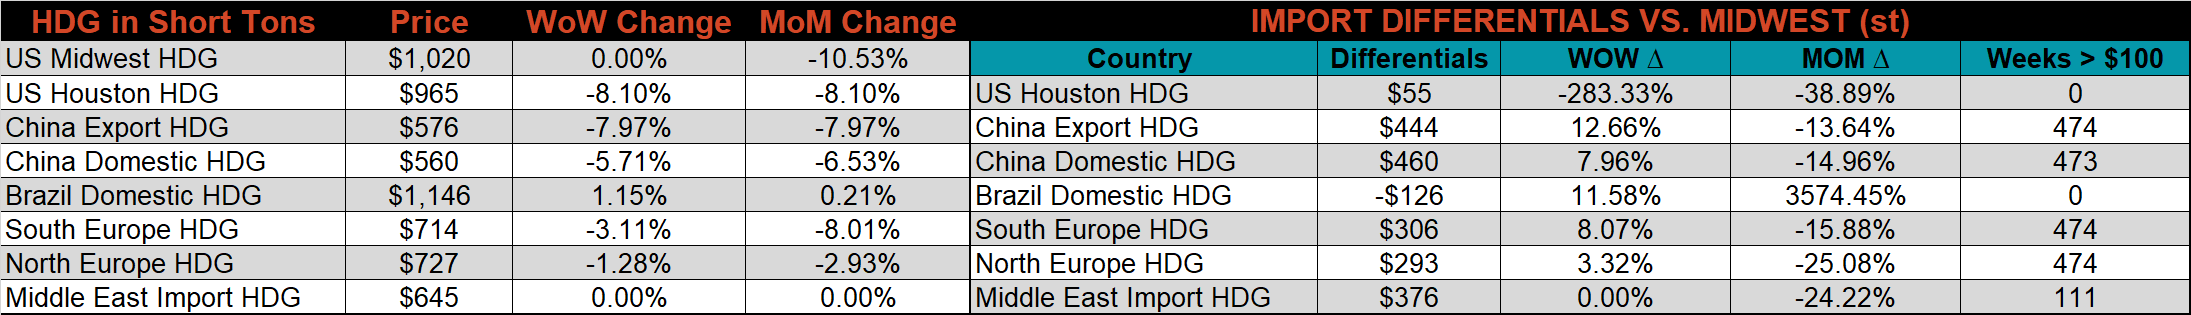
Global flat rolled indexes were mostly lower again last week, led by Midwest HRC, down 7.6%, while Midwest CRC rebounded, up 2.2%.
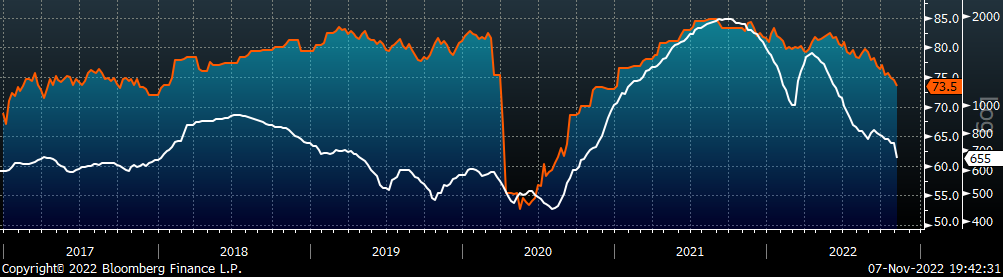
The AISI Capacity Utilization was down another 0.3% to 74.5%.
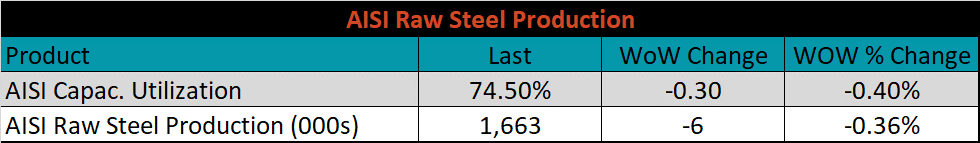
AISI Steel Capacity Utilization Rate (orange) and Platts TSI Daily Midwest HRC Index (white)
Imports & Differentials
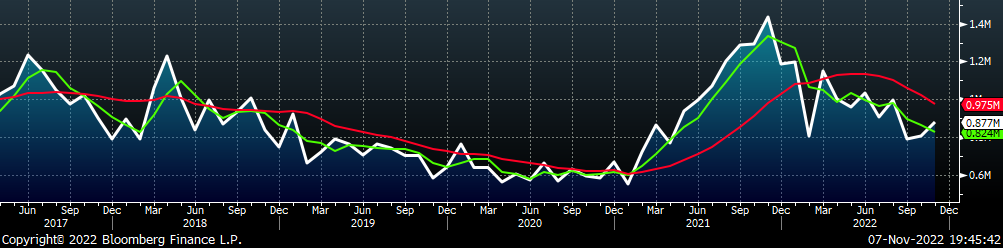
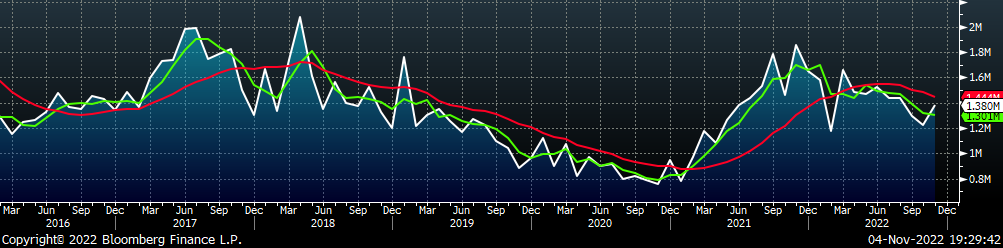
November flat rolled import license data is forecasting an increase of 70k to 877k MoM.
All Sheet Imports (white) w/ 3-Mo. (green) & 12-Mo. Moving Average (red)
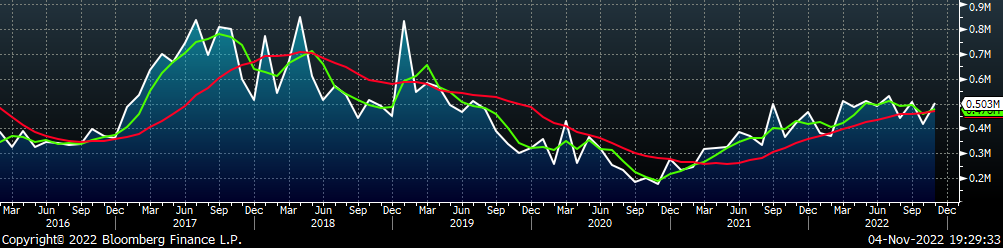
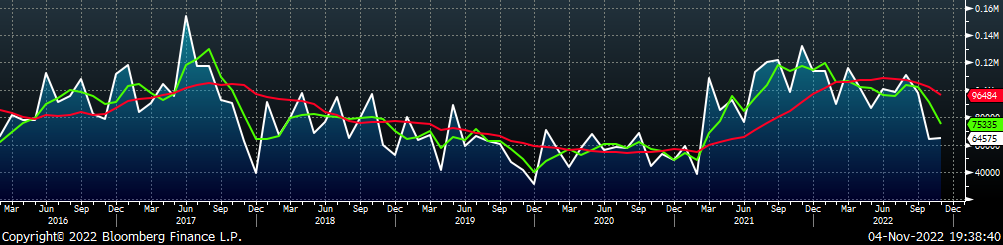
Tube imports license data is forecasting an increase of 84k to 503k in November.
All Tube Imports (white) w/ 3-Mo. (green) & 12-Mo. Moving Average (red)
All Sheet plus Tube (white) w/ 3-Mo. (green) & 12-Mo. Moving Average (red)
November AZ/AL import license data is forecasting an increase of 1k to 65k.
Galvalume Imports (white) w/ 3 Mo. (green) & 12 Mo. Moving Average (red)
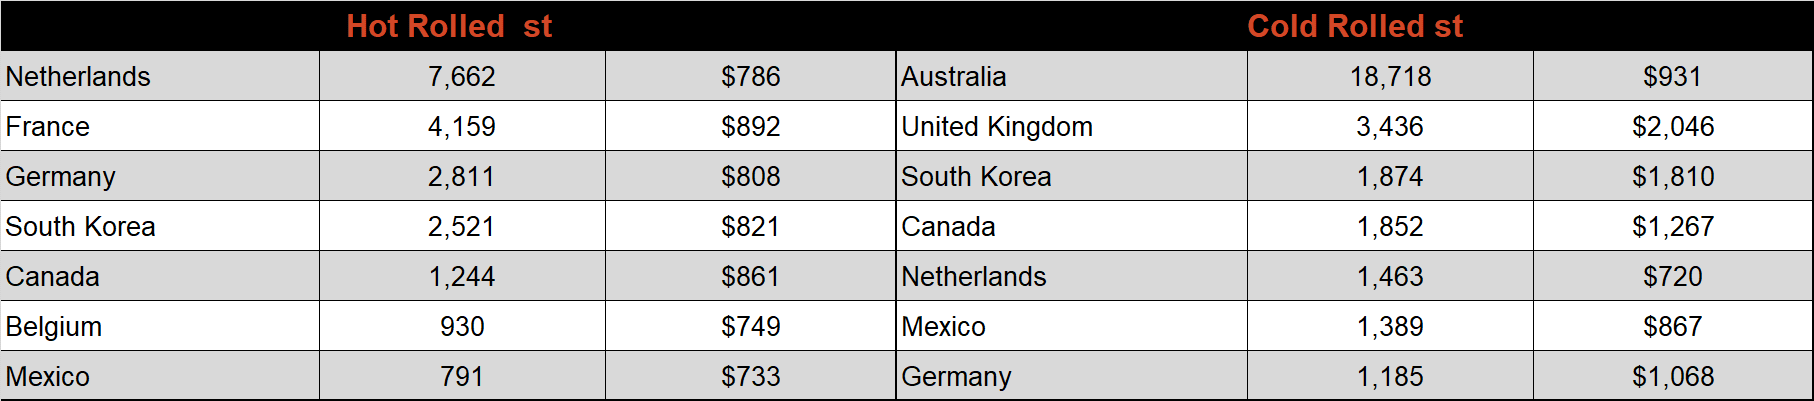
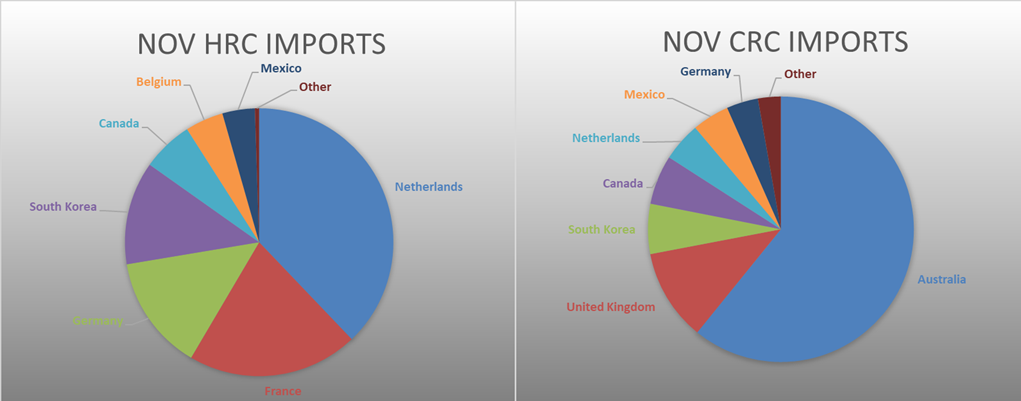
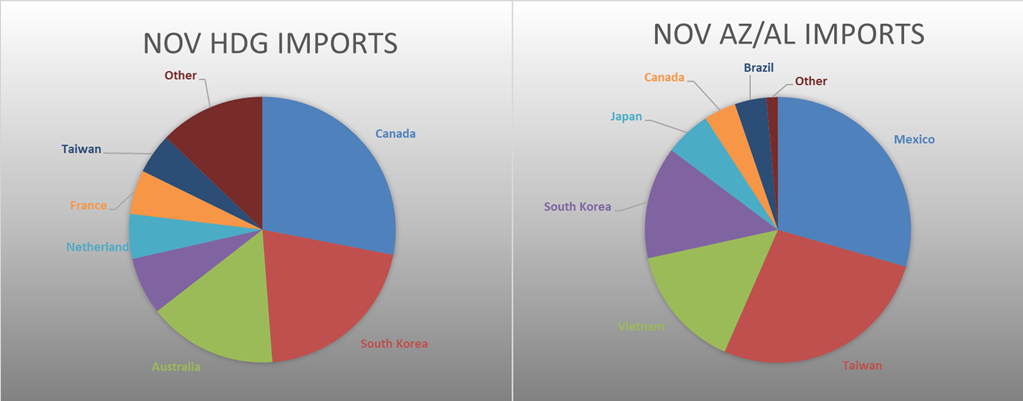
Below is November import license data through November 2nd, 2022.
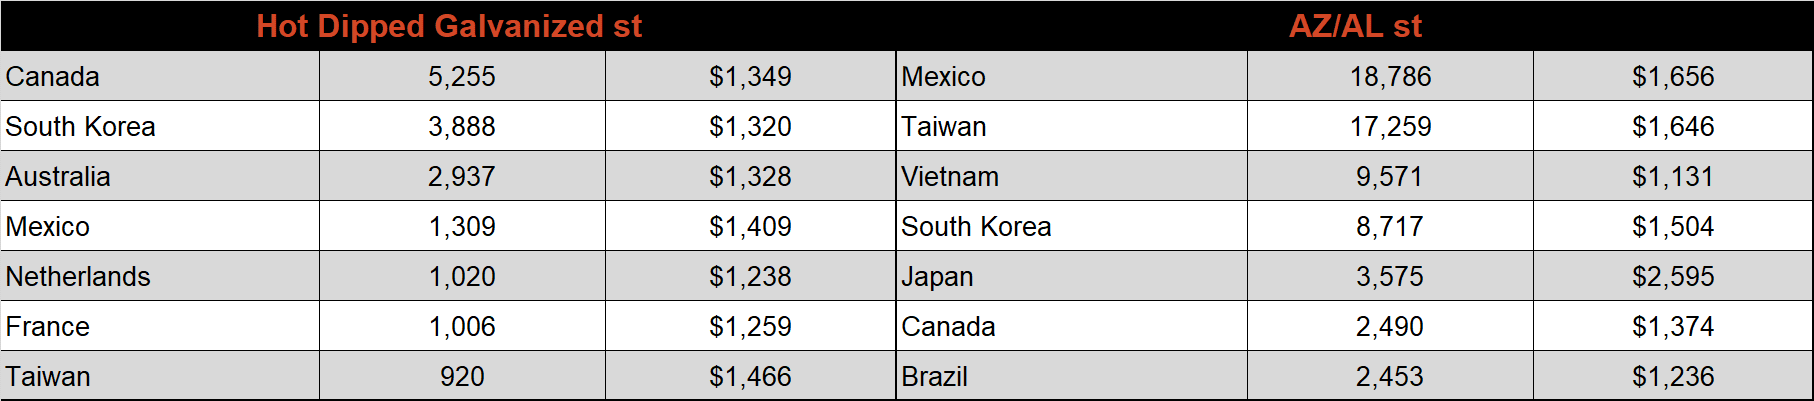
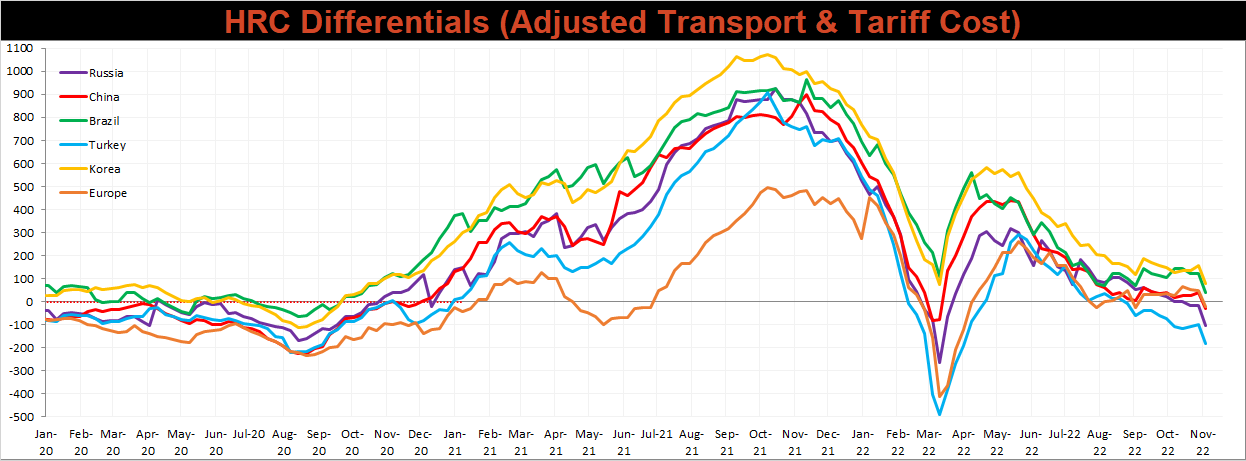
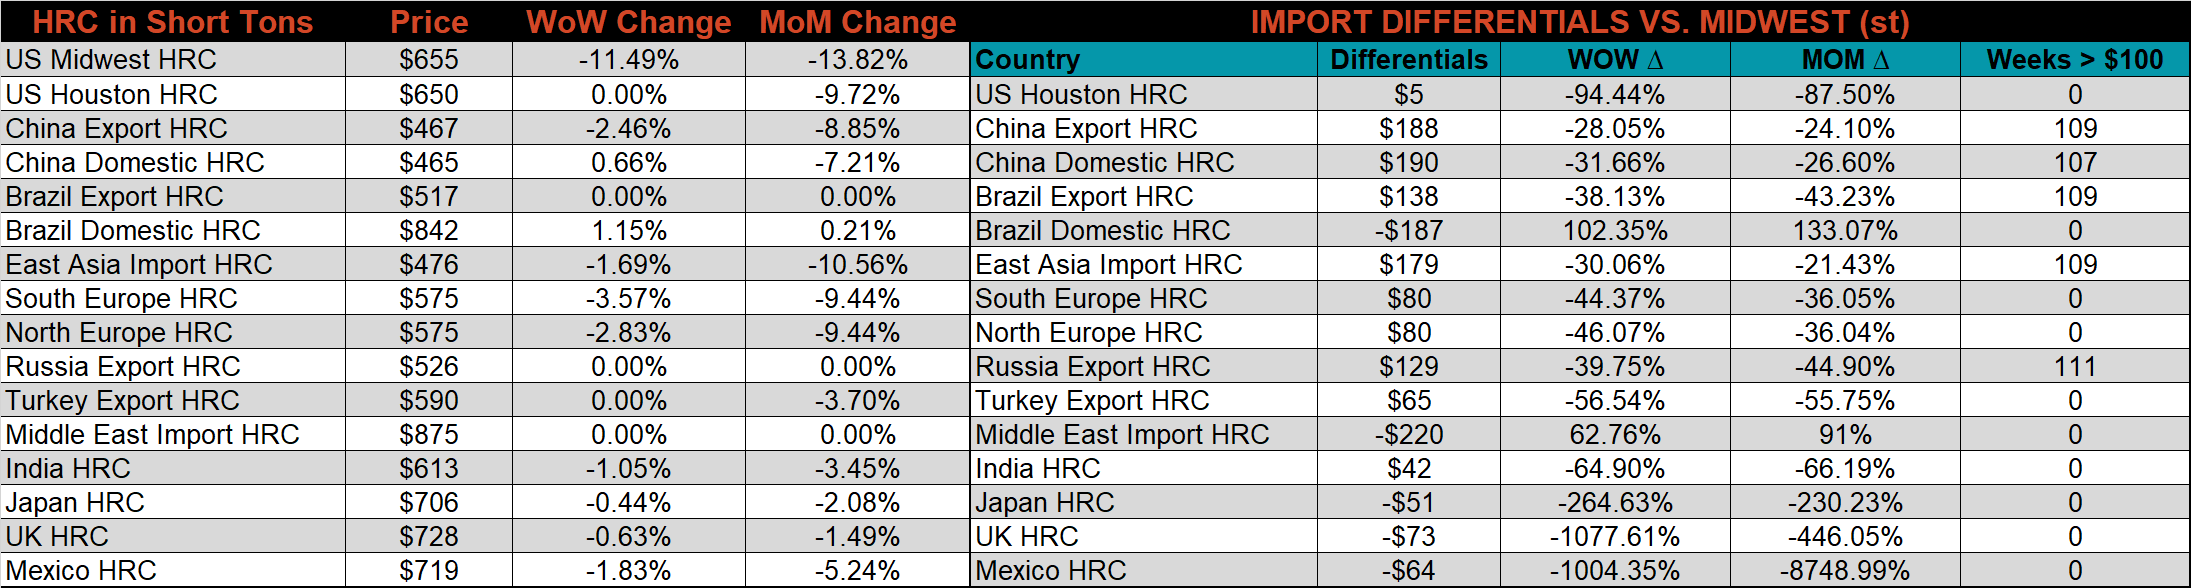
Below is the Midwest HRC price vs. each listed country’s export price using pricing from SBB Platts. We have adjusted each export price to include any tariff or transportation cost to get a comparable delivered price. All the global differentials decreased sharply this week, as the U.S. domestic price decreased far more significantly than the rest of the world. Korea and Brazil are now the only countries with a positive differential, unsurprisingly, both countries are on a quota system.
Global prices were mostly lower again this week, led again by Northern European CRC, down 4.7%.
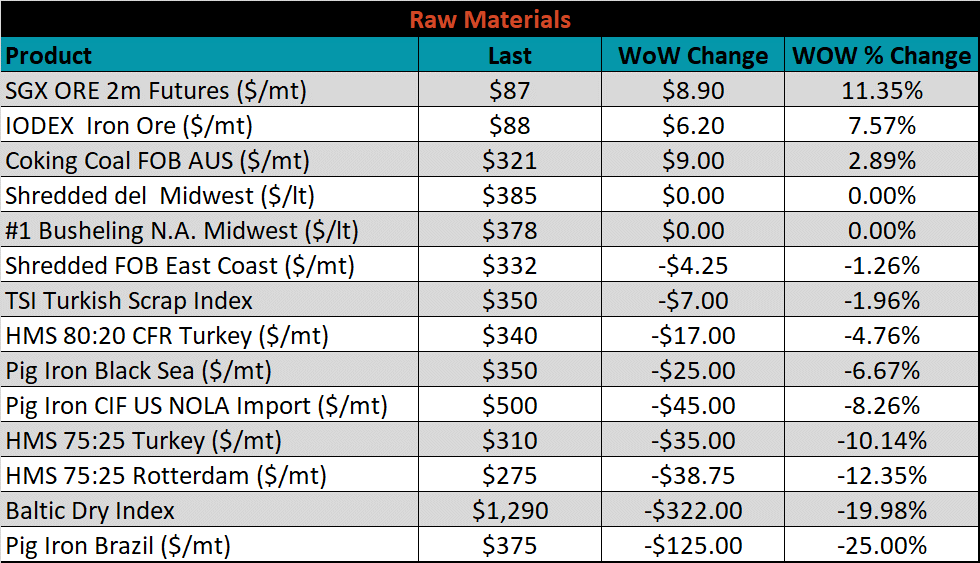
Raw Materials
Raw material prices were mixed again this week, with Brazilian pig iron down sharply, 25%, while the iron ore futures and the IODEX iron ore index both gained, 11.3, and 7.6%, respectively.
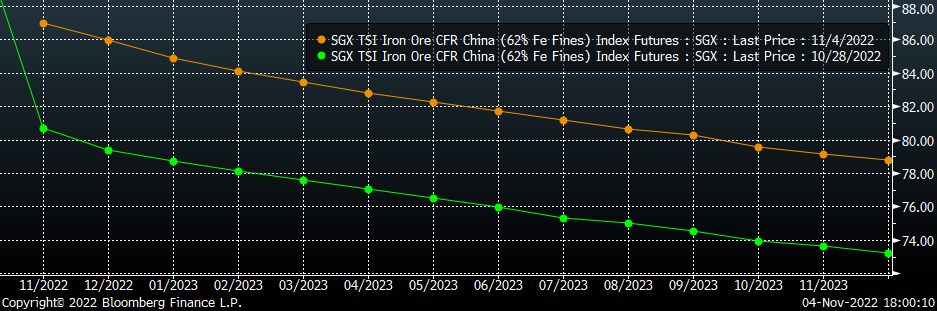
Below is the iron ore future curve with Friday’s settlements in orange, and the prior week’s settlements in green. Iron ore shifted sharply higher at all expirations last week, the rally in price occurred after a steady grind lower in price, resulting in the lowest spot price since before the pandemic.
SGX Iron Ore Futures Curve
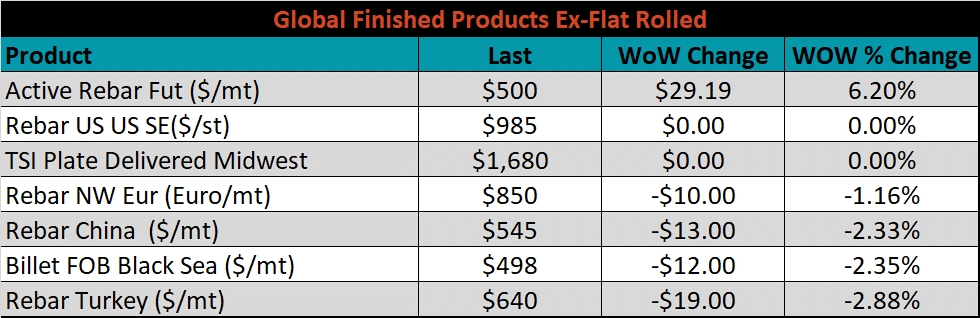
The ex-flat rolled prices are listed below.

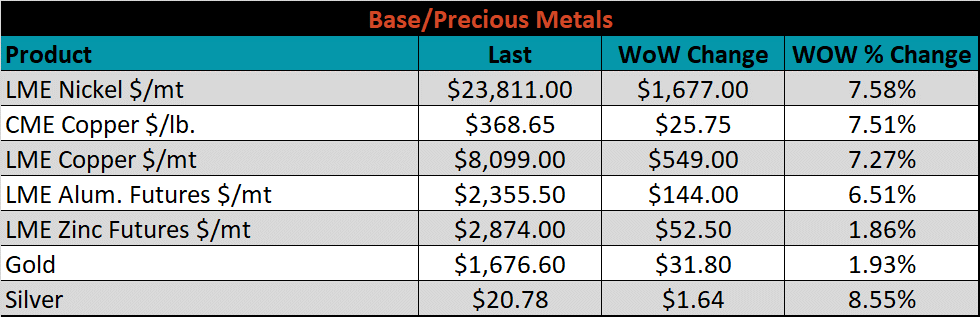
Base & Precious Metals
Base and precious metal futures increased significantly last week. Nickel was up the strongest among base metals, but LME aluminum also showed significant gains, after inventory data signaled demand improvement. Silver was the biggest gainer of the precious metals, up 8.6%, while Gold also saw its first weekly gain in 3-weeks.
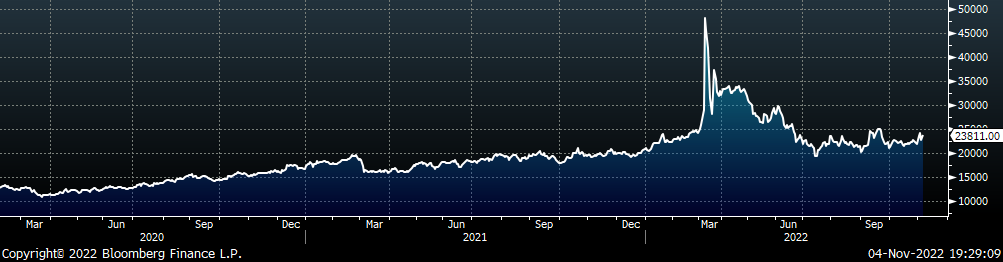
LME Nickel
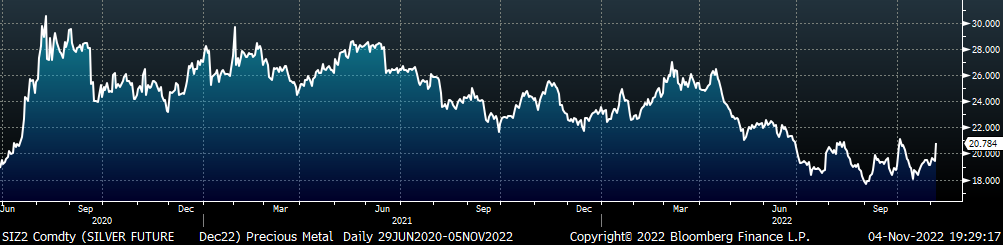
Silver
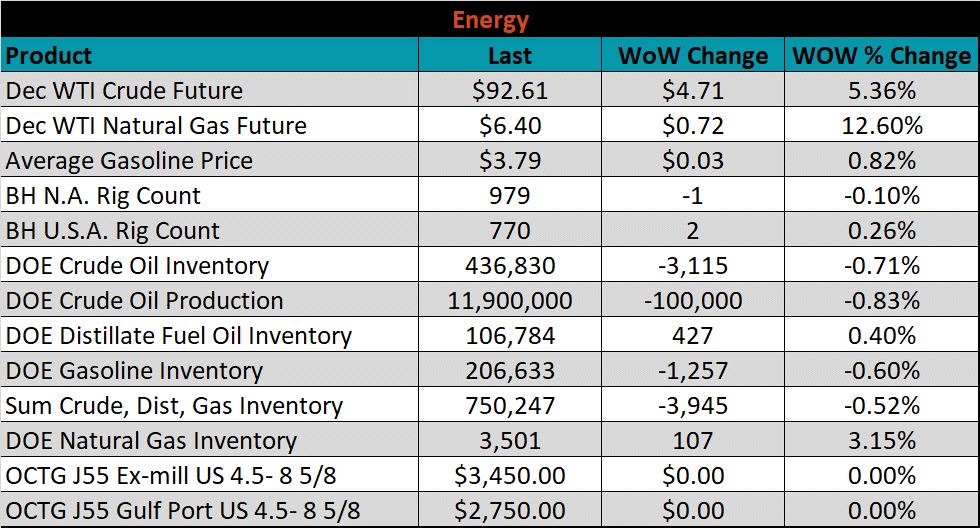
Energy
Last week, the December WTI crude oil future gained another $4.71 or 5.4% to $92.61/bbl. The aggregate inventory level fell 0.5%. The Baker Hughes North American rig count decreased by 1 rig, while the U.S. rig count increased by 2 rigs.
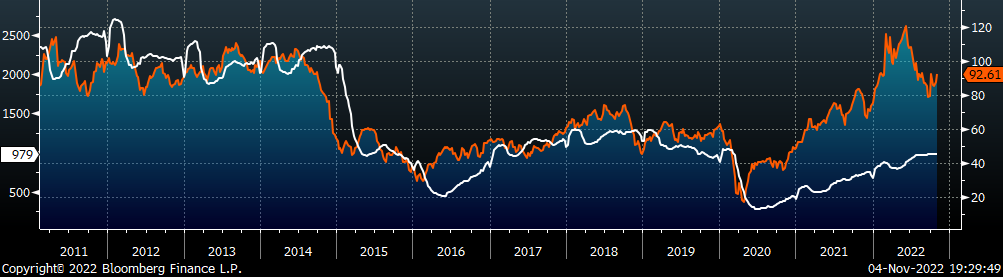
December WTI Crude Oil Futures (orange) vs. Aggregate Energy Inventory (white)
Front Month WTI Crude Oil Future (orange) and Baker Hughes N.A. Rig Count (white)
The list below details some upside and downside risks relevant to the steel industry. The bolded ones are occurring or highly likely.
Upside Risks:
- Inventory at end users and service centers below normal operational levels
- A higher share of discretionary income allocated to goods from steel-intensive industries
- Changes in China’s policies regarding ferrous markets, including production cuts and exports
- Unplanned & extended planned outages, including operational issues leaving mills behind
- Energy issues abroad curtailing global production
- Easing labor and supply chain constraints allowing increased manufacturing activity
- Mills extending outages/taking down capacity to keep prices elevated
- Global supply chains and logistics restraints causing regional shortages
- Fluctuating auto production, pushing steel demand out into the future
- The threat of further protectionist trade policies muting imports
Downside Risks:
- Increased domestic production capacity
- Elevated price differentials and hedging opportunities leading to sustained higher imports
- Steel consumers substitute to lower cost alternatives
- Steel buyers and consumers “double ordering” to more than cover steel needs
- Tightening credit markets, as elevated prices push total costs to credit caps
- Supply chain disruptions allowing producers to catch up on orders
- Limited desire to restock at elevated prices, causing a “Buyer’s Strike”
- Economic slowdown caused by the emergence of Coronavirus Variants
- Reduction and/or removal of domestic trade barriers
- Political & geopolitical uncertainty
- Chinese restrictions in the property market
- Unexpected sharp China RMB devaluation