

November 6, 2020

Market Commentary
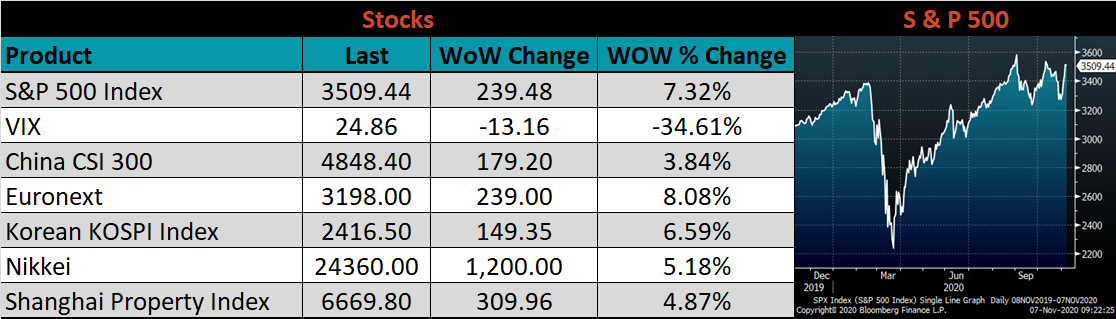
The dynamics affecting the steel market are essentially unchanged over the past week – spot prices moving higher, higher future curve, lead times remain extended and an extremely tight spot market. Even scrap prices traded higher in November, a rarity for this time of year. However, the big news came early this week from Pfizer regarding encouraging results from their Covid-19 vaccine candidate. Markets reacted positively with oil moving up 10%, stocks up 4% and even HRC futures increasing over 3%. An effective vaccine, from the perspective of the steel market, would be constructive for confidence in the recovery and longer-term demand. However, in the immediate term, the effect is likely minimal. There are no signs that the market is loosening, and the current dynamics appear poised to continue. The economic data points in the below report support the strengthening steel demand described in last week’s market commentary. This week’s commentary will focus on the supply side, specifically how the import market may evolve over the coming months.
Many within the steel market have doubted the current rally, pointing to expected furnace restarts and increasing production levels as catalysts for lower prices. However, this has not materialized, and now those who have been left without material are hoping imports may help alleviate this steel shortage come January. Due to tariffs, quotas and extended import lead times, next year is the earliest the domestic market could see any surge in imports. However, to understand the viability of importing material as domestic prices surge, we must also consider prices in around the world. Because of the size and influence of China’s steel market, its price is a proxy for the global price. The below chart shows the Chinese HRC active future on the Shanghai Futures Exchange (in CNY).
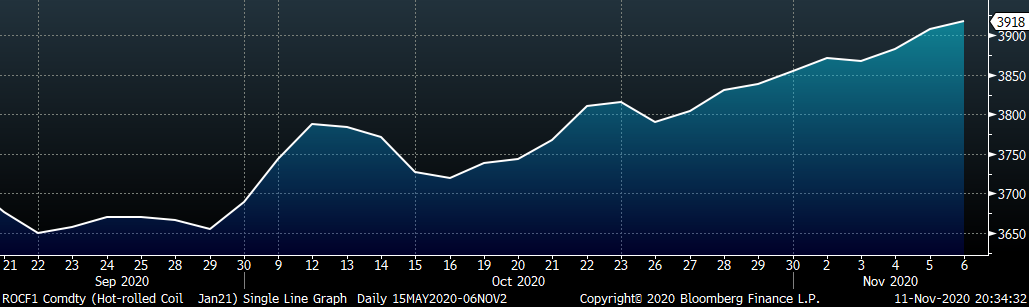
Over the past few months, the Chinese domestic HRC price has also been on a tear, rising to historically high levels. The rally has been driven by robust domestic demand, as significant stimulus aids their economic recovery. However, a rising Chinese, and global, HRC price makes selling material in the United States less attractive. For example, producers in Southeast Asia can export steel to nearby China and attain these higher prices, rather than pay for freight and traders to send their steel to the U.S. Interestingly, China imported more steel this summer than in any time in the recent past.
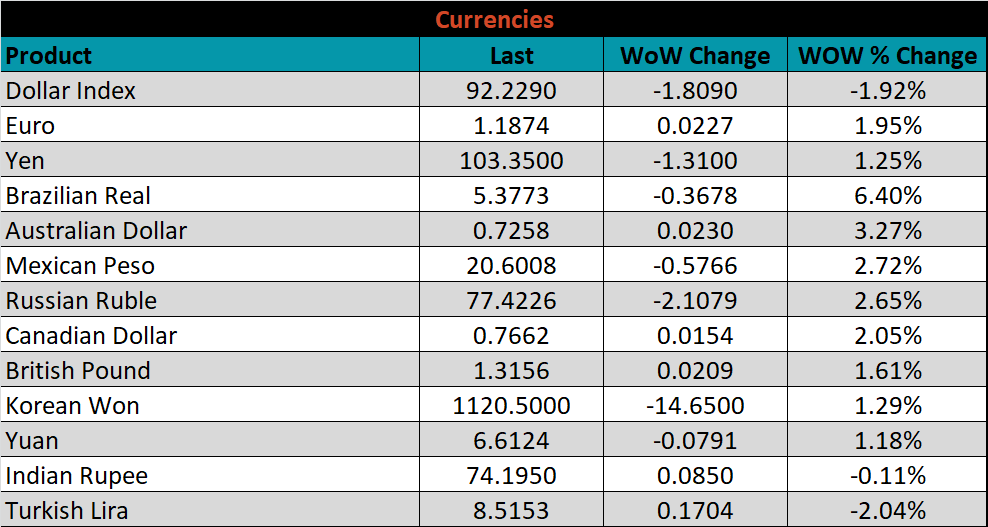
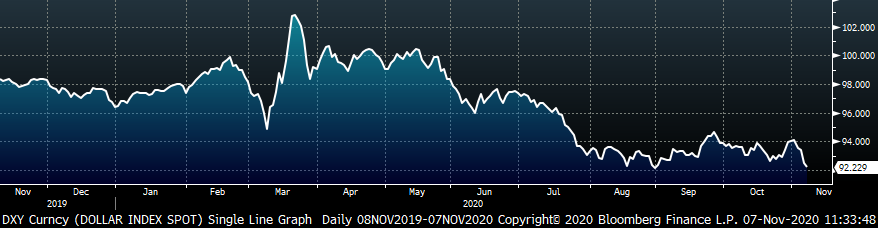
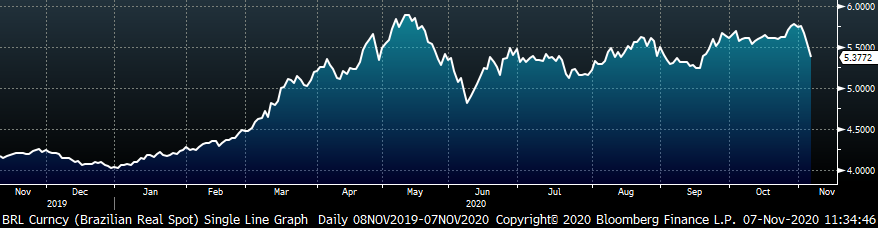
There are a few other considerations when discussing imports. First, a domestic importer must understand how lead times relate to the forward curve prices. For instance, import lead times tend to be 3-4 months, but the price on the domestic forward curve in the first quarter is approximately $50 per ton less than the current spot price. The curve does not predict the future price, but it does allow a buyer to lock in that price for tons in those months. Therefore, the import price should be compared to the price on the curve when the material will arrive. In addition, foreign exchange rates are important in any discussion about global trade. We have seen the US dollar weaken significantly over the past year, meaning it takes more US dollars to buy the same good in a foreign market. This makes it less attractive for both those sending goods to the US and domestic buyers of foreign goods. The above factors all must be understood when attempting to forecast import levels over the next few quarters, and the current dynamics lead us to believe that the domestic steel shortage will not get any significant help from the import market.
ISM PMI
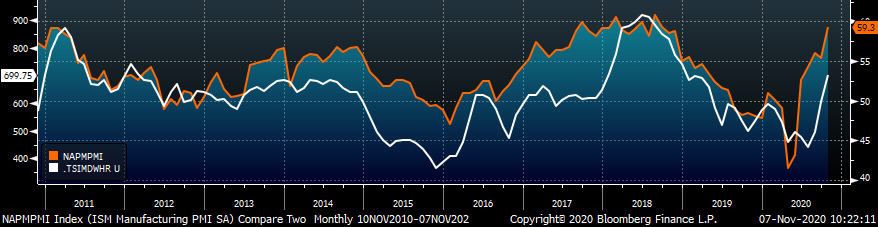
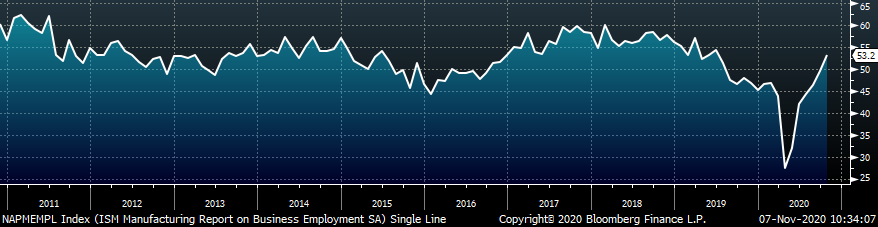
The chart below shows the relationship between the Platts Midwest HRC index and the ISM Manufacturing PMI over the past 10 years.
Platts TSI Daily Midwest HRC Index (white) & ISM Manufacturing PMI (orange)
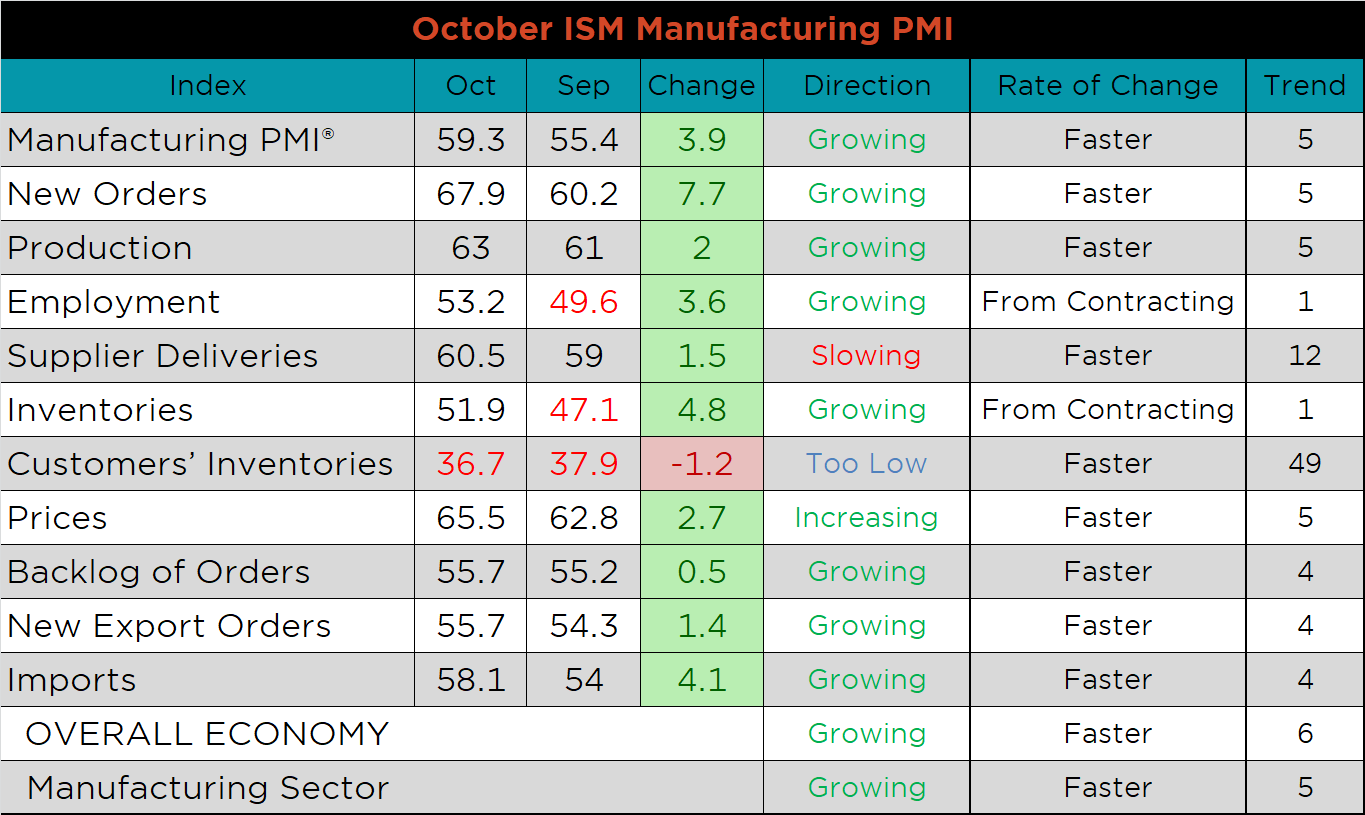
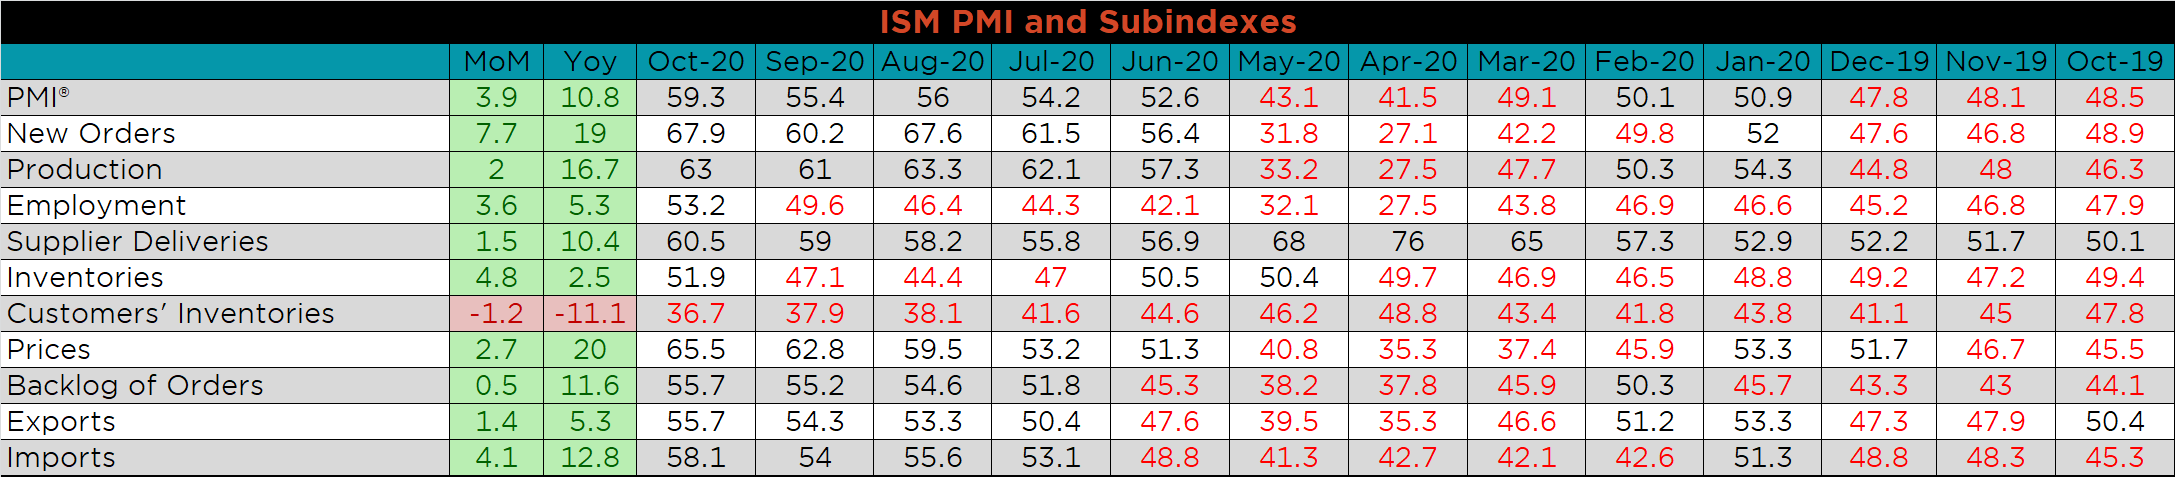
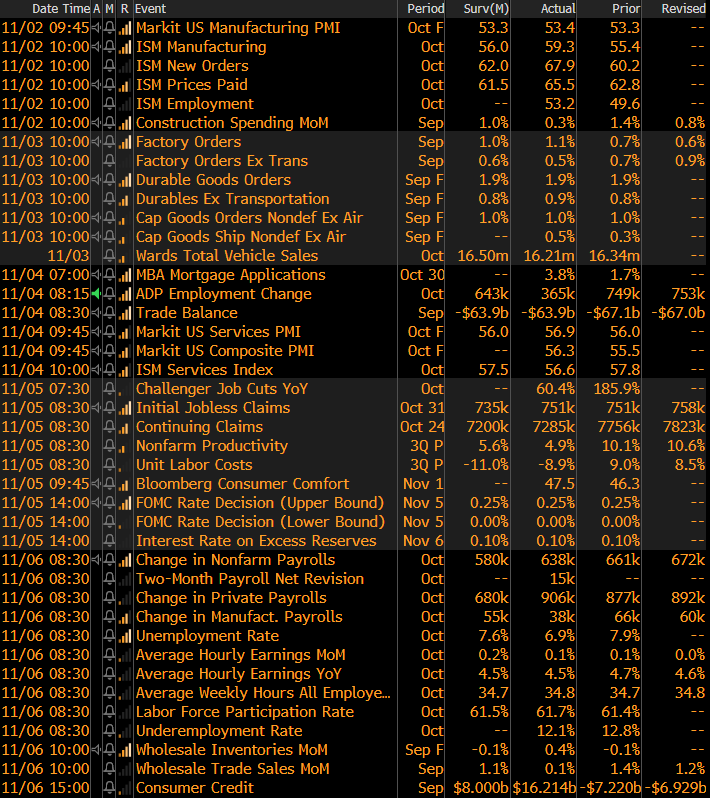
The October ISM Manufacturing PMI and subindexes are below. The topline PMI number jumped 3.9 points to 59.3.
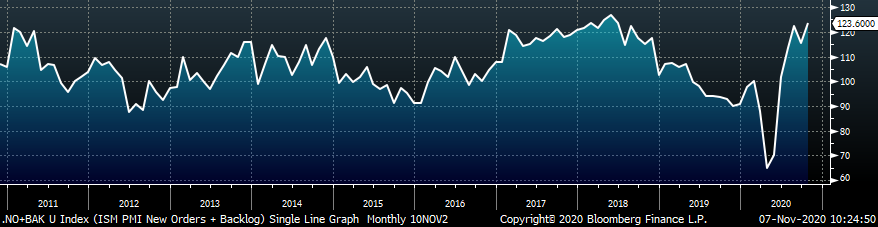
The chart below compares the ISM prices subindex with the ISM customer inventories subindex. The customer’s inventory subindex continued to print lower in the face of an increasing prices subindex. This is in part due to surging demand, shown in the second chart with the new orders plus backlog subindex. Both subindexes remain firmly in expansion, and the new orders subindex increased by 7.7 points. The final chart shows the employment subindex, which moved into expansionary territory for the first time since July 2019. This suggests confidence in the manufacturing recovery, as firms have hire to support increased output.
ISM Manufacturing PMI Customer Inventories Subindex (orange) & Prices Subindex (white)

ISM Manufacturing PMI New Orders plus Backlog Subindexes
ISM Manufacturing Supplier Deliveries Subindex
PMI subindexes were mostly higher MoM and YoY. Customer inventories declined and is the only subindex in contraction. Given the current demand recovery, low customer inventories can propel steel prices dramatically higher.
Global PMI
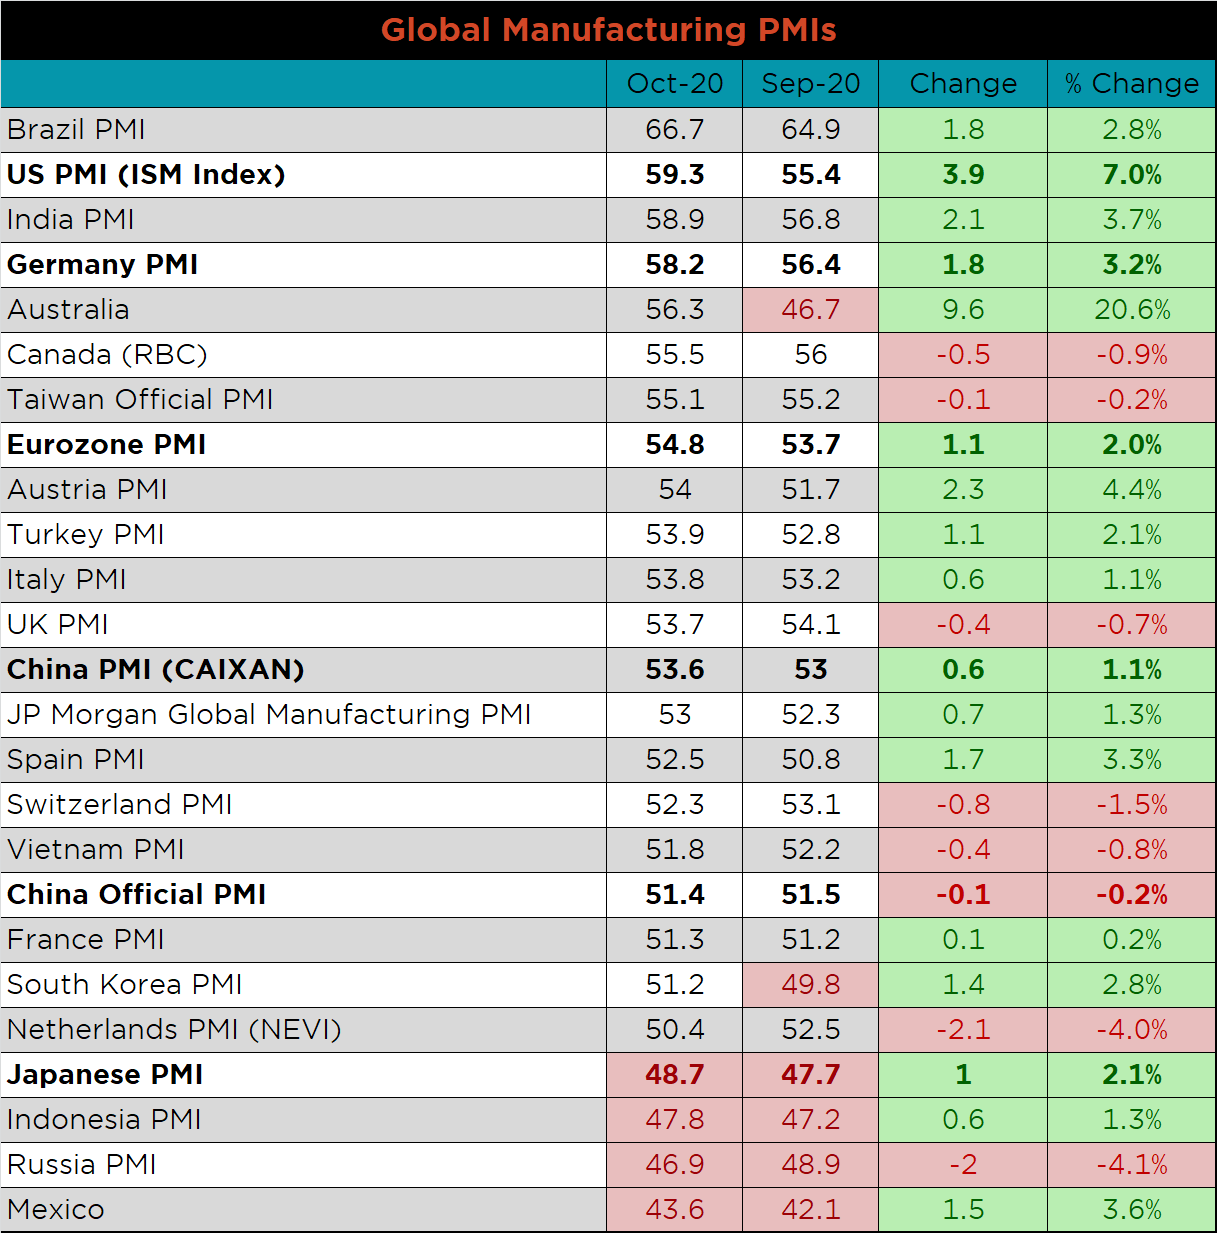
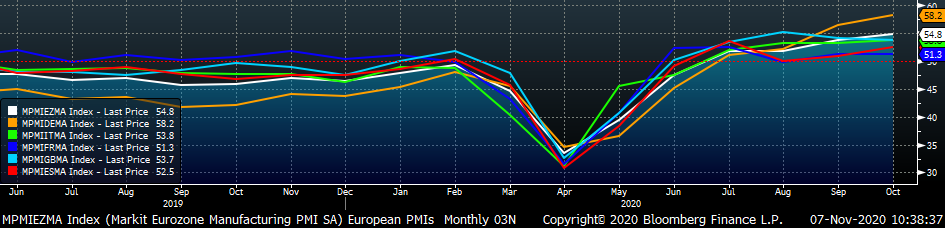
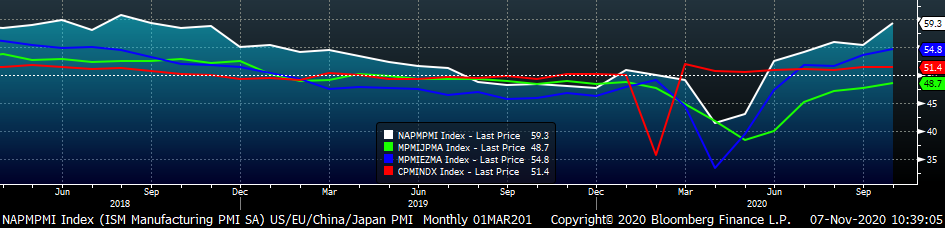
October global PMI printings were strong, with 21 of the 25 watched countries’ PMIs in expansion. PMIs in the US, Germany, the Eurozone, China (Caixan) and Japan all increased, while the China (Official) PMI was only slightly lower. Japan remains the largest economy still in contraction, printing at 48.7.
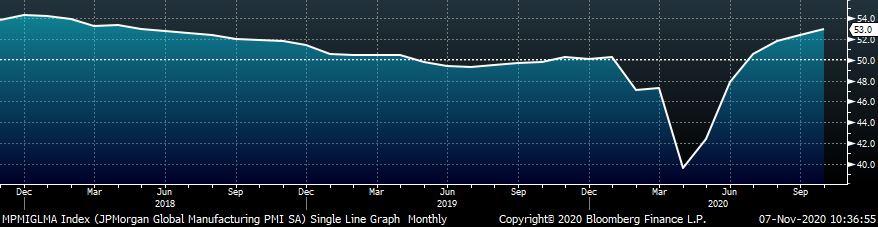
J.P. Morgan Global Manufacturing
Eurozone (white), German (orange), Italian (green), Spanish (red), and French (blue), U.K. (teal) Manu. PMIs
US (white), Euro (blue), Chinese (red) and Japanese (green) Manufacturing PMIs
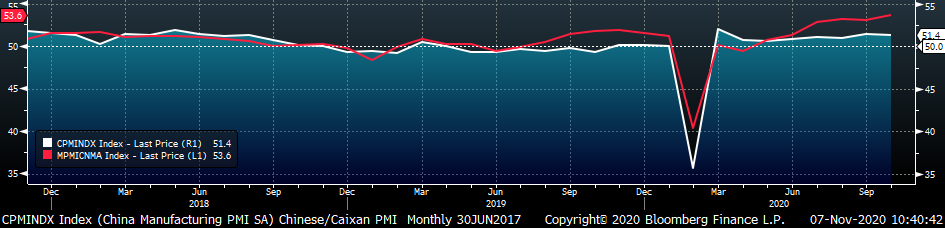
China’s official manufacturing PMI printed slightly lower, while the Caixan PMI increased. Both remain in expansion.
China Official (white) and Caixan (red) Manufacturing PMIs
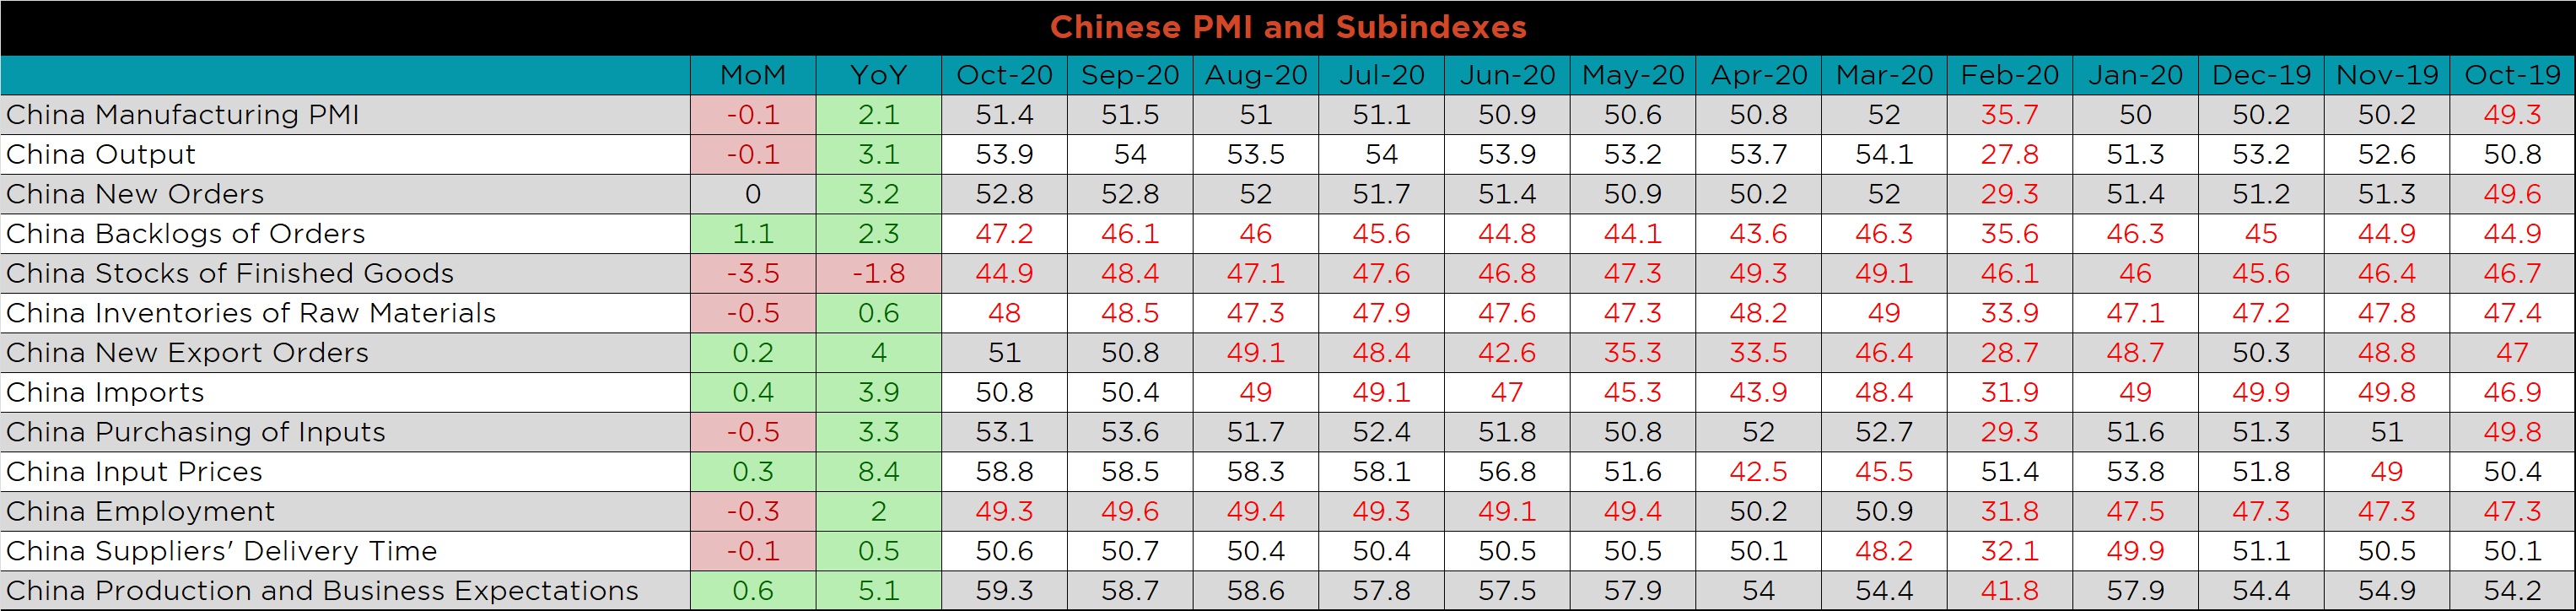
The table below breaks down China’s official manufacturing PMI subindexes, which shows overall expansion. The backlog, new export orders, imports, input prices and business expectations were all higher, while output, stock of finished goods, inventory of raw materials, input purchasing, employment and supplier delivery times were lower.
Construction Spending
September seasonally adjusted U.S. construction spending was up 0.3% compared to August, and 1.5% higher than a year ago.
September U.S. Construction Spending
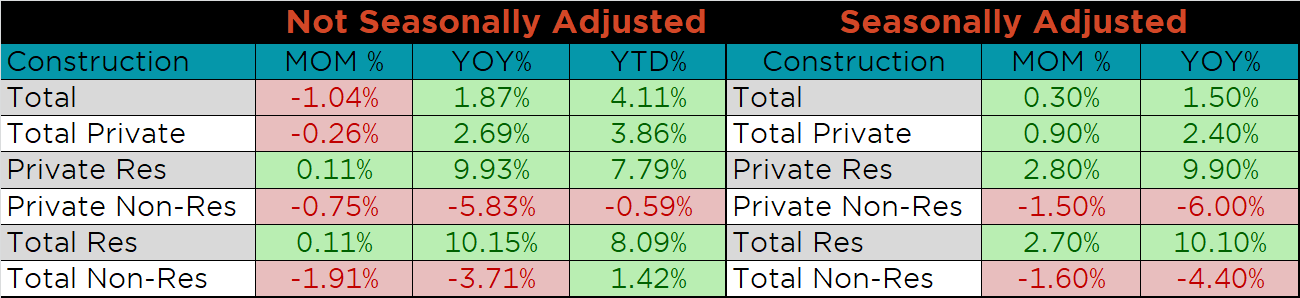
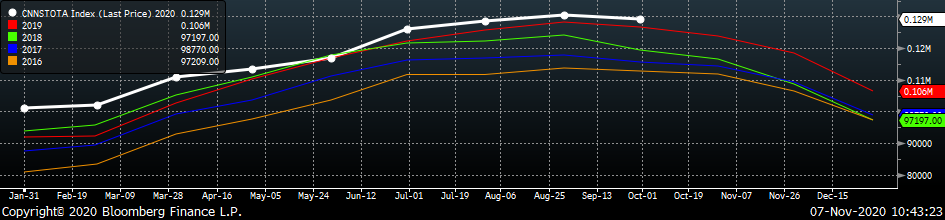
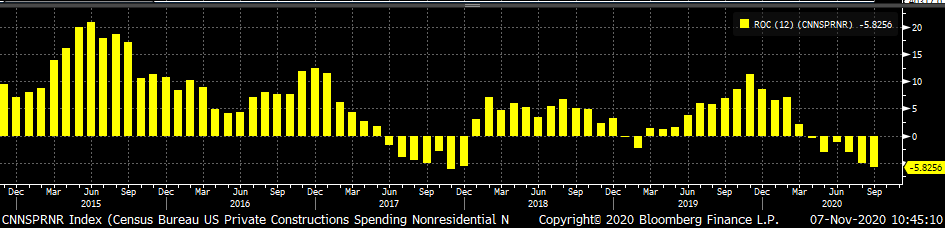
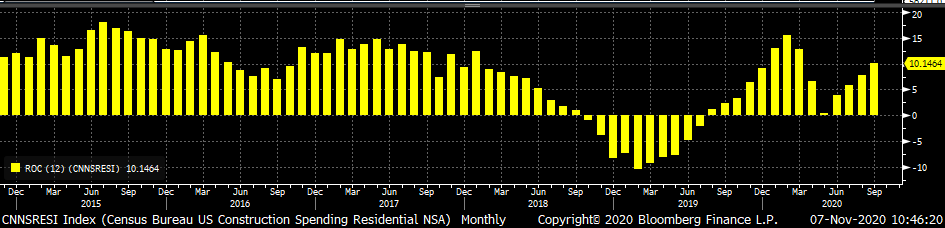
The white line in the chart below represents not seasonally adjusted construction spending in 2020 and compares it to the spending of the previous 4 years. Spending in September was down slightly compared to August, but remains above last year’s levels. The last two charts show the YoY changes in construction spending. Private non-residential spending decreased further in September, the sixth month in a row, while residential spending continues to increase at a more rapid pace.
U.S. Construction Spending
U.S. Private Nonresidential Construction Spending NSA YoY % Change
U.S. Residential Construction Spending NSA YoY % Change
Auto Sales
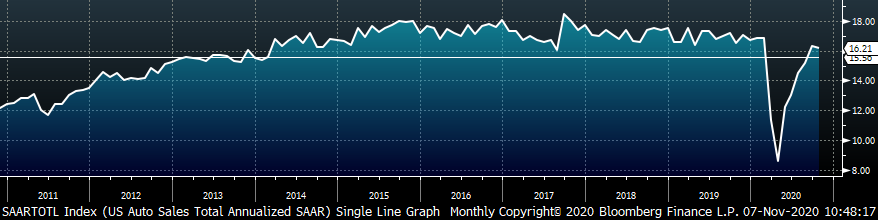
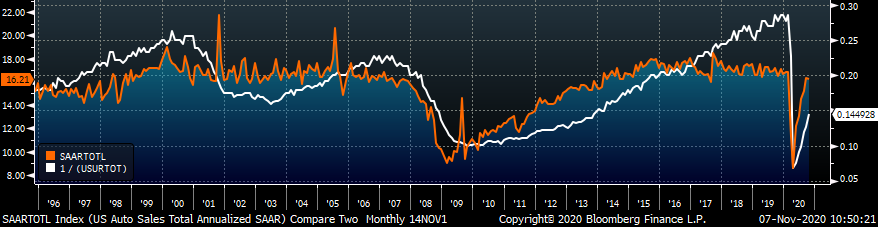
October U.S. light vehicle sales decreased slightly to a 16.2m seasonally adjusted annualized rate (S.A.A.R), but remain above their 10yr average. The second chart shows the relationship between the unemployment rate and auto sales. The unemployment rate is inverted to show that declining unemployment typically leads to increasing auto sales. Auto sales were comparatively flat, while employment continues to improve.
October U.S. Auto Sales (S.A.A.R.)
October U.S. Auto Sales (orange) and the Inverted Unemployment Rate (white)
Risks
Below are the most pertinent upside and downside price risks:
Upside Risks:
- Unplanned & extended planned outages
- Economic stimulus measures including Infrastructure package and low interest rates
- Strengthening global (Asia, Europe, CIX, Turkey) flat rolled prices
- Elevated iron ore prices
- Chinese economic stimulus measures
- Low current and expected import levels
- Declining/low inventory levels at end users and service centers
- Increasing commodity pricing due to a weakening US Dollar
- Lifestyle shifts supporting steel intensive industries
Downside Risks:
- Increased domestic production capacity
- Coronavirus induced economic shutdowns
- Weak labor markets
- Weaker demand in energy and construction
- Political & geopolitical uncertainty
- Reduction and/or removal of domestic trade barriers
HRC Futures
All of the below data points are as of November 6, 2020
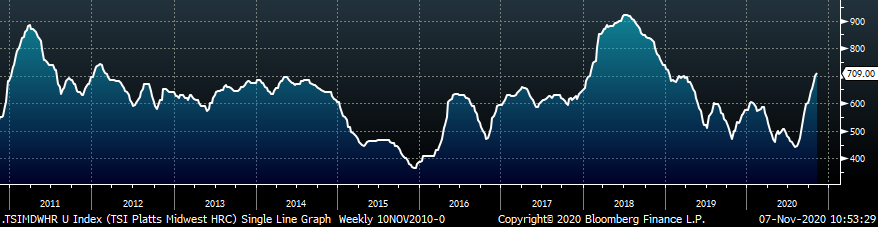
The Platts TSI Daily Midwest HRC Index increased by $9.25 to $709.
Platts TSI Daily Midwest HRC Index
The CME Midwest HRC futures curve is below with last Friday’s settlements in white. The curve shifted significantly higher in the near term expirations last week.
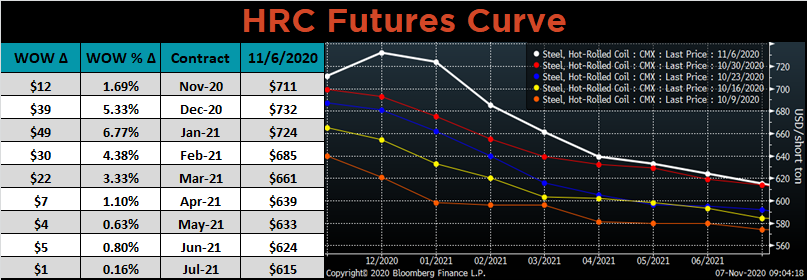
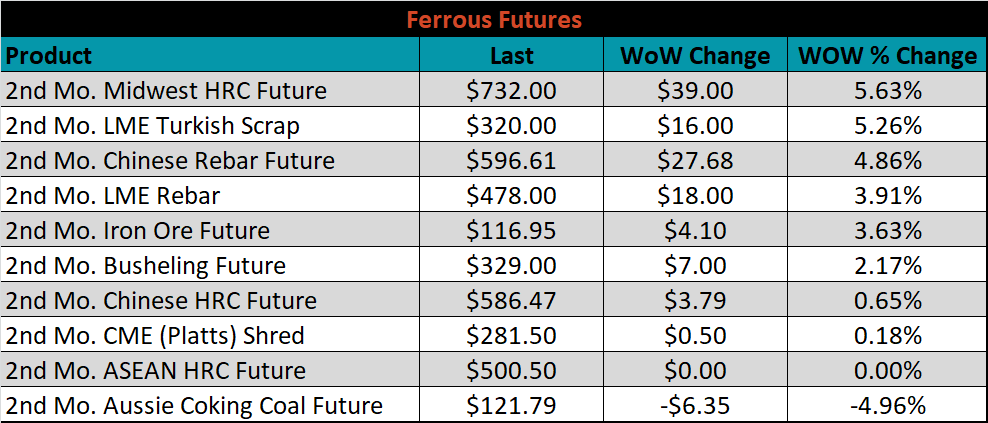
December ferrous futures were mostly higher. Midwest HRC gained 5.6%, while Aussie coking coal fell 5%.
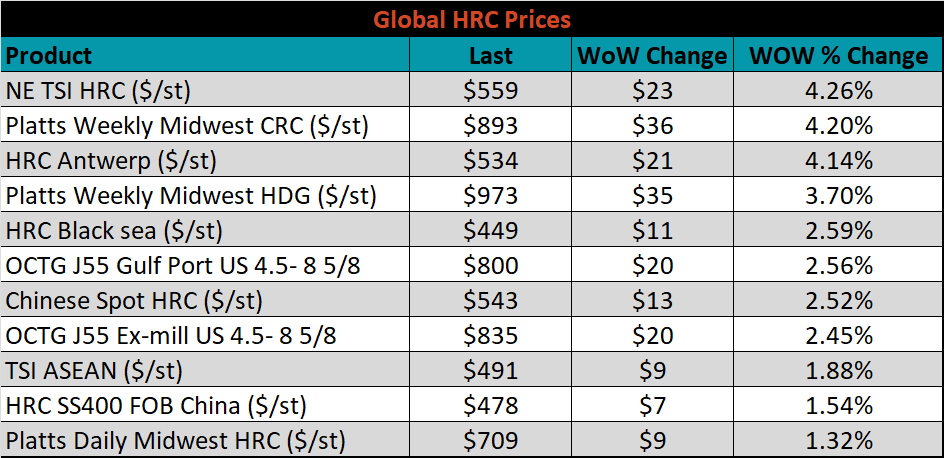
The global flat rolled indexes were all higher, led by TSI Platts Northern European HRC, up 4.3%.
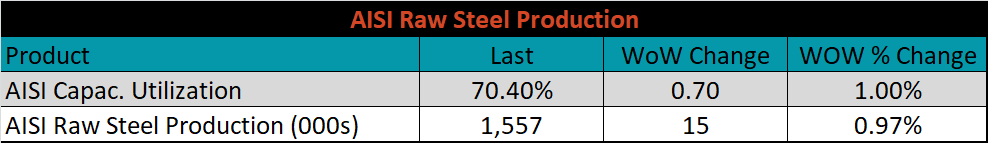
The AISI Capacity Utilization rate increased 0.7% to 70.4%.
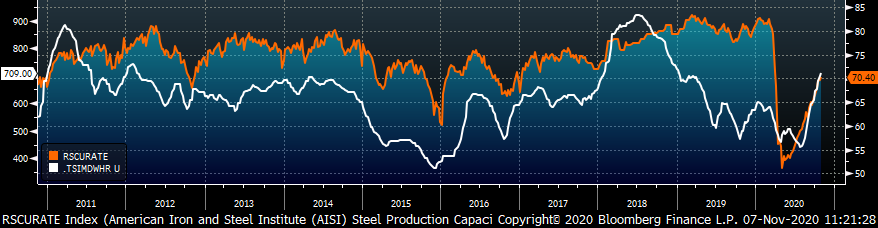
AISI Steel Capacity Utilization Rate (orange) and TSI Daily HRC Price (white)
Imports & Differentials
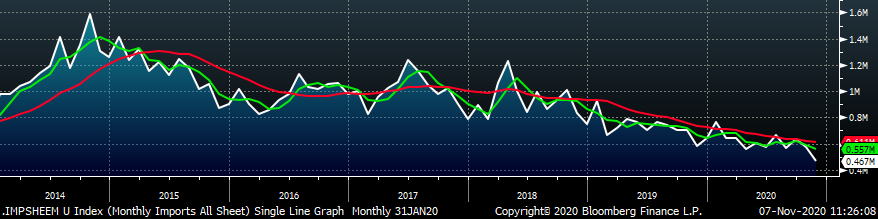
November flat rolled import license data is forecasting a decrease of 104k to 467k MoM.
All Sheet Imports (white) w/ 3-Mo. (green) & 12-Mo. Moving Average (red)
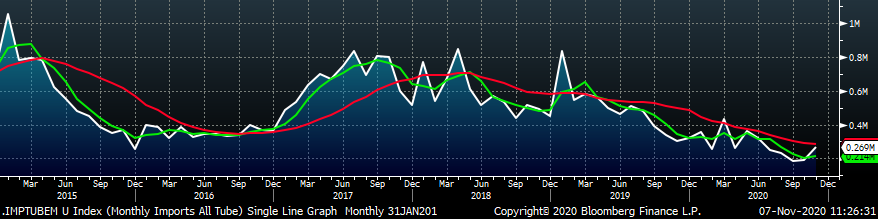
Tube imports license data is forecasting an increase of 80k to 269k in November.
All Tube Imports (white) w/ 3-Mo. (green) & 12-Mo. Moving Average (red)
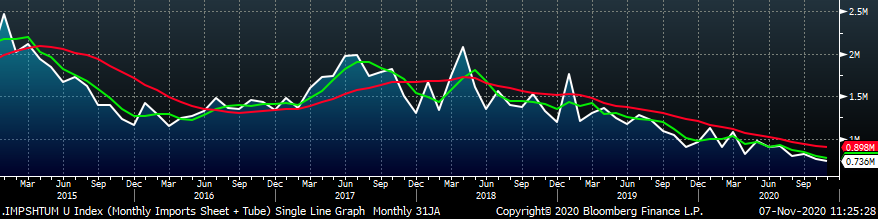
All Sheet plus Tube (white) w/ 3-Mo. (green) & 12-Mo. Moving Average (red)
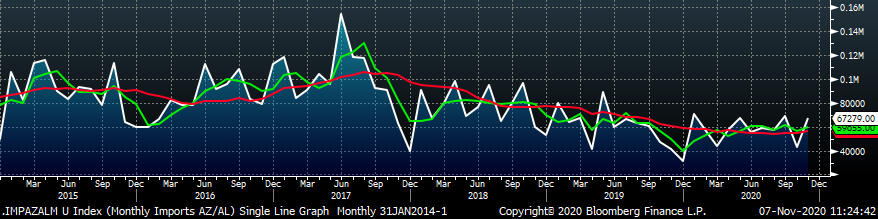
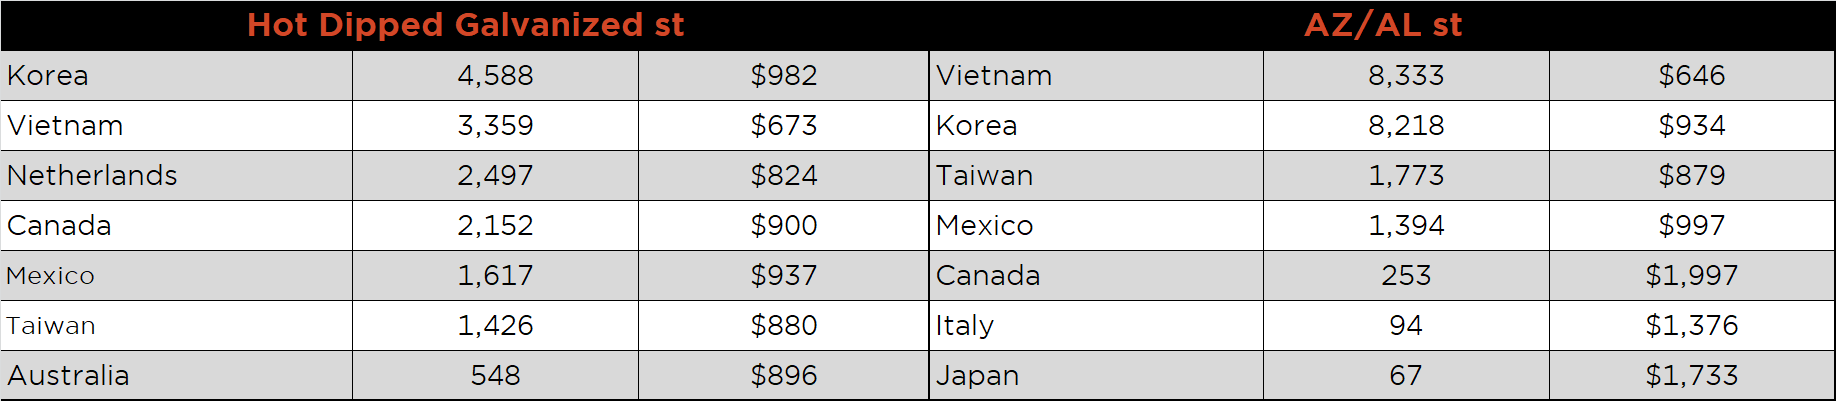
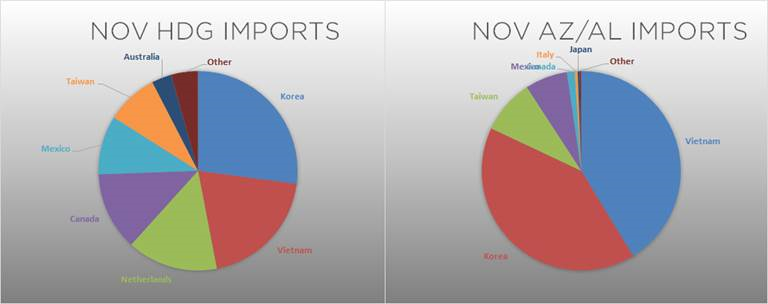
November AZ/AL import license data is forecasting a 24k increase to 46k.
Galvalume Imports (white) w/ 3 Mo. (green) & 12 Mo. Moving Average (red)
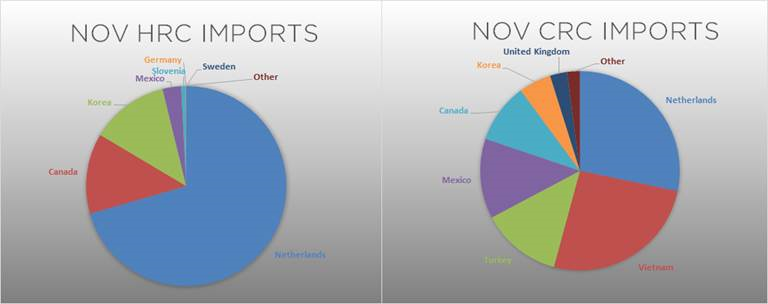
Below is November import license data through November 4, 2020.
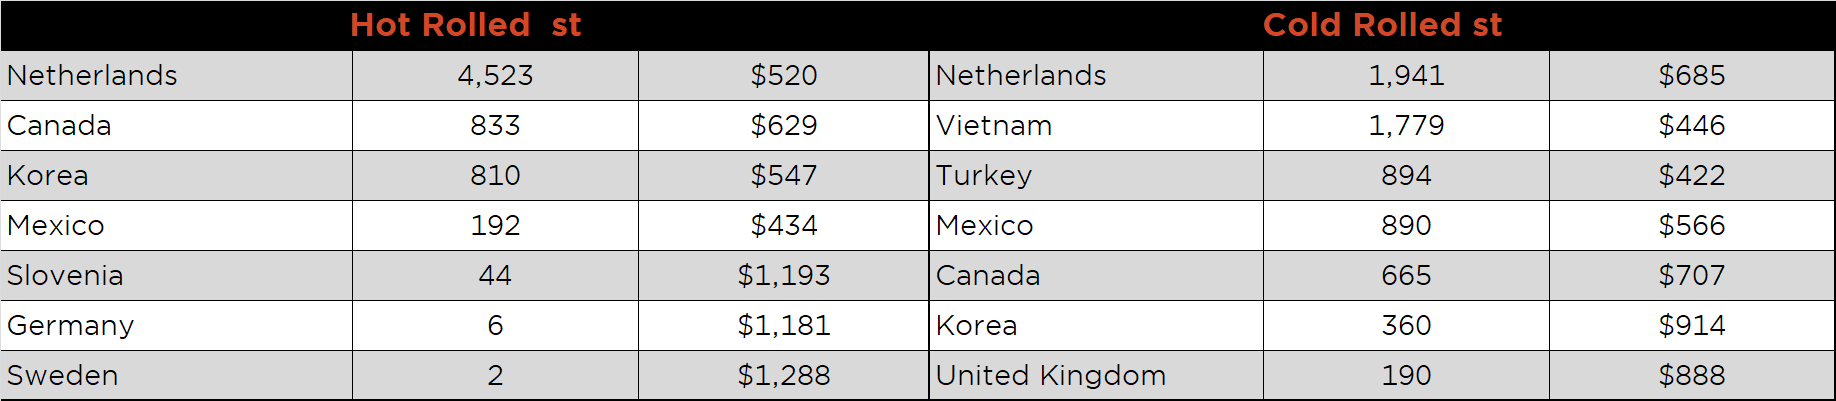
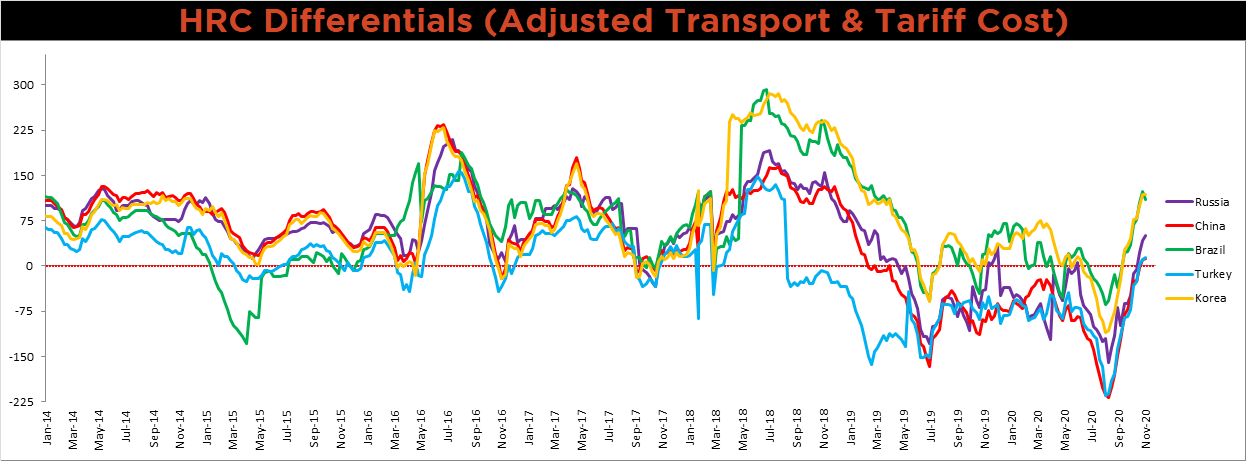
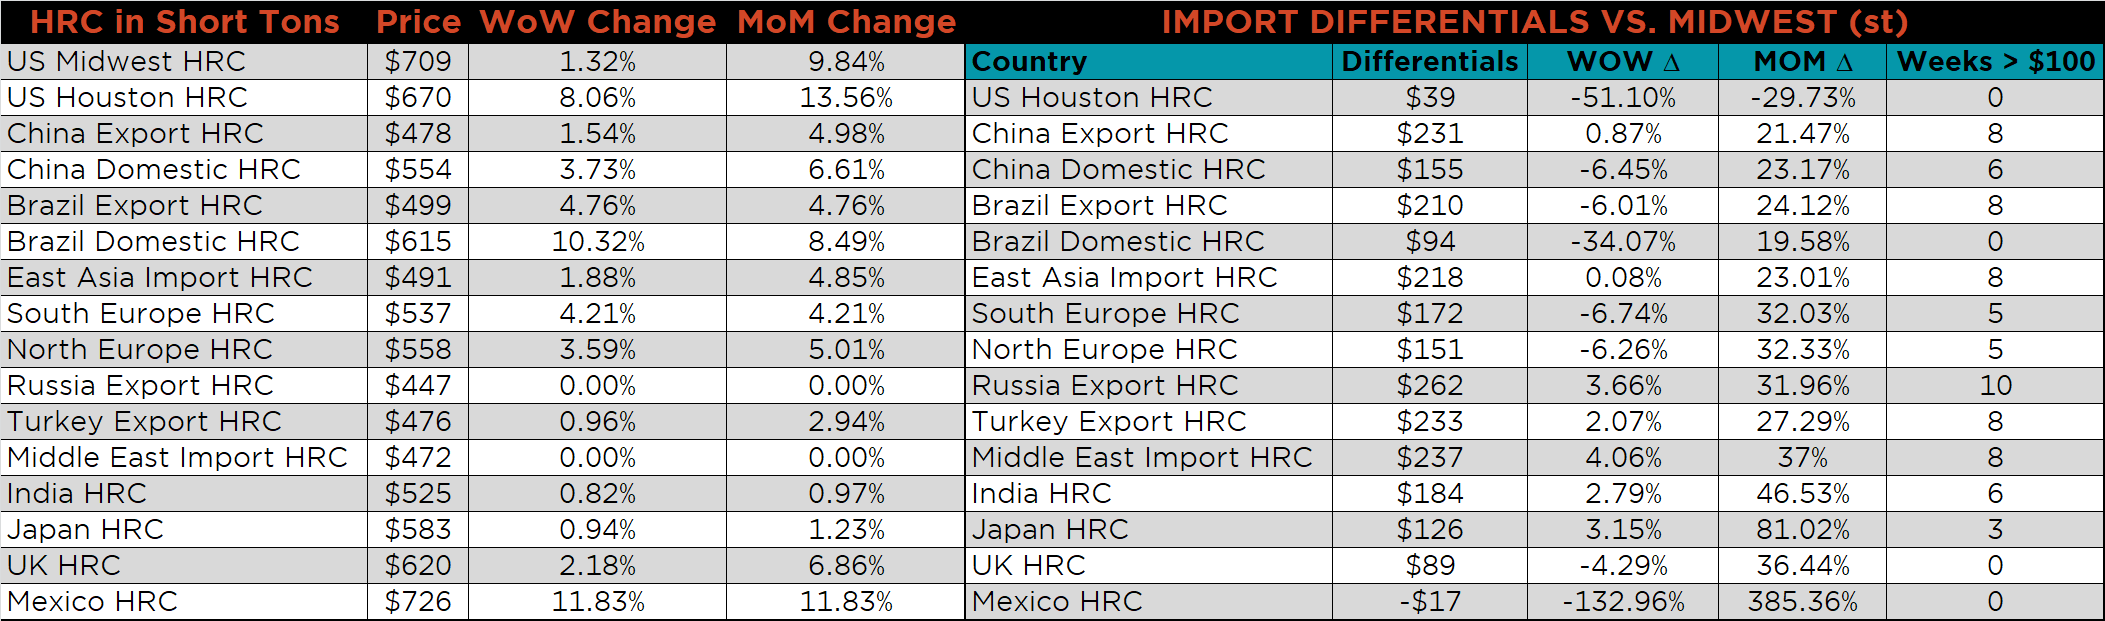
Below is the Midwest HRC price vs. each listed country’s export price using pricing from SBB Platts. We have adjusted each export price to include any tariff or transportation cost to get a comparable delivered price. The differentials for Russia and Turkey increased again last week, while higher prices in China, Korea and Brazil led to lower respective differentials.
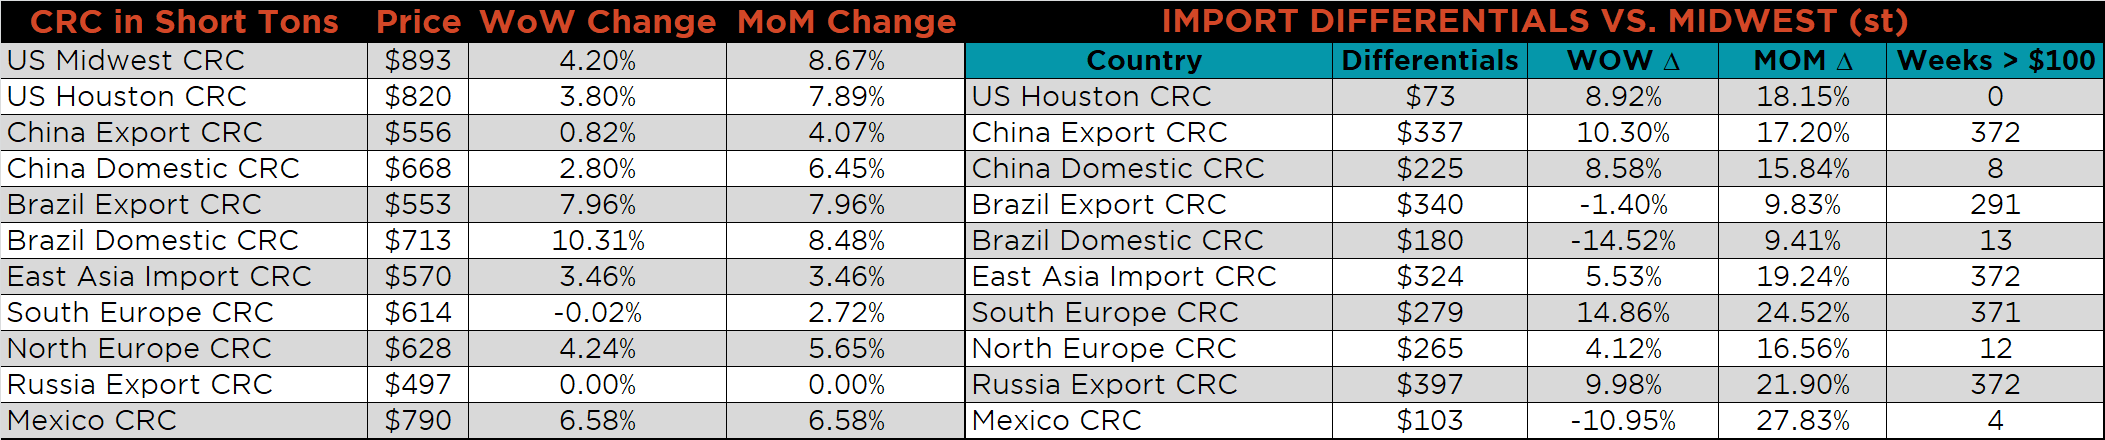
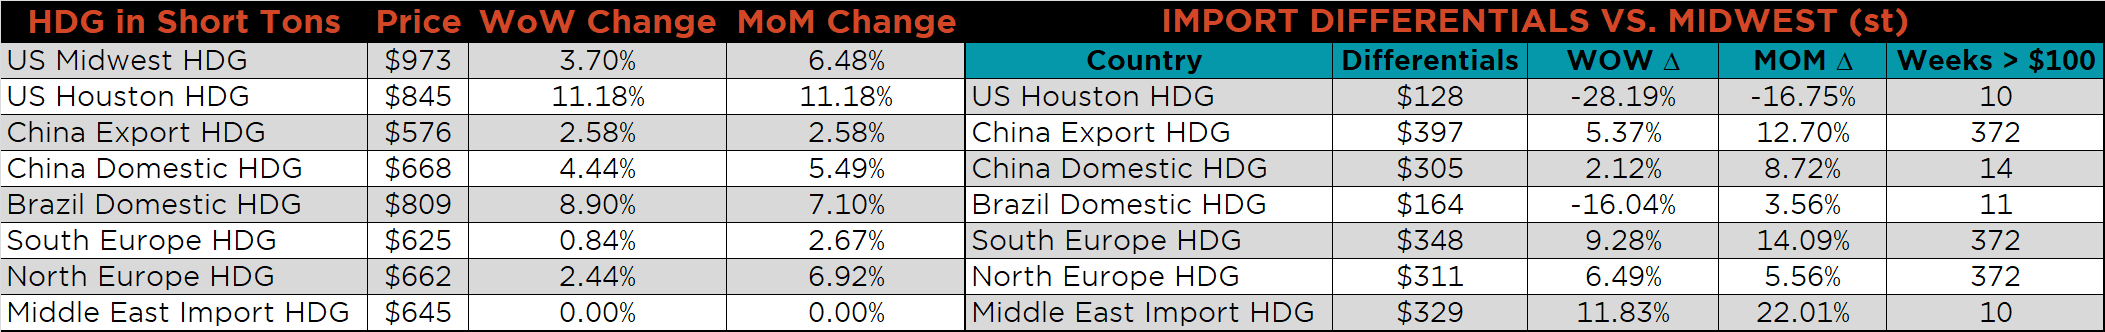
SBB Platt’s HRC, CRC and HDG pricing is below. The Midwest CRC, HDG and HRC prices were up 4.2%, 3.7% and 1.3%, respectively. Globally, the Mexican and Brazilian HRC price were up, 11.8% and 10.3%, respectively.
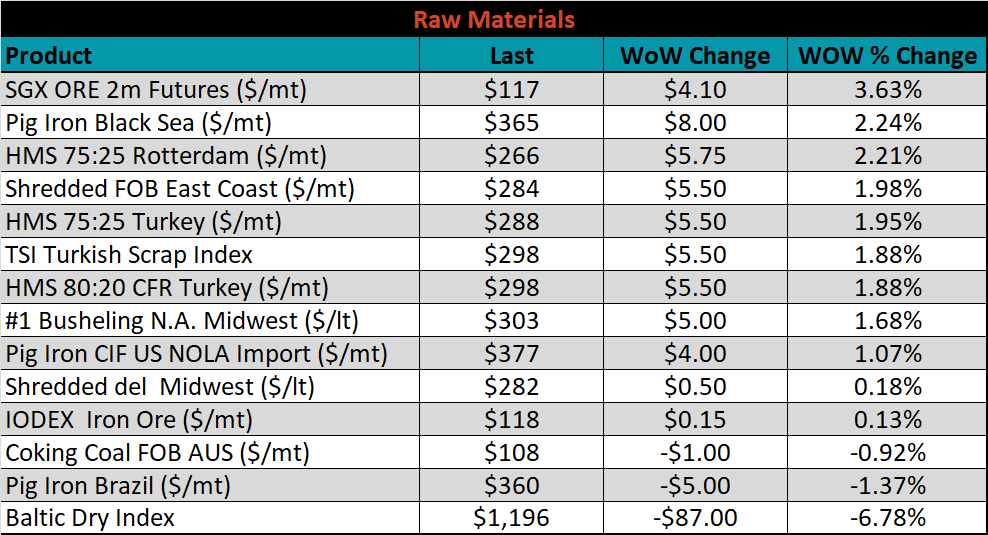
Raw Materials
Raw material prices were mixed. Iron ore futures were up 3.6%, while Brazil pig iron was down another 1.4%.
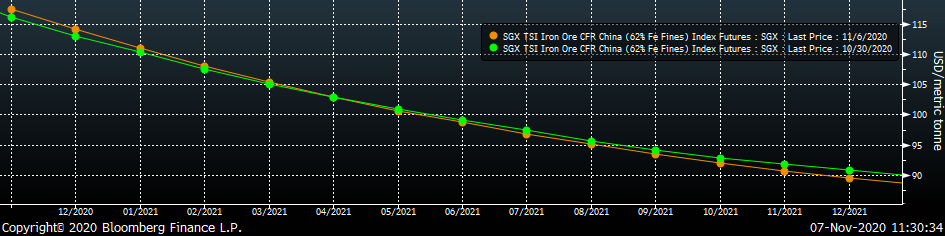
Below is the iron ore future curve with Friday’s settlements in orange, and the prior week’s settlements in green. Last week, the curve steeped slightly, higher in the front and lower in the back.
SGX Iron Ore Futures Curve
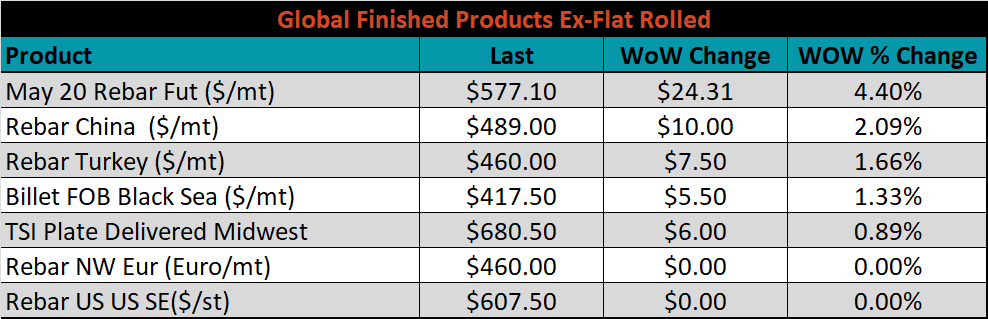
The ex-flat rolled prices are listed below.

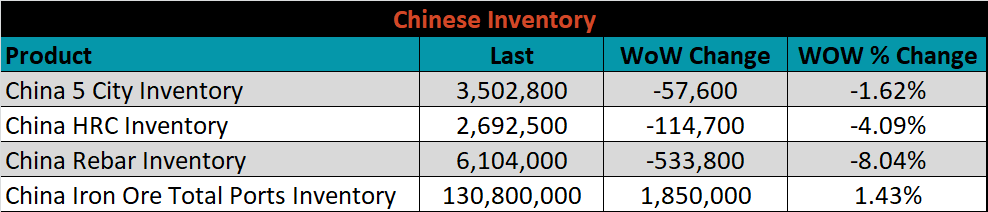
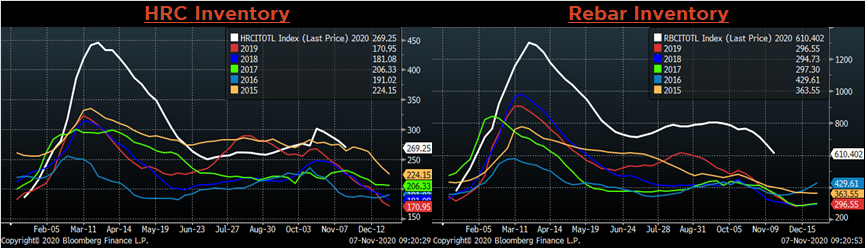
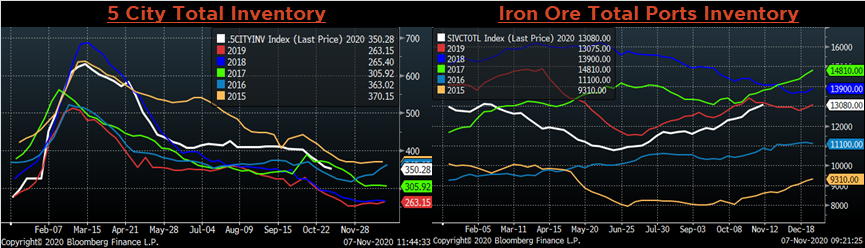
Chinese Inventory
Below are inventory levels for Chinese finished steel products and iron ore. Last week, the 5-City, HRC and rebar inventory levels continued to decline, while the iron ore ports inventory increased again. After lagging the other categories, rebar inventory levels have declined the most dramatically since the beginning of October.
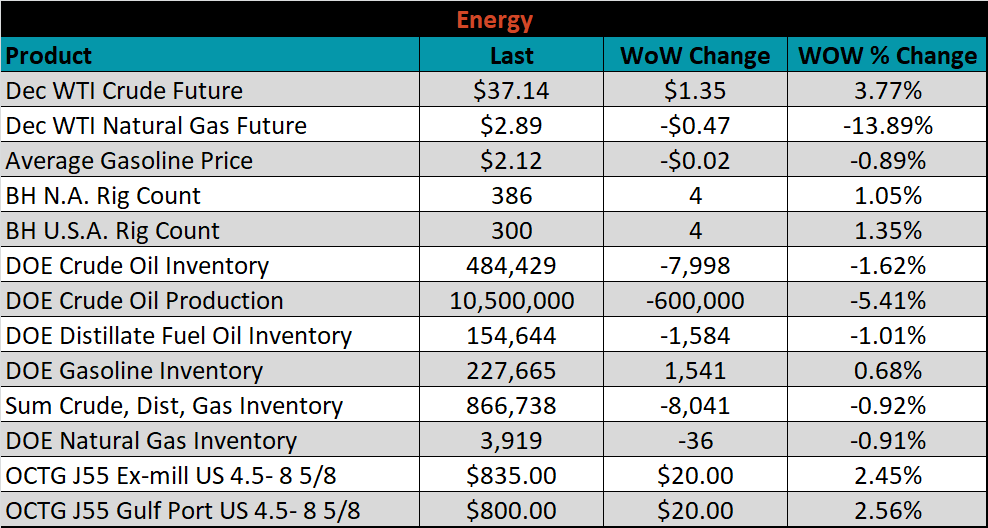
Energy
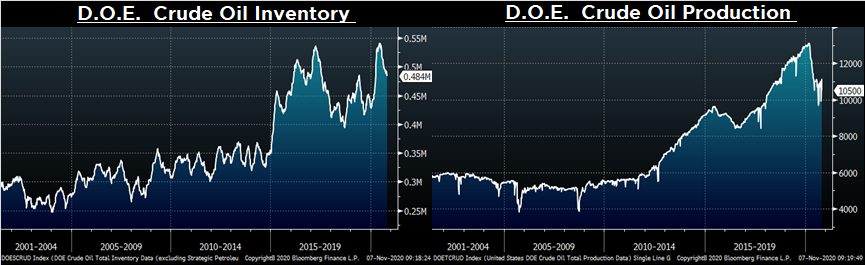
Last week, the December WTI crude oil future gained $1.35 or 3.8% to $37.14/bbl. The aggregate inventory level was down 0.9%, while crude oil production fell to 10.5m bbl/day. The Baker Hughes North American and U.S. rig counts were each up 4 rigs.
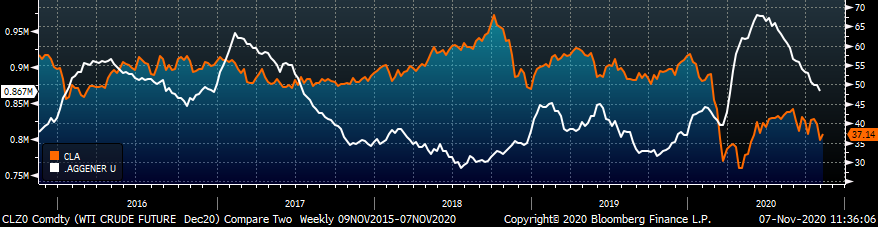
December WTI Crude Oil Futures (orange) vs. Aggregate Energy Inventory (white)
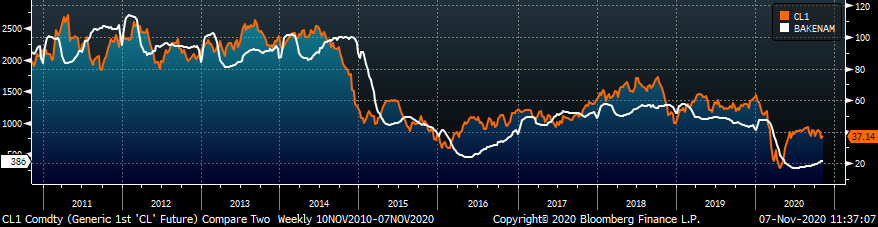
Front Month WTI Crude Oil Future (orange) and Baker Hughes N.A. Rig Count (white)
The list below details some upside and downside risks relevant to the steel industry. The orange ones are occurring or look to be highly likely. The upside risks look to be in control.
Upside Risks:
- Unplanned & extended planned outages
- Economic stimulus measures including Infrastructure package and low interest rates
- Strengthening global (Asia, Europe, CIX, Turkey) flat rolled prices
- Elevated iron ore prices
- Chinese economic stimulus measures
- Low current and expected import levels
- Declining/low inventory levels at end users and service centers
- Increasing commodity pricing due to a weakening US Dollar
- Lifestyle shifts supporting steel intensive industries
- Further section 232 tariffs and quotas restricting supply
- Low and declining interest rates
- China strict steel capacity cuts
- Energy industry rebound
- Unexpected inflation
Downside Risks:
- Increased domestic production capacity
- Coronavirus induced economic shutdowns
- Weak labor markets
- Weaker demand in energy and construction
- Political & geopolitical uncertainty
- Reduction and/or removal of domestic trade barriers
- Weak global economics/PMIs
- Trade slowdown in China due to tensions with US, Hong Kong and others
- Weakening scrap prices
- Trade War Fallout
- Declining rates of growth in manufacturing/demand destruction
- Domestic automotive industry under pressure
- Chinese restrictions in property market
- The Chinese Financial Crisis
- Unexpected sharp China RMB devaluation
- Increasing price differentials