Content
-
Weekly Highlights
- Market Commentary
- Durable Goods
- Risks


Last week mills pushed another price increase, led by Nucor raising offers $40/st. This is the second price increase announced in the last two weeks, and spot prices have stabilized from the two month slide and moved slightly higher to $500/st. As this report has discussed, these increases were expected in the market, as well as the future curve. Additionally, there are rumors of another increase announcement, which is also expected by the future curve based on current prices. The mills’ ability to capture additional increases appears likely as most December availability is gone, and they have not yet opened January order books. Lead times are extending, and currently sit at the highest levels since mid-2018. Scrap prices moved up $20 in November, providing additional support for the increases. The bottom for spot prices has been set, at least in the near-term, and prices seem poised to move higher.
Looking further into 2020, supply trends in the domestic markets appear to be taking shape, likely a result of the Section 232 tariffs, which will affect prices throughout next year. First, import levels have adjusted lower, which is displayed below on a trailing twelve-month basis to show changing trends and remove seasonal impacts. The chart shows net imports, which is imports minus exports.
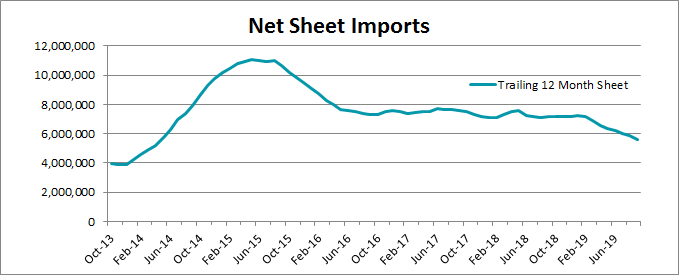
Over the last several months, net sheet imports declined, and are down about 20% from 2017 levels. The domestic market has lost 1.5 million tons annually of sheet products, which has shifted to domestic producers. This shift gives domestic mills more power during negotiations, leading to more control over price. However, competition among domestic mills will also increase as they attempt to capture market share and fill this gap with additions to their order books. Therefore, to get a full view of the supply landscape, we must look at production data. Below is a chart of the weekly AISI Raw Steel Production data with a 52 week moving average line in red.

The domestic production levels today have increased since 2017 in order to fill the import gap. However, during this time, HRC prices fell significantly, and are well below the pre-Section 232 price. This signals that the increased production has caused an oversupplied market, despite the reduction in net imports. To justify higher prices for 2020, either imports will need to decline significantly, or domestic producers will need to pull production capacity out of the market.

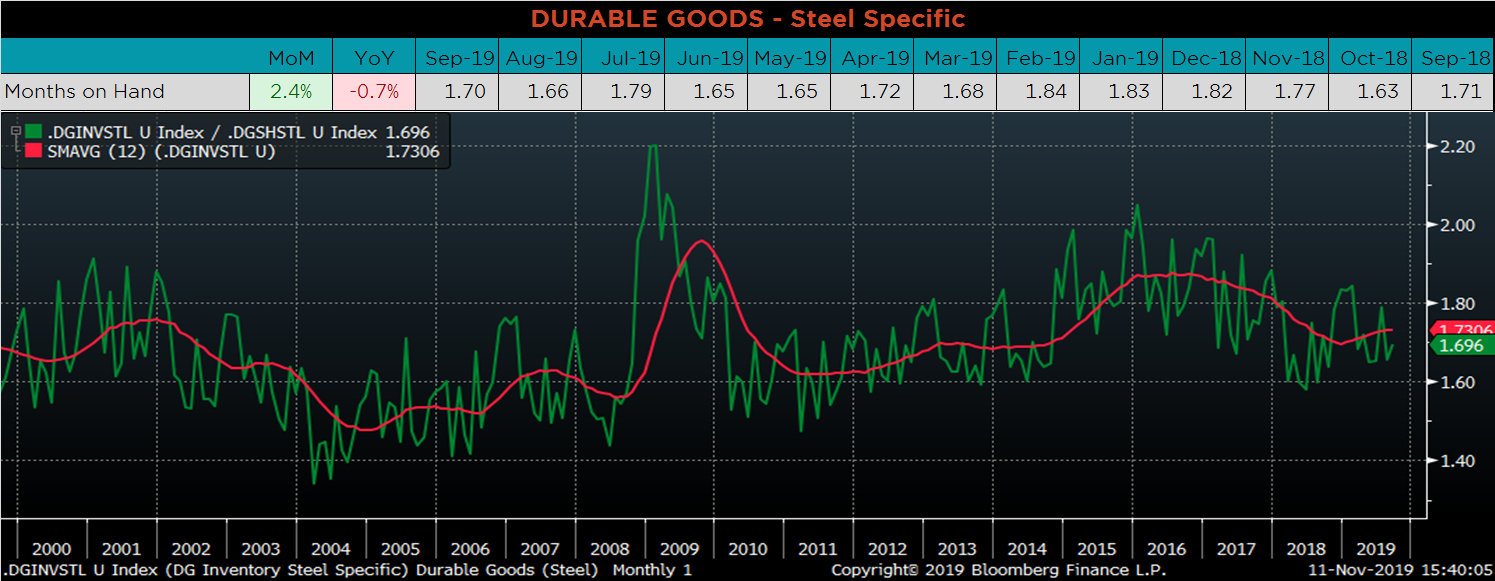
Below are final September new orders from the Durable Goods report. Overall, new orders were dragged lower by weakness in transportation equipment both YoY and MoM . Manufacturing new orders ex-transportation were flat compared to last year, but were slightly lower compared to last month. The final chart below looks at the months on hand (inventory divided by shipments) for durable goods categories that are steel intensive. MOH was 2.4% higher than in August, but down 0.7% compared to 2018.



Below are the most pertinent upside and downside price risks:
Upside Risks:
Downside Risks:

The Platts TSI Daily Midwest HRC Index was up $1.75 to $499.50.

The CME Midwest HRC futures curve is below with last Friday’s settlements in white. The curve moved higher in January to flatten across the board, settling between $560-570 for all of 2020.

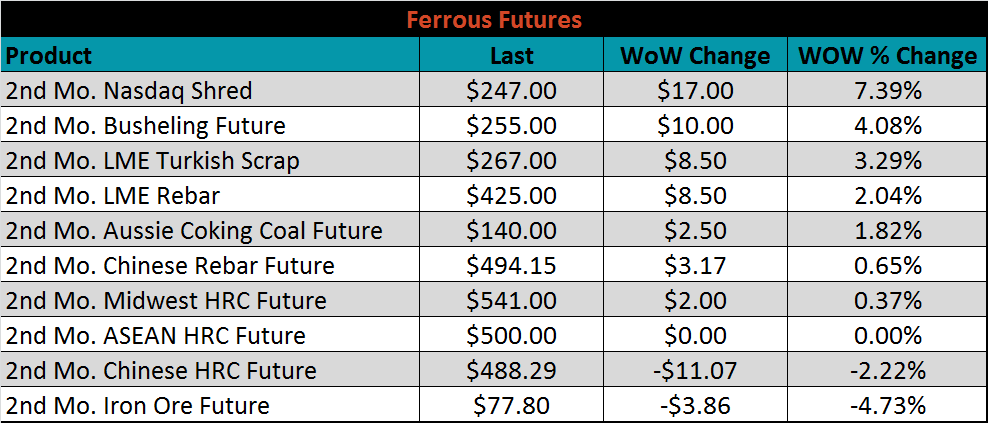
December ferrous futures were mixed. The iron ore future lost 4.7%, while the Nasdaq Shred future gained 7.4%.
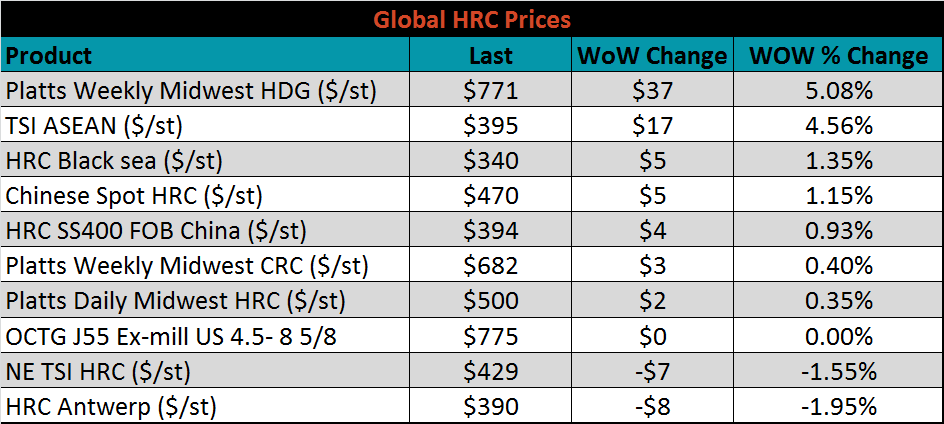
The global flat rolled indexes were mostly higher. Midwest TSI HDG was up 5.1%, while Antwerp HRC was down 2%.
The AISI Capacity Utilization Rate was up another 0.9% to 81.6%. Production continued to climb above the 80% goal set by the Trump administration despite low spot price levels.


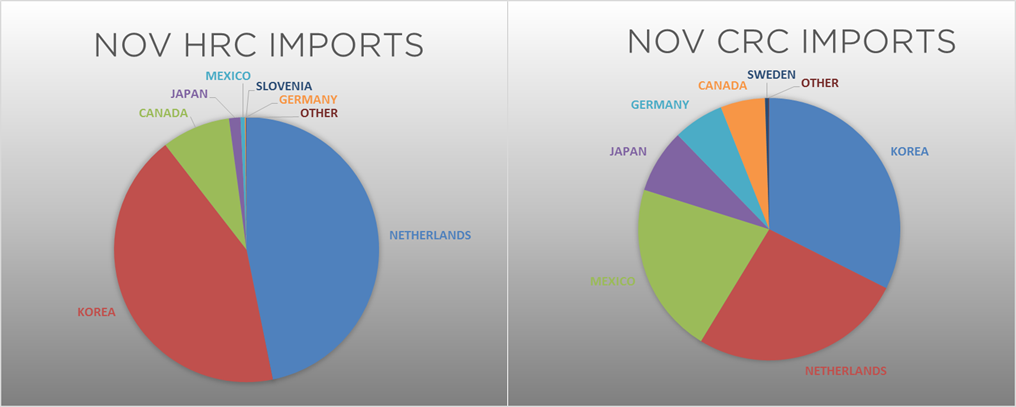
November flat rolled import license data is forecasting a decrease of 22k to 700k MoM.

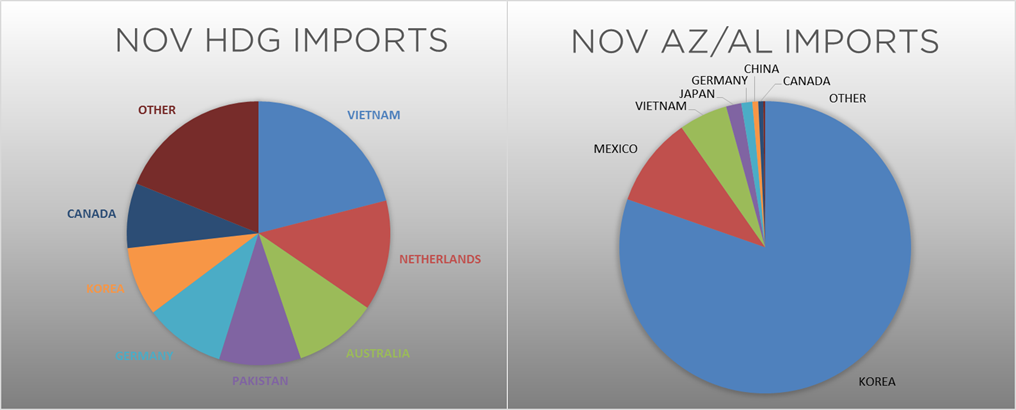
Tube imports license data is forecasting a MoM increase of 131k to 477k tons in November.


AZ/AL import license data is forecasting an increase of 8k in October to 56k.

Below is October import license data through November 5, 2019.


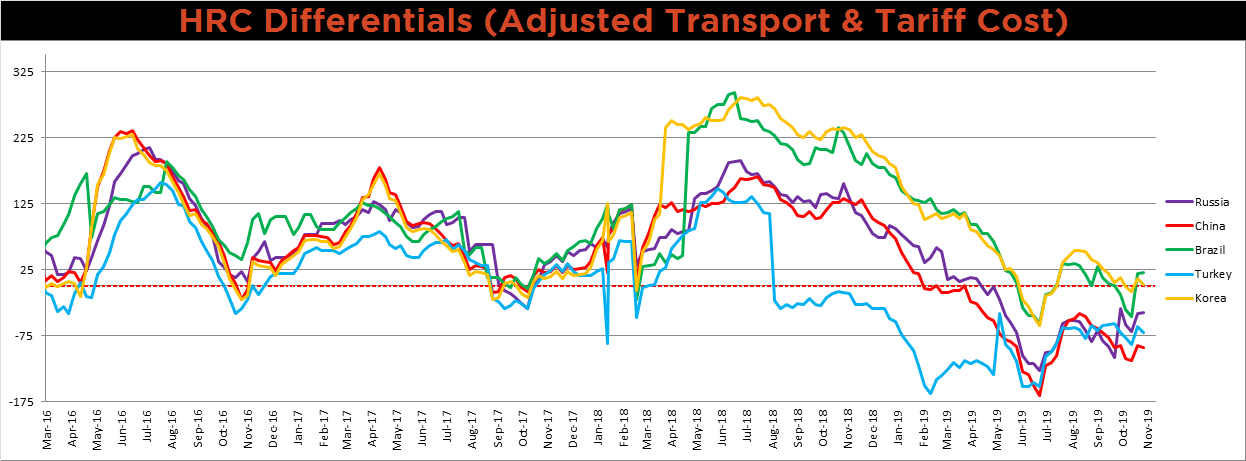
Below is the Midwest HRC price vs. each listed country’s export price using pricing from SBB Platts. We have adjusted each export price to include any tariff or transportation cost to get a comparable delivered price. The slight increase in Midwest HRC led to an increase in the Brazilian and Russian differential, while larger increases in the remaining export prices pushed their corresponding differentials lower.
SBB Platt’s HRC, CRC and HDG pricing is below. The Midwest HDG price was up 5.1%, while the HRC and CRC prices rose only slightly. Globally, the East Asia HRC import price and the Turkish HRC export price were up, 2.8% and 2.5%, respectively.


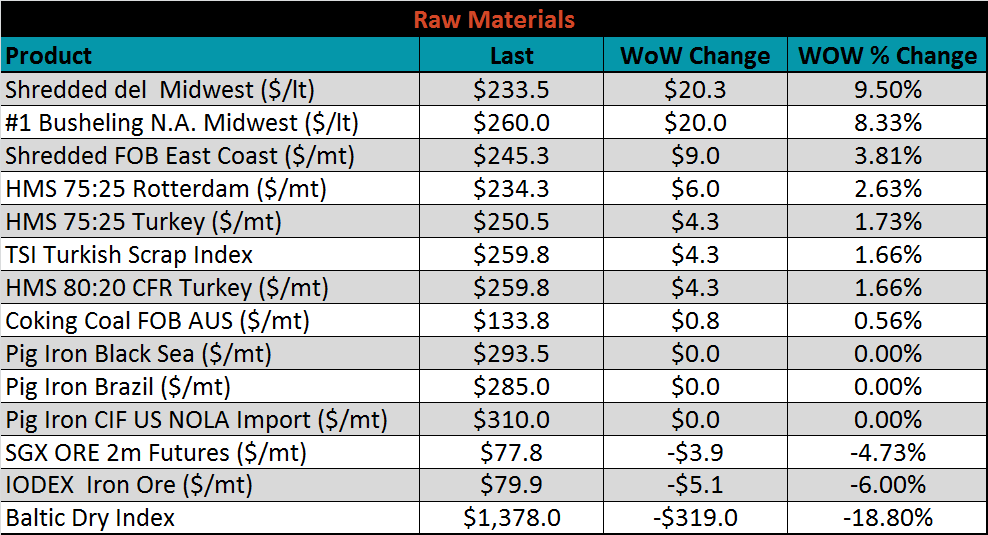
Raw material prices were mixed. Shredded scrap delivered to the Midwest was up 9.5%, while the IODEX was down another 6%.
Below is the iron ore future curve with Friday’s settlments in orange, and the prior week’s settlements in green. The curve continued to shift slightly lower across all expirations.

The ex-flat rolled prices are listed below.


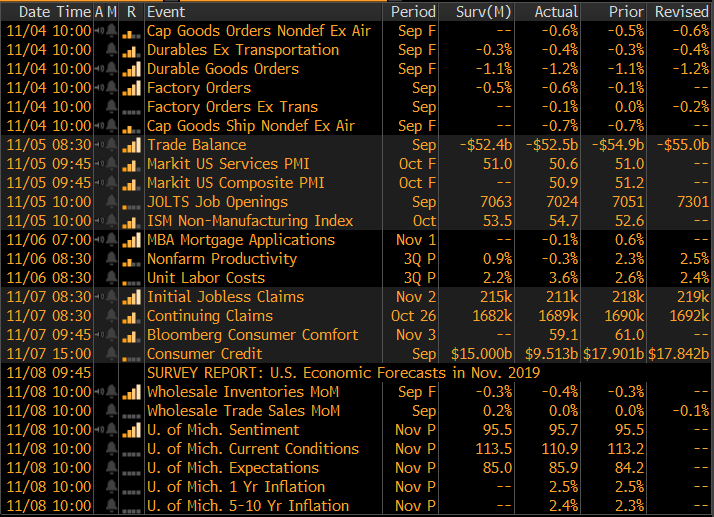
This week, the ISM Non-Manufacturing Index printed above expectations of 53.5 at 54.7, up 2.1 points from September. This, along with the University of Michigan Expectations index printing 0.2 points higher than expectations at 95.7, is another data point suggesting that consumer confidence remains strong in the U.S. economy, despite the manufacturing slowdown.


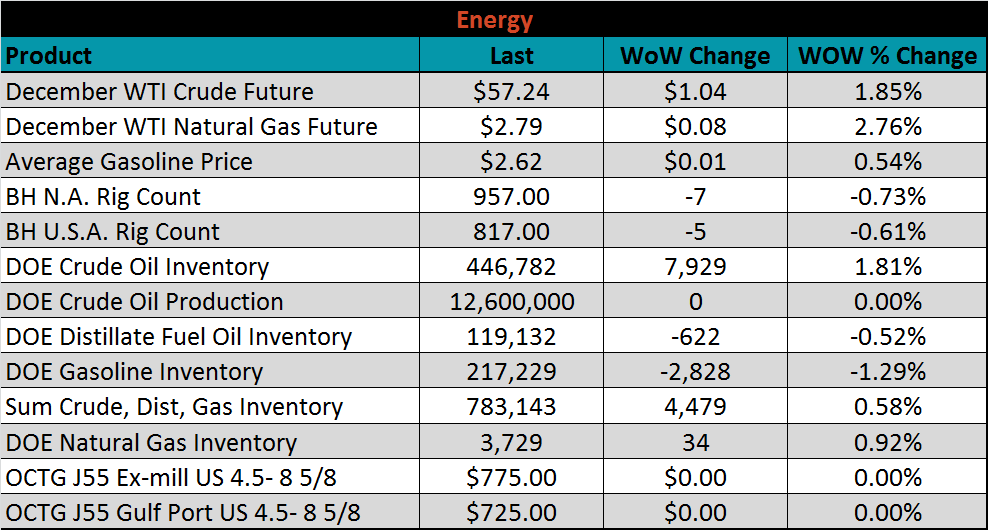
Last week, the December WTI crude oil future gained $1.04 or 1.9% to $57.24/bbl. The aggregate inventory level was up 0.6%, while crude oil production remains at 12.6m bbl/day. The Baker Hughes North American rig count lost seven rigs, while the U.S. count lost five.


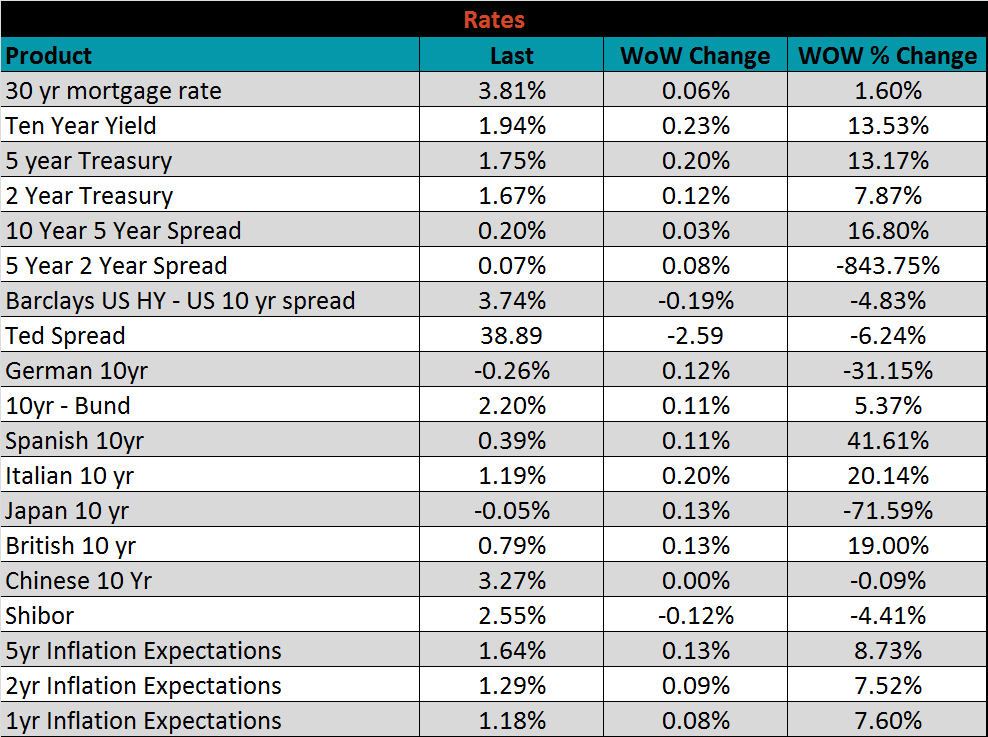
The U.S. 10-year yield was up 23 bps, closing the week at 1.94%. The German 10-year yield was up 12 bps to minus 0.26%, while the Japanese 10-year yield was up 13 bps to minus 0.05%. The global recovery in bond yields signals brightening economic outlook.


The list below details some upside and downside risks relevant to the steel industry. The orange ones are occurring or look to be highly likely. The upside risks look to be in control.
Upside Risks:
Downside Risks: