Content
-
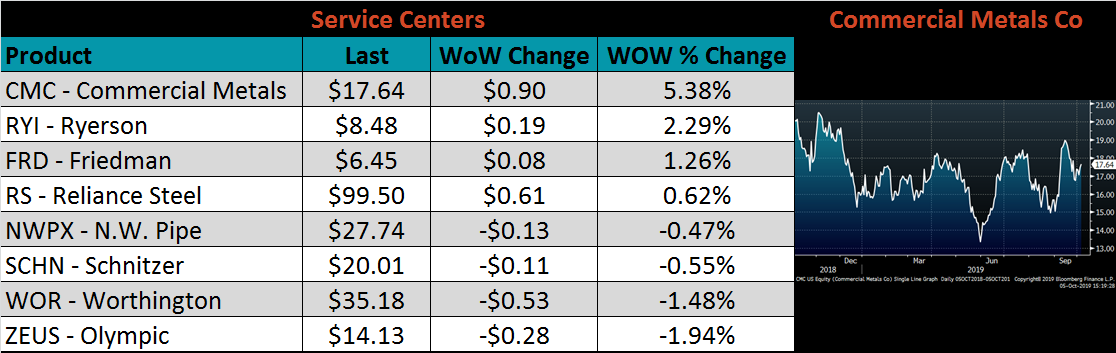
Weekly Highlights
- Market Commentary
- ISM PMI
- Global PMI
- Construction Spending
- Auto Sales
- Risks


Last week this report discussed several reasons why the domestic HRC market does not appear to be at or near a bottom yet. While we still hold this view, it is also important to understand the relevant upside risks and the changing market expectations.
This week’s report covers the first week of the month, which includes multiple applicable economic indicators released last week, described in detail in the report below. September ISM Manufacturing PMI hit the lowest level since June 2009, global manufacturing PMIs were slightly stronger in September from their very low levels of August, construction spending data declined YoY in August, and the September auto sales were seasonably weak. While all of these data points can undoubtedly weaken further, it will likely take a recessionary environment for them to do so. Furthermore, the market is a discounting mechanism that takes current data and expectations into account when determining price. Therefore, the current economic weakness is likely already priced into most assets, signaling that there is less risk to the downside as prices fall.
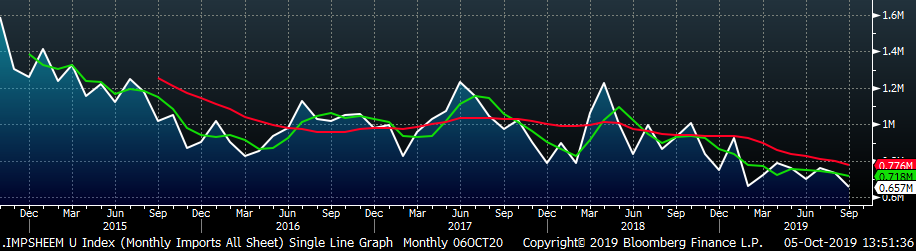
Another upside risk is the level of imports in the remaining three months of the year. Below is a chart showing the trailing twelve months of net sheet imports, imports minus exports.
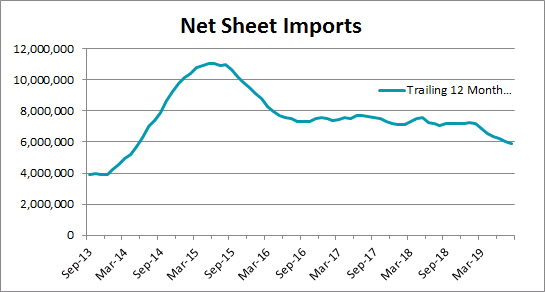
Up to this point, imports have adjusted slightly lower since the tariffs and shrinking price differentials, but they have not fallen dramatically to have any impact on price. We continue to see a steady level of material from abroad, but if this changes before year-end, this would support prices.
Finally, the current market expectations, displayed through the futures curve, can give some insight into the physical market expectations. As spot prices have fallen over the last year, the curve shifted from backwardation into contango, meaning that the market currently expects spot prices in the future to be higher than they are now. Moreover, the further spot prices fall, the more rapidly the market expects the price to recover, as the curve moves further into contango. Below is a chart showing this contango through the 6th month future price minus the 3rd month future price.
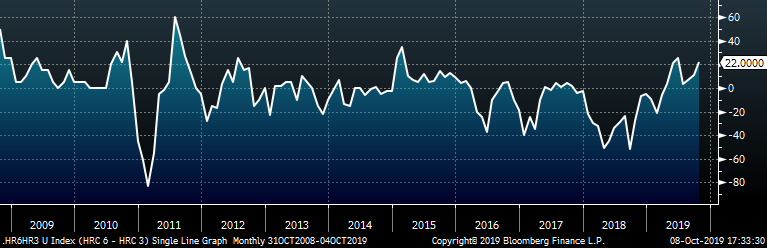
Currently the reading is at historically high levels, which tends to precede price rallies. As the spot price goes lower, the stronger the upside risks are compared to the downside risks. With the current future curve $100/st below its historical average, it seems like a good opportunity to hedge future buys.
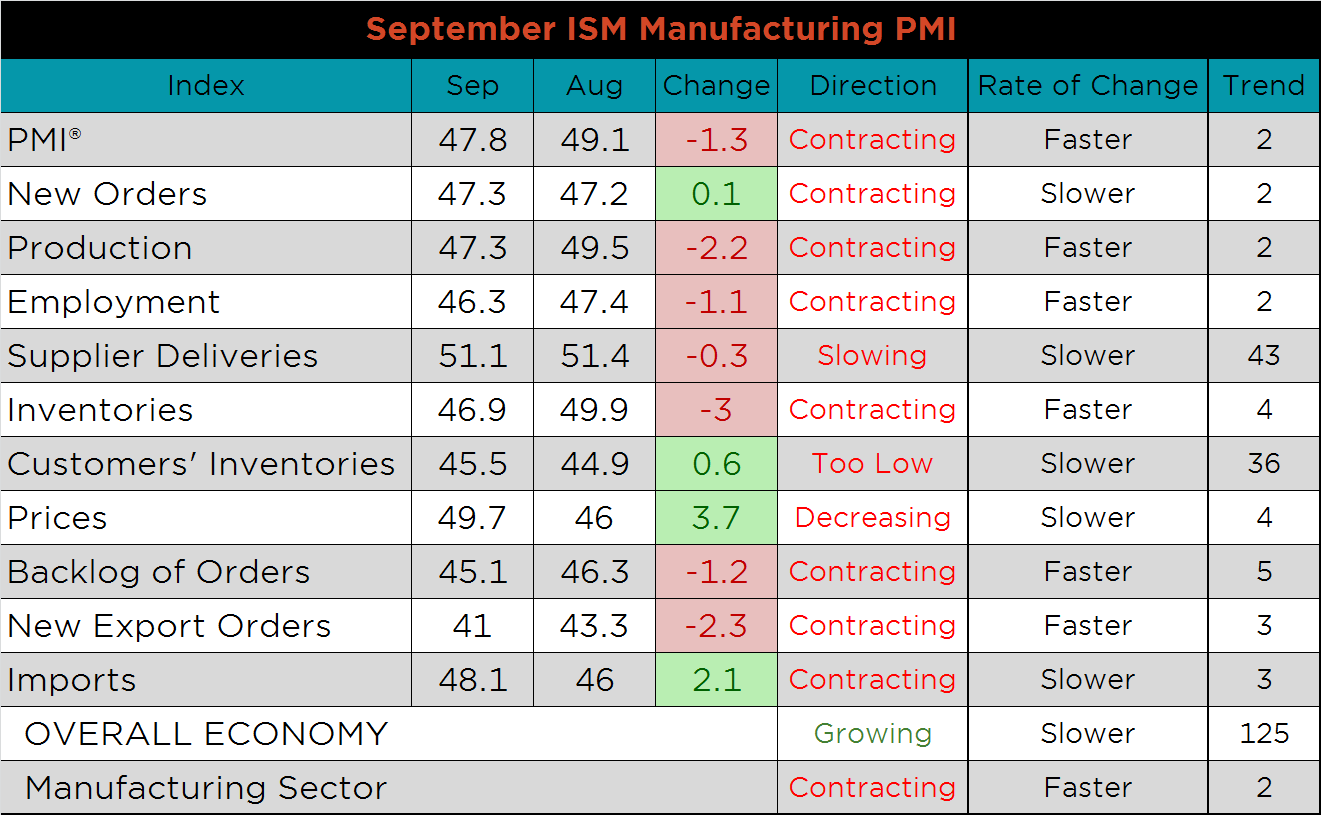
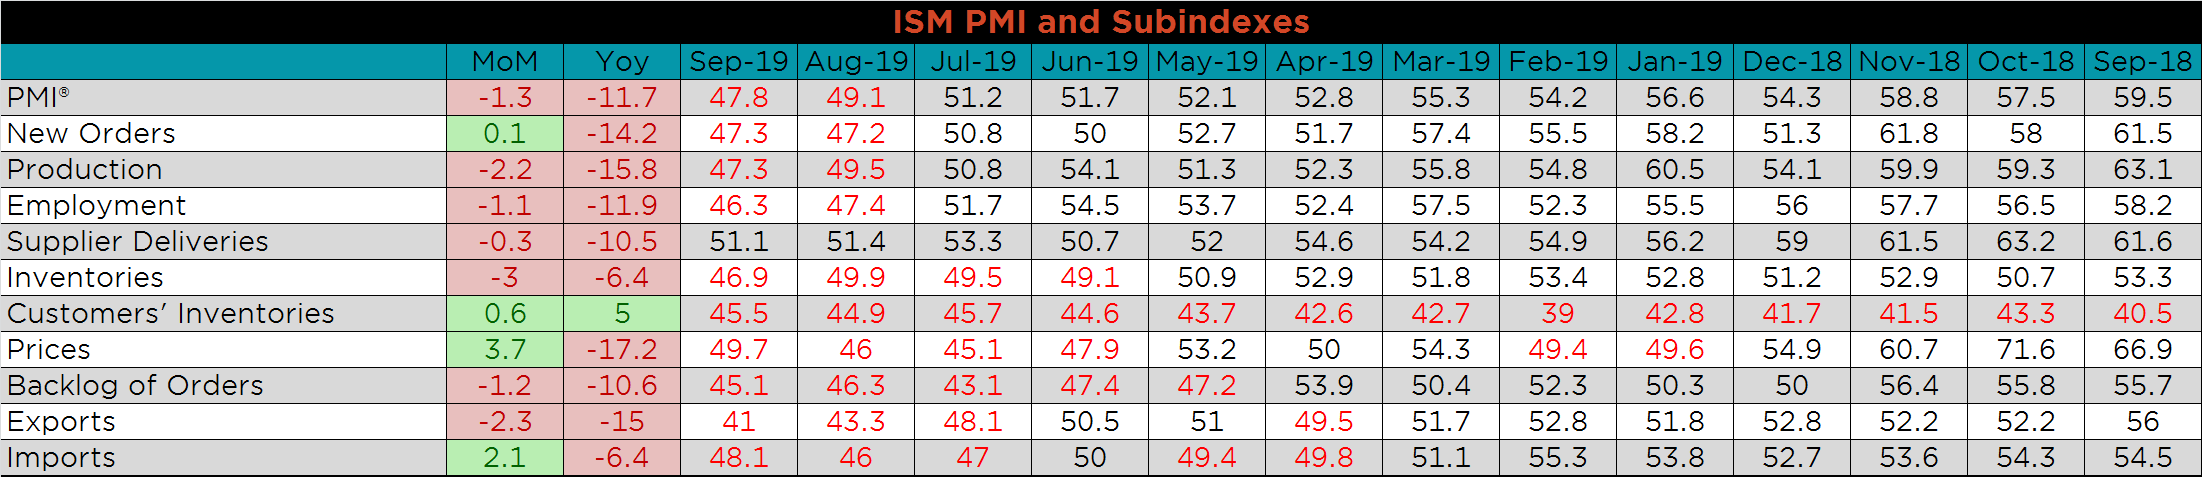
The September ISM Manufacturing PMI and subindexes are below. This is the lowest ISM print since June 2009.
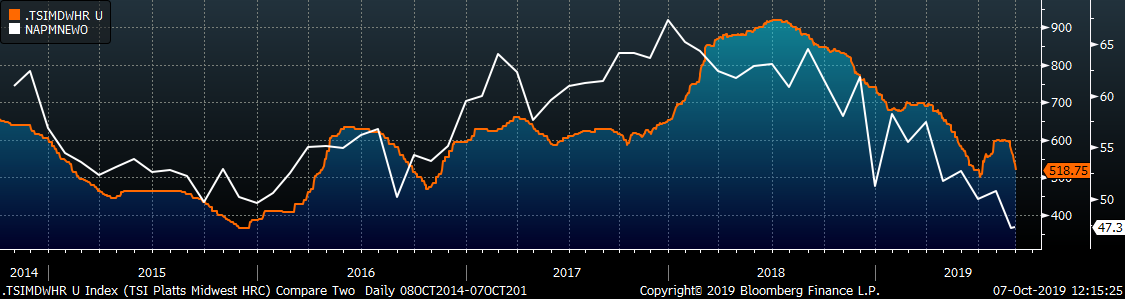
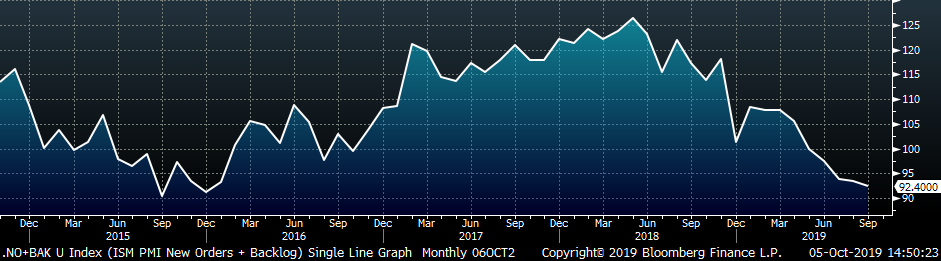
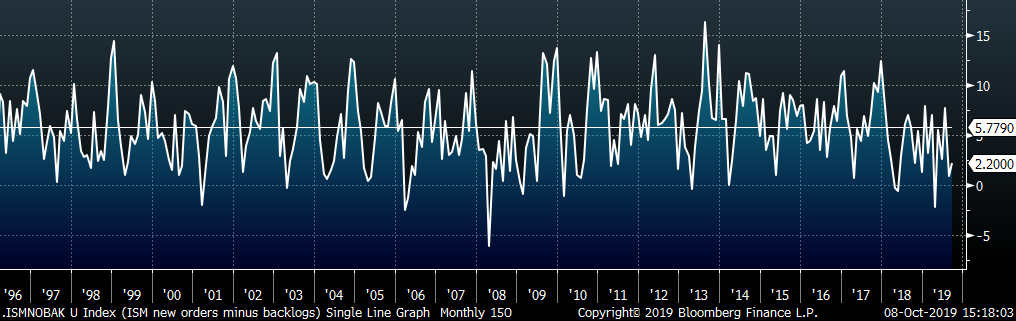
The chart below compares the ISM new orders subindex with the Platts TSI Daily Midwest HRC Index. The subindex printed up slightly, but remains in contraction and at the lowest level since June 2012. The second chart adds the new orders and backlog subindexes together, giving a gauge of manufacturing demand, which continued to weaken further in September, albeit at a slower rate. Finally, the third chart shows the new orders index minus the backlog, which has been consistently below its historical average since early 2018. With the uncertainty of the different trade wars and tariffs, manufacturers elected to delay or reduce their new orders.
Supplier deliveries remain the sole index in expansion, but the subindex moved slightly lower. New export orders, production and backlog of orders slowed the most, down 2.3, 2.2 and 1.2 points, respectively.
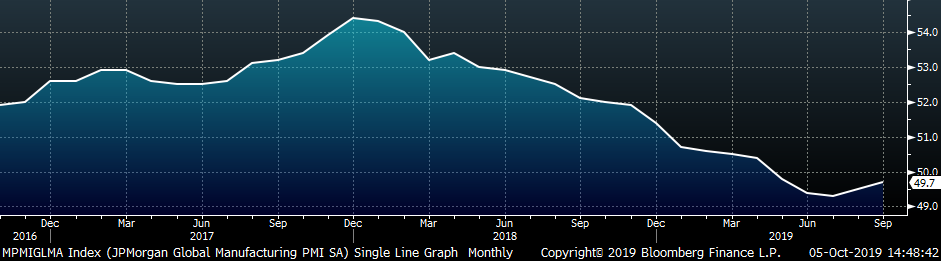
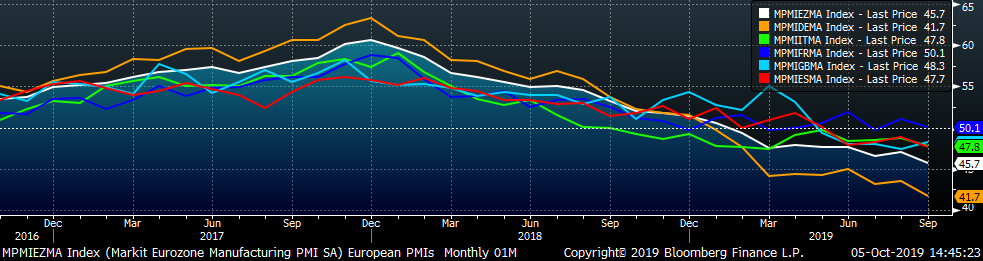
This month’s global PMI printings show weakness in many major countries, but overall, provide some signs of life in manufacturing. Bright spots include the Canadian, Turkish and Taiwanese PMI’s which all moved into expansion. The U.S., Japan, China (Official), the Eurozone and Germany all remain in contraction.
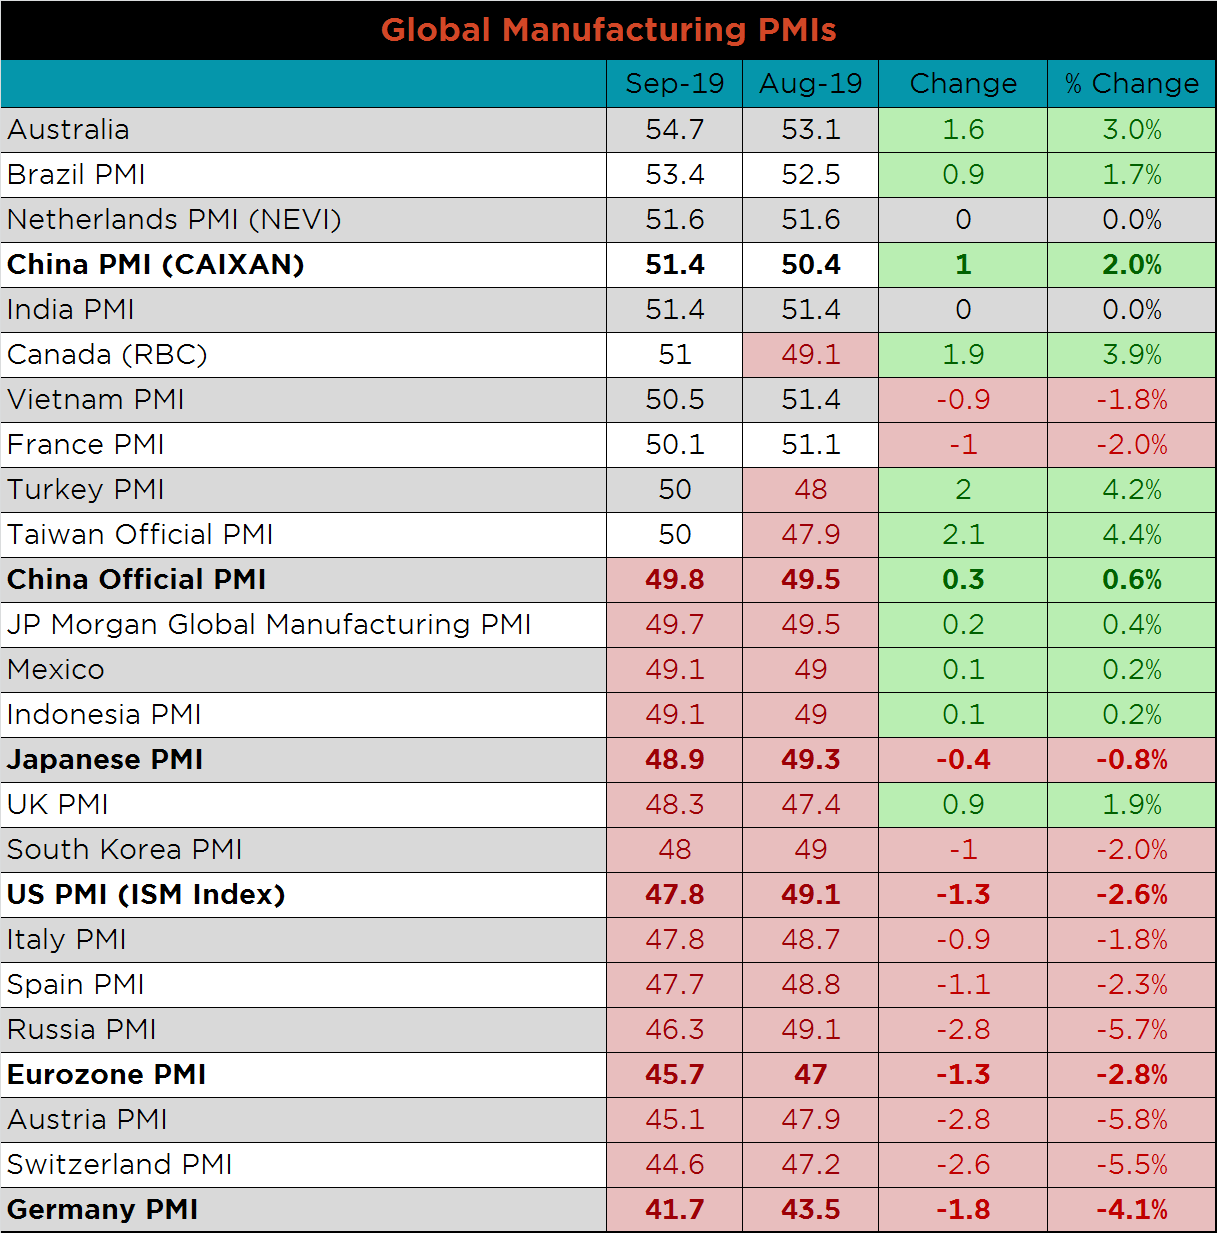
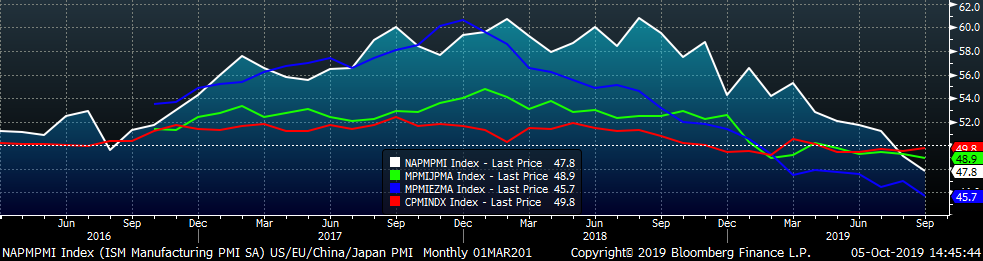
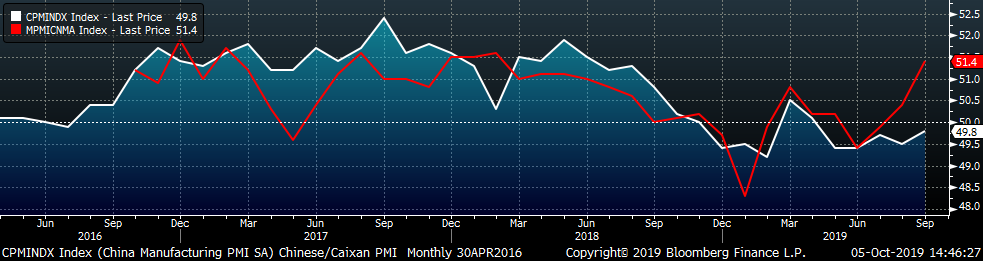
China’s official PMI printed up to 49.8 while the Caixan Manufacturing PMI printed one point higher to 51.4.
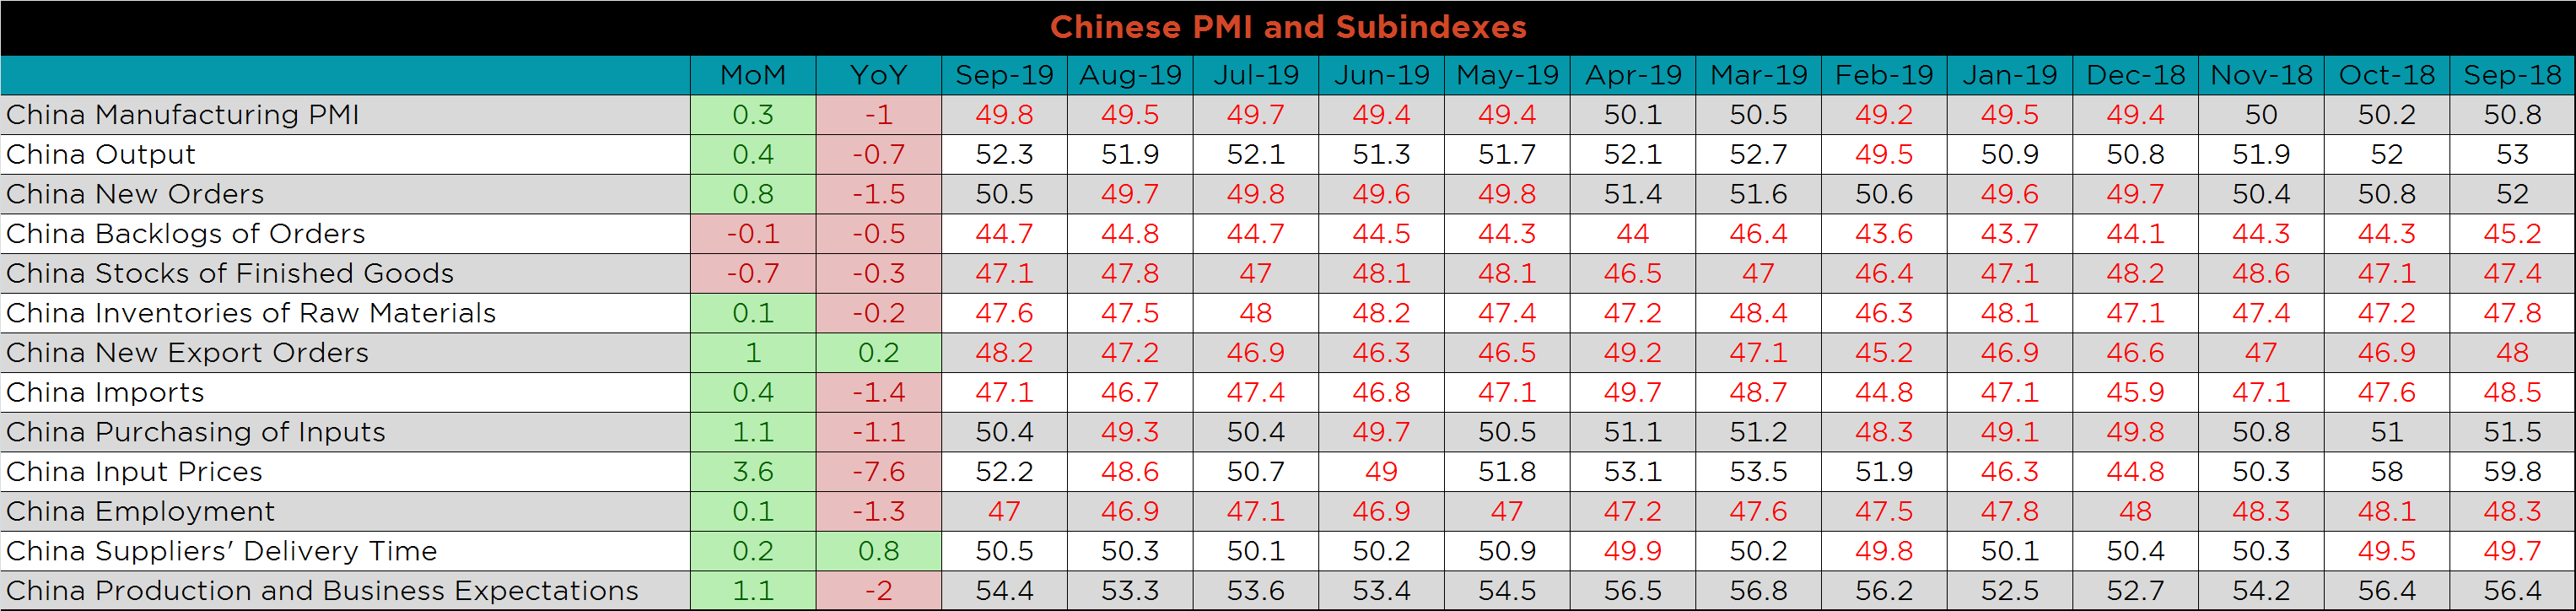
The table below breaks down China’s official manufacturing PMI subindexes. Compared to last year, the only subindexes to show improvement are new export orders and suppliers delivery times. The headline number does show improvement compared to the previous four months, but remains in contraction. Output, new orders, input prices, purchasing of inputs, supplier delivery times and business expectations all moved higher into expansion. While the data does not show strength, there is improvement in key areas.
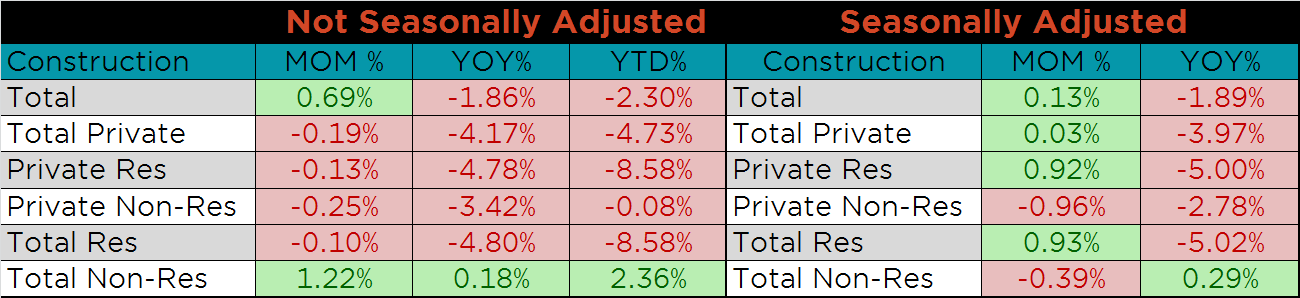
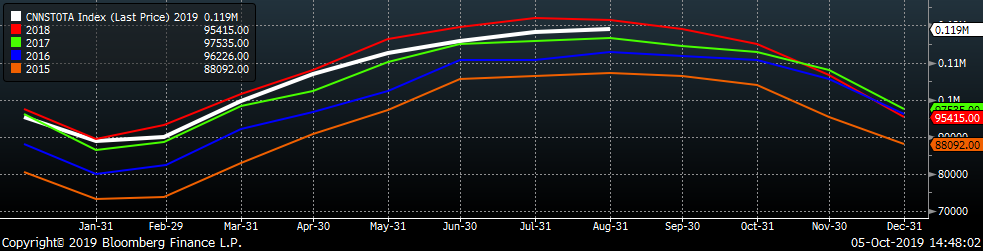
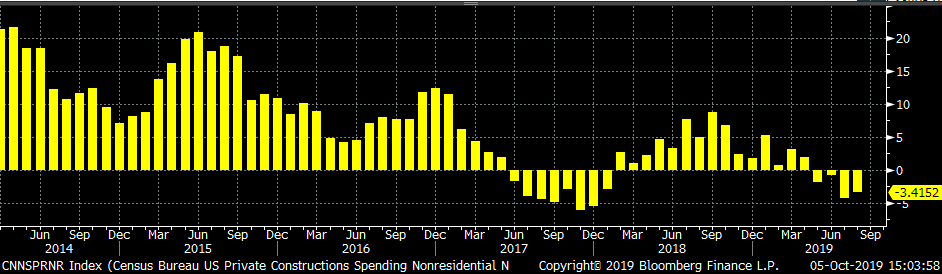
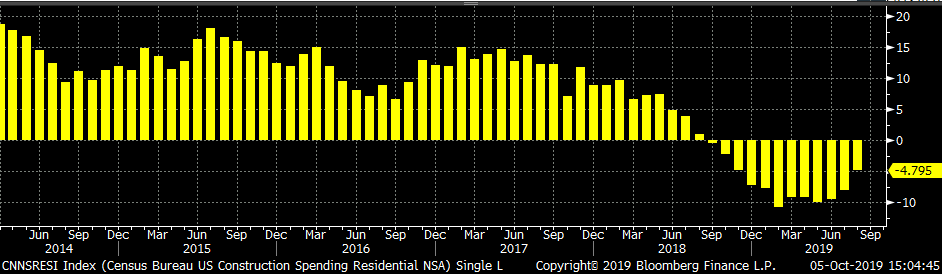
August seasonally adjusted U.S. construction spending was up slightly MoM, but down 1.9% YoY. Seasonally adjusted spending is below the high levels of 2018 levels for all of the categories except total non-residential. Nonresidential spending, not seasonally adjusted, remains the strongest of the group, higher MoM, YoY and YTD. However, this is driven by public construction spending, which is less steel intensive.
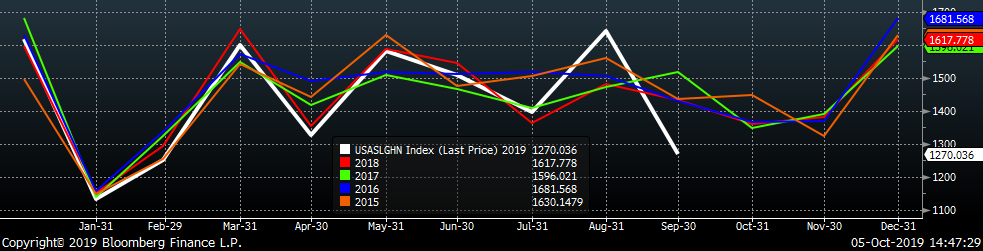
The white line in the chart below represents construction spending in each month of 2019 and compares it to the spending of the previous 4 years.
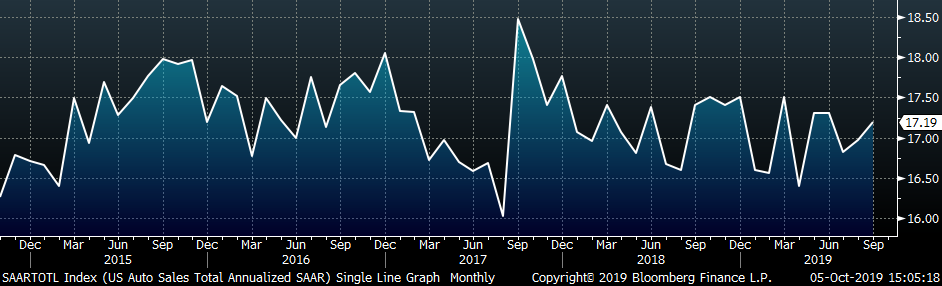
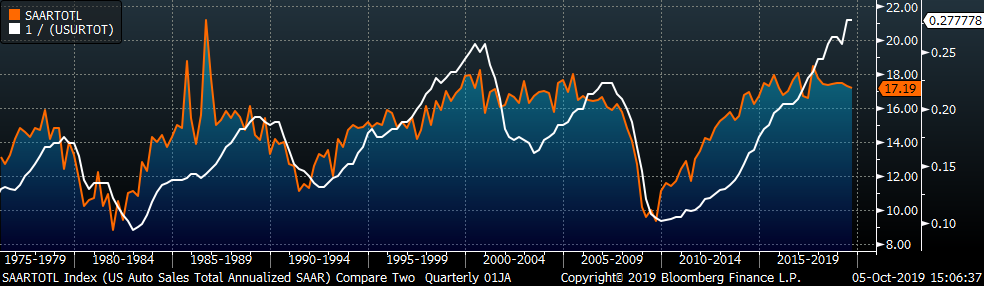
September U.S. light vehicle sales were up 220k to a 17.19m seasonally adjusted annualized rate (S.A.A.R). The white line in the second chart below compares monthly auto sales with previous years’ levels. The first 7 months of 2019 have been in line with sales of the previous 4 years, and the higher than average auto sales in August were offset by the lower reading in September. The UAW strike affecting GM may continue to pressure sales going forward. The final chart shows the historical relationship between unemployment and auto sales. We have inverted the unemployment rate to show that declining unemployment typically leads to increasing auto sales.
Below are the most pertinent upside and downside price risks:
Upside Risks:
Downside Risks:
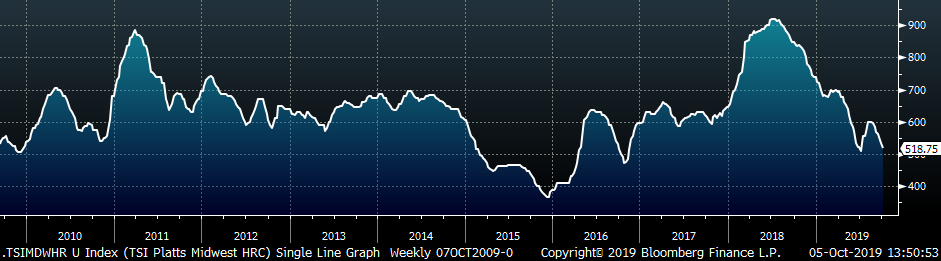
The Platts TSI Daily Midwest HRC Index was down $15.75 to $518.75.
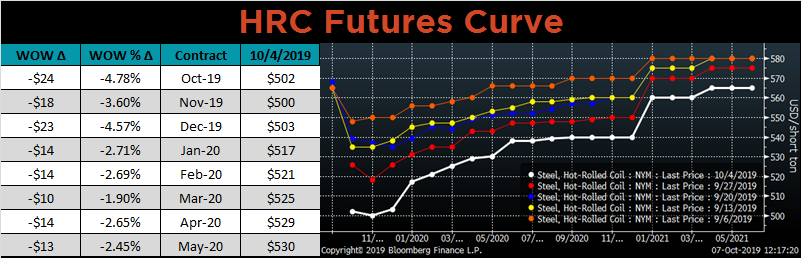
The CME Midwest HRC futures curve is below with last Friday’s settlements in white. The curve has continued to move lower across all expirations, most significantly in the front as inactivity continues to push spot prices lower.
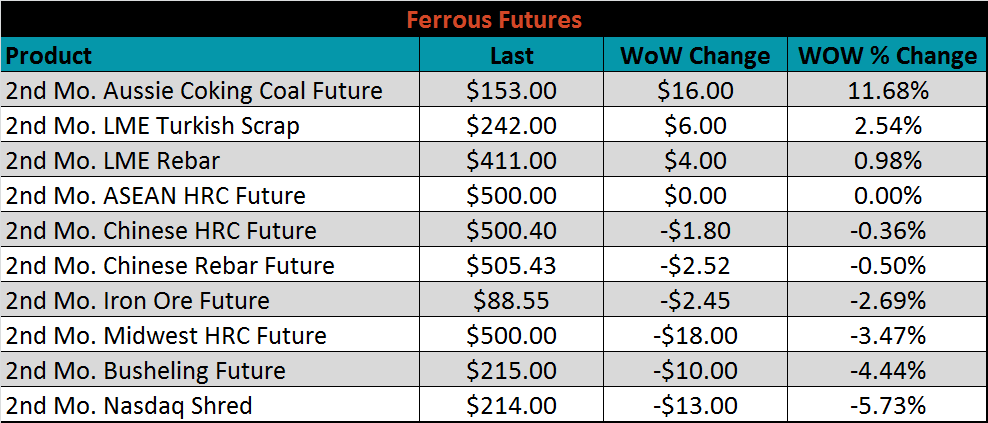
November ferrous futures were mostly lower. The Aussie coking coal future gained 11.7%, while Nasdaq shred lost 5.7%.
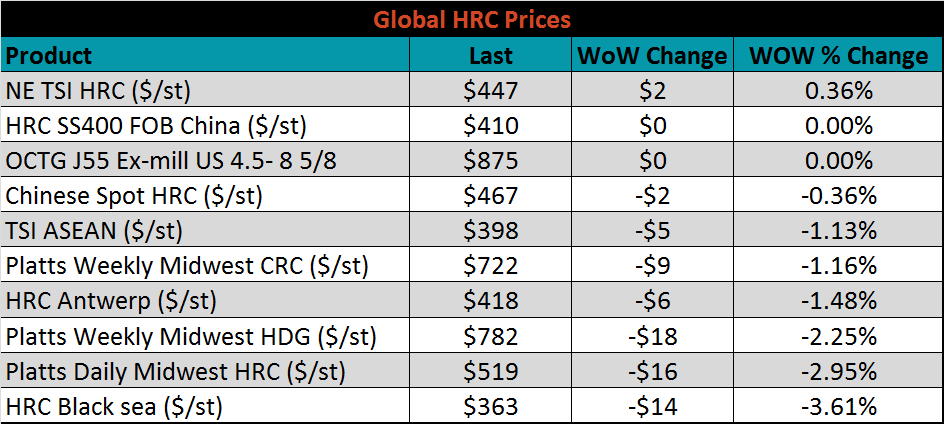
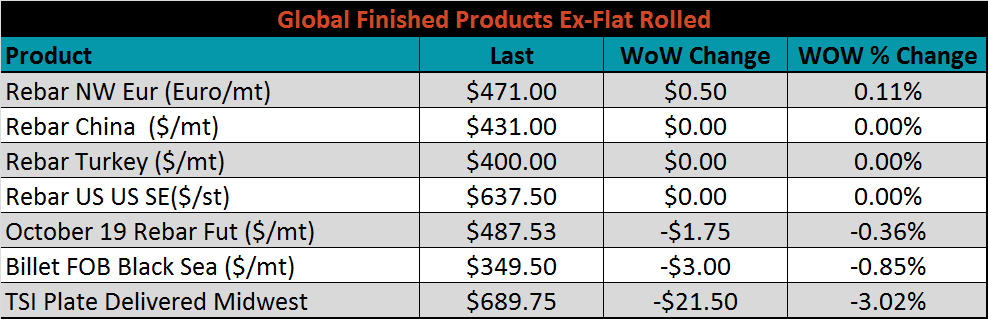
The global flat rolled indexes were mostly lower. Northern European TSI HRC was up slightly, while HRC Black Sea was down 3.6%.
September flat rolled import license data is forecasting a decrease of 74k to 657k MoM.
September flat rolled import license data is forecasting a decrease of 53k to 689k MoM.
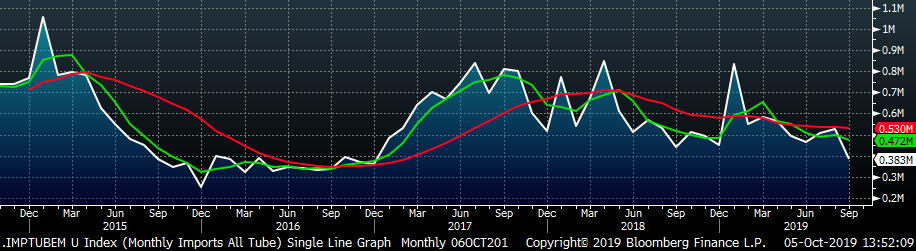
Tube imports license data is forecasting a MoM decrease of 95k to 383k tons in September.
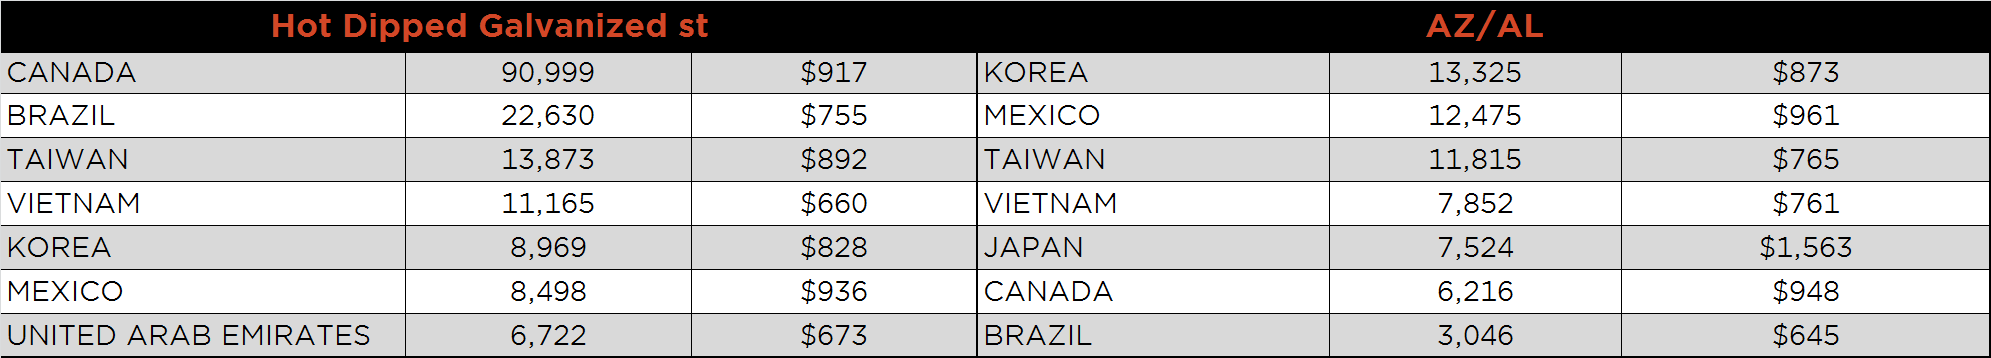
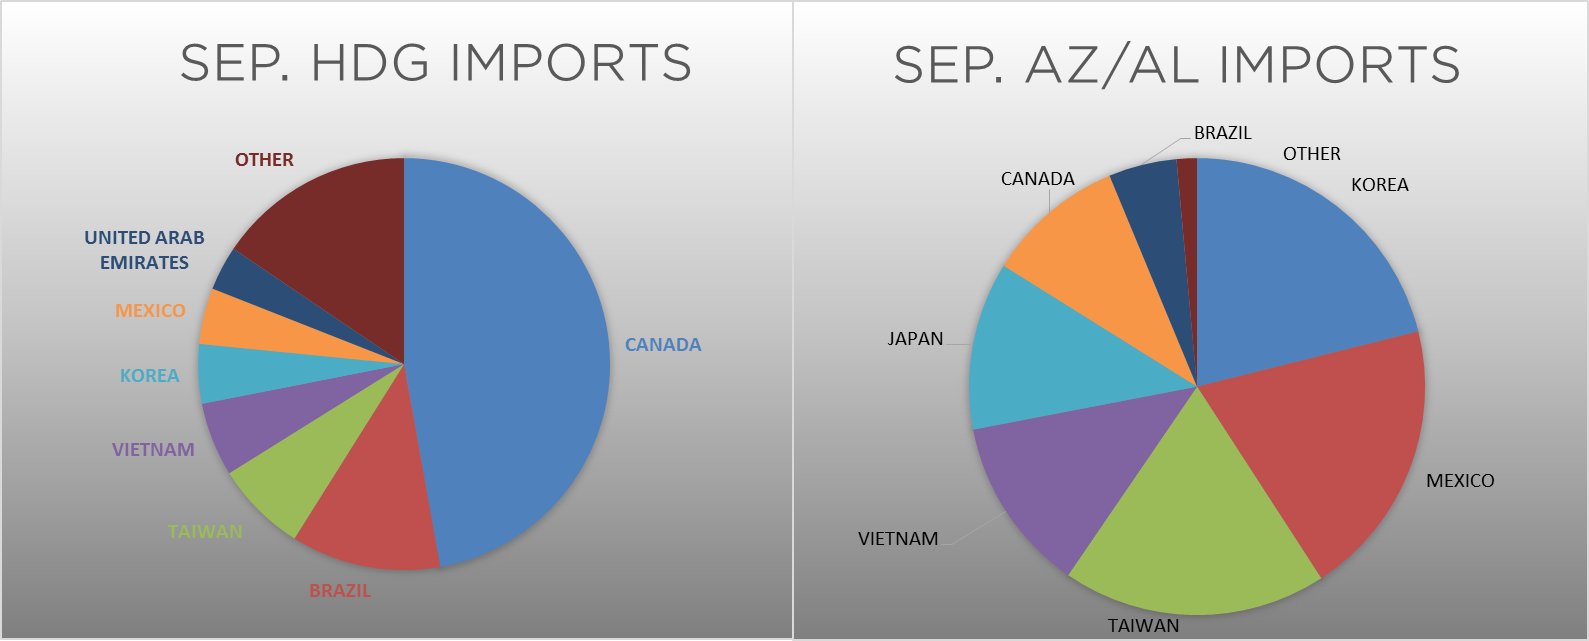
AZ/AL import license data is forecasting an increase of 1k in September to 63k.
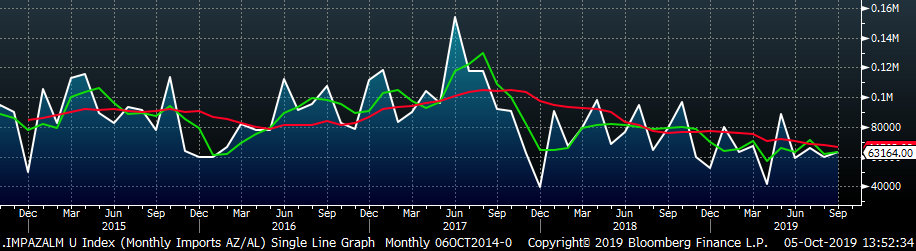
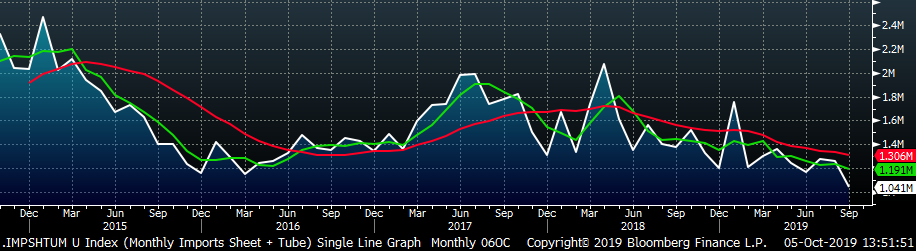
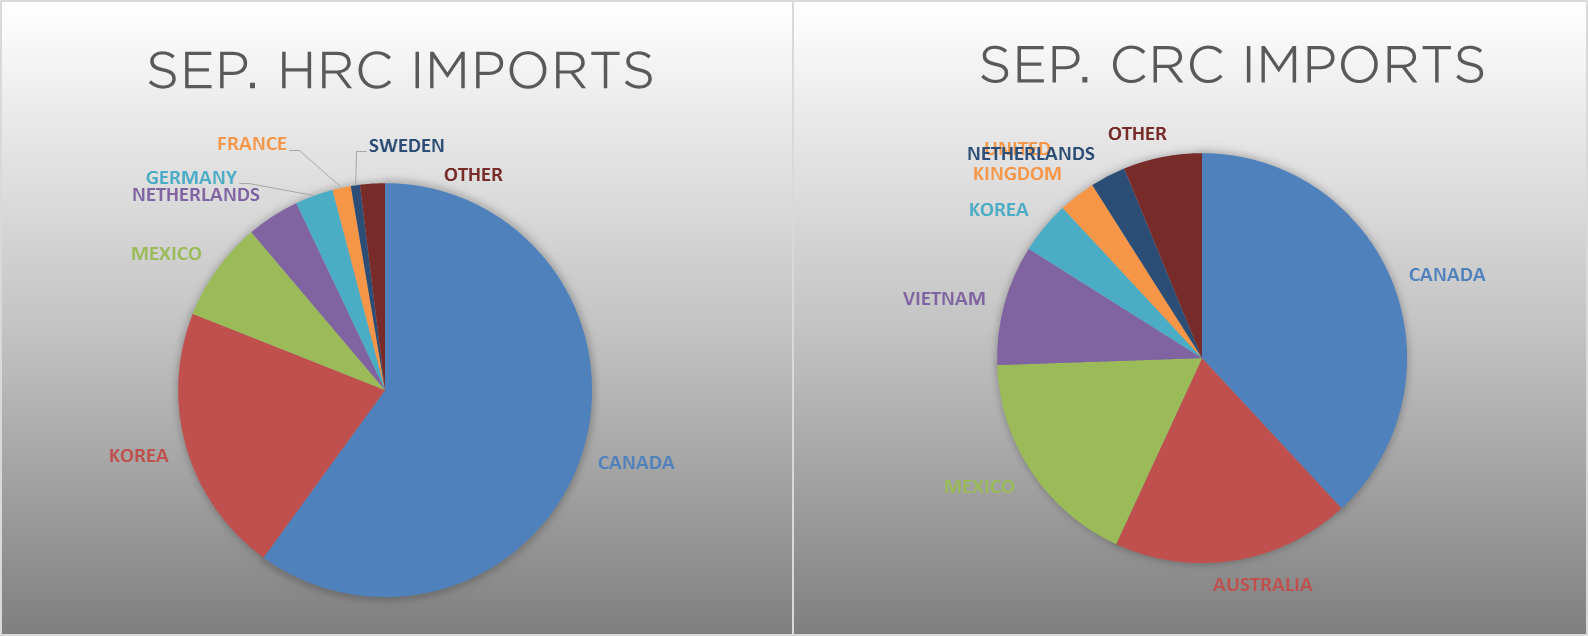
Below is September import license data through October 1, 2019.
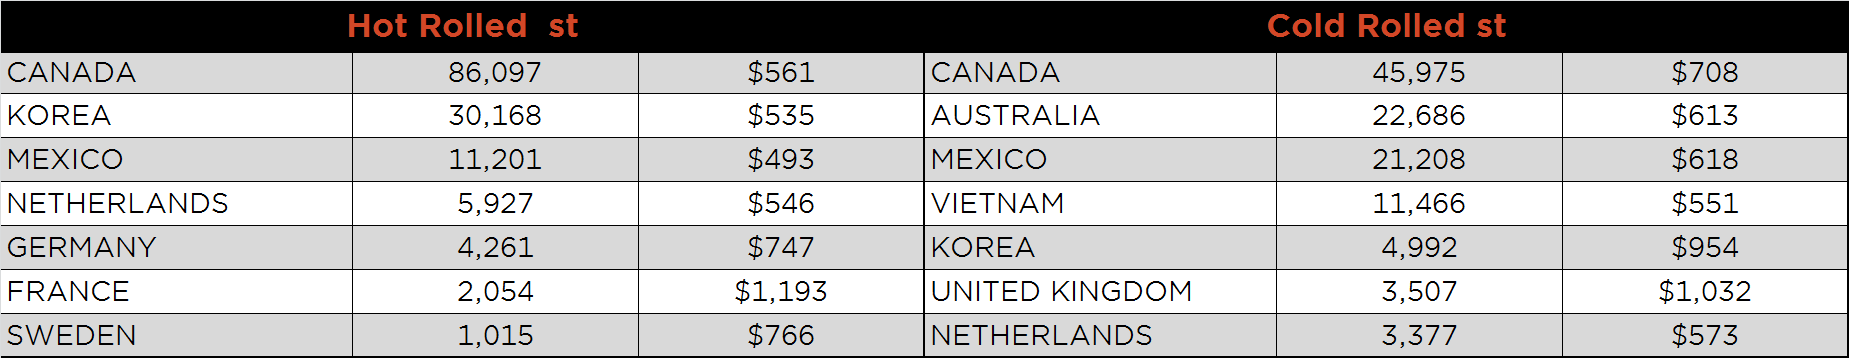
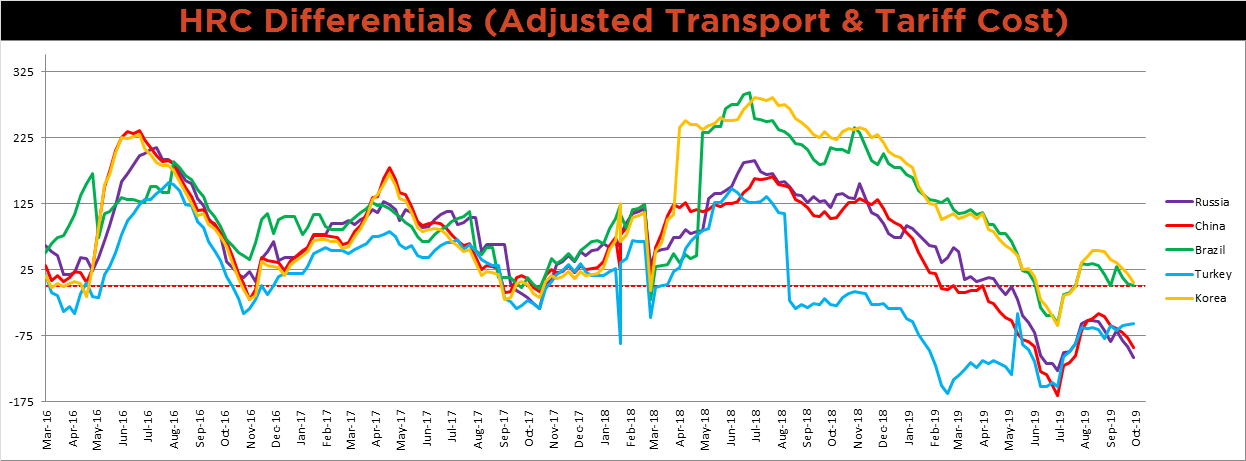
Below is the Midwest HRC price vs. each listed country’s export price using pricing from SBB Platts. We have adjusted each export price to include any tariff or transportation cost to get a comparable delivered price. Turkey’s price has been the only referenced price declining, therefore increasing the differential to the Midwest price. However, with a 25% tariff still in place, importing from Turkey continues to be unattractive.
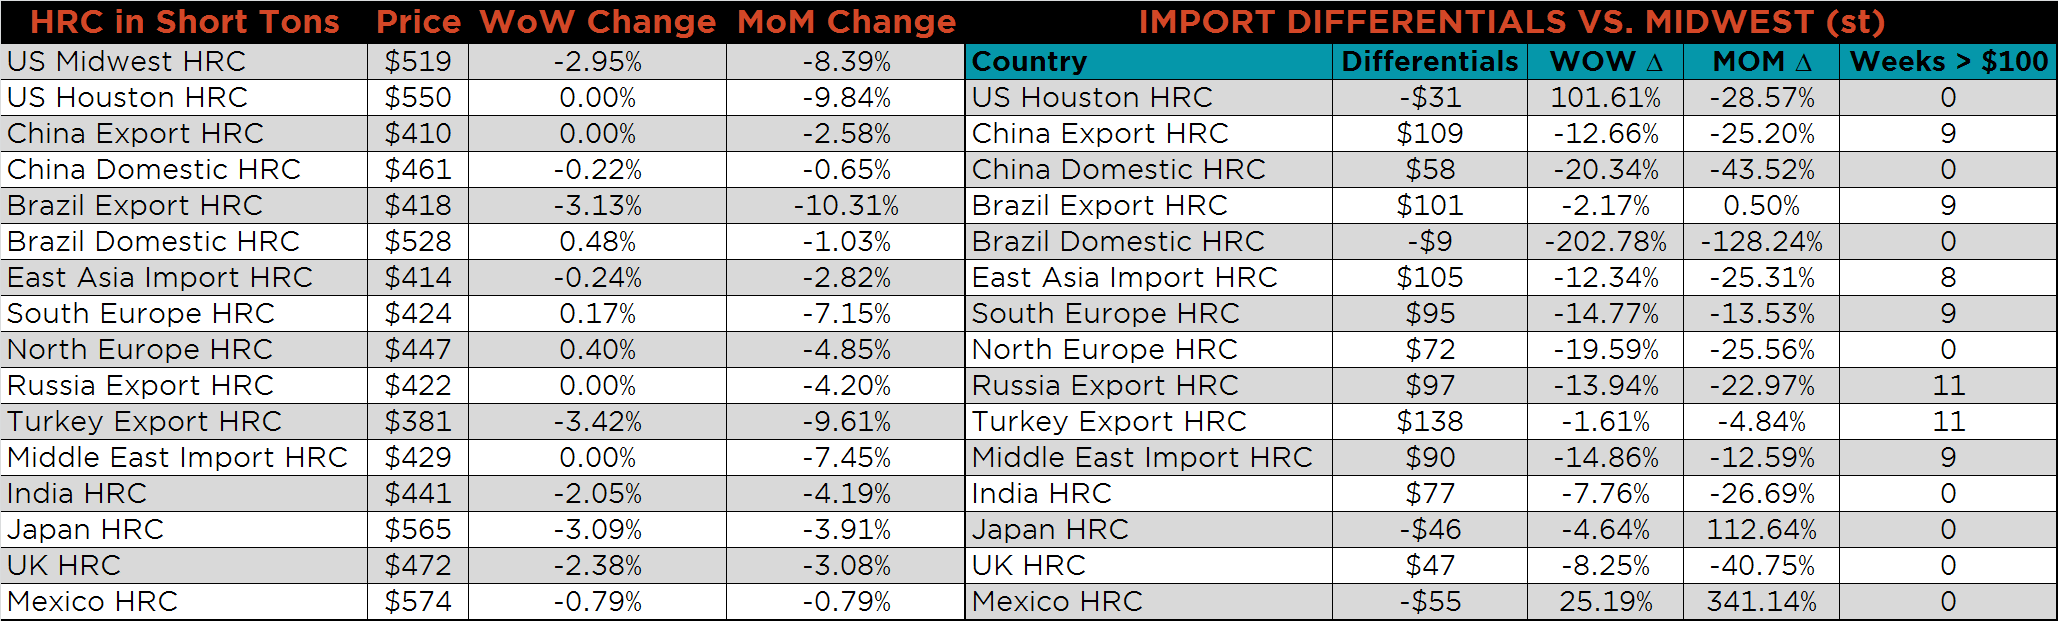
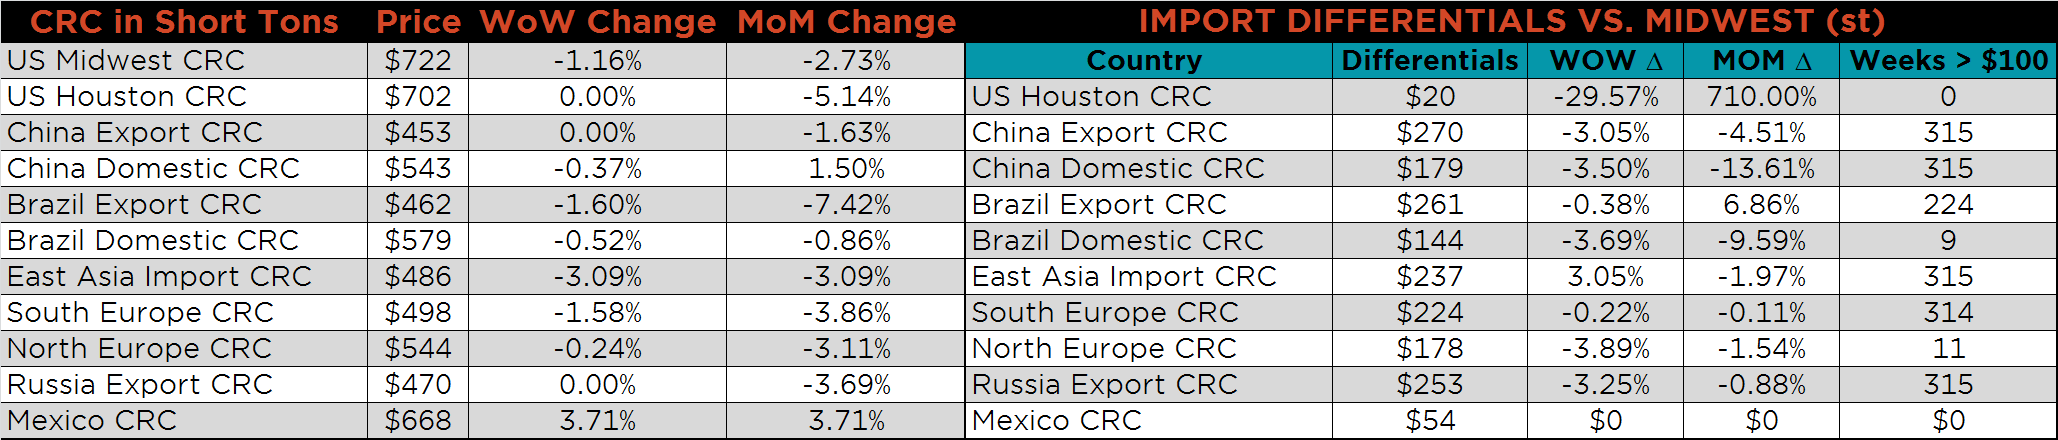
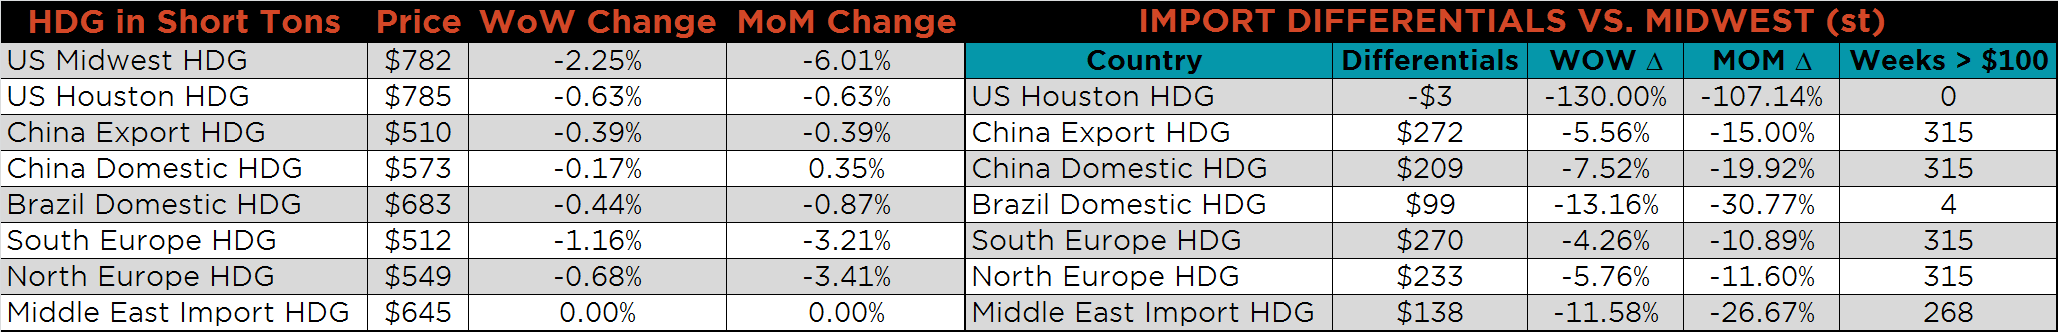
SBB Platt’s HRC, CRC and HDG pricing is below. The Midwest HRC price was down 3% while HDG and CRC prices were down 2.3% and 1.2%, respectively. Turkish and Brazilian HRC export prices were lower as well, 3.4% and 3.1%, respectively.
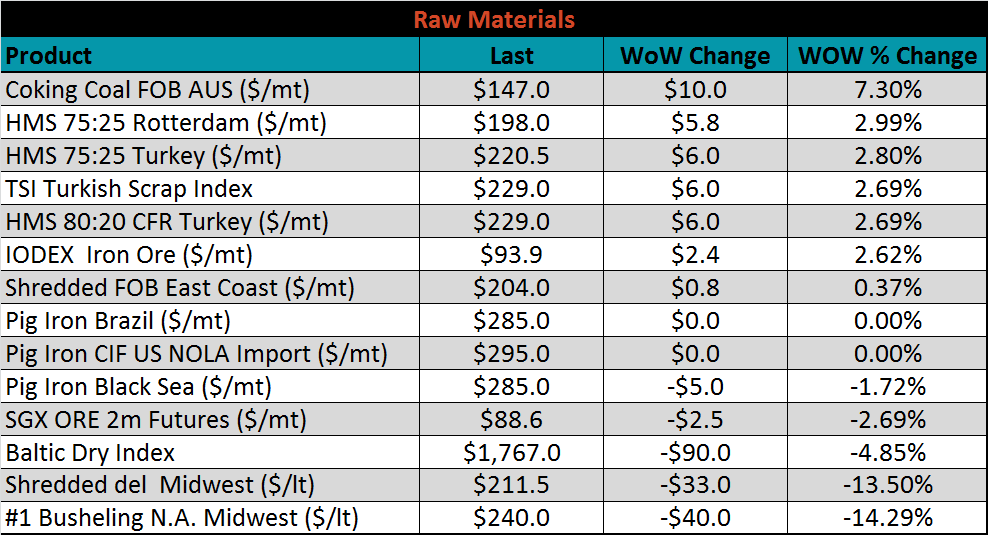
Raw material prices were mixed. Midwest busheling was down 14.3%, while coking coal was up 7.3%.
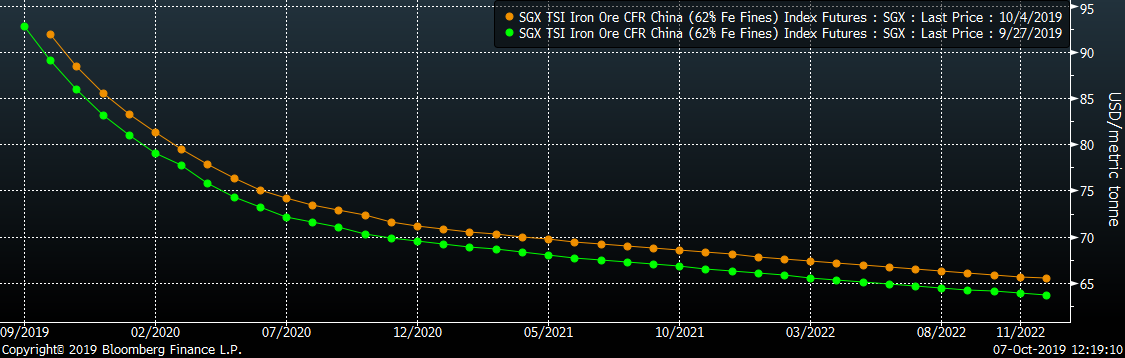
Below is the iron ore future curve with Friday’s settlments in orange, and the prior week’s settlements in green. The entire curve shifted higher across all expirations last week.
The ex-flat rolled prices are listed below.

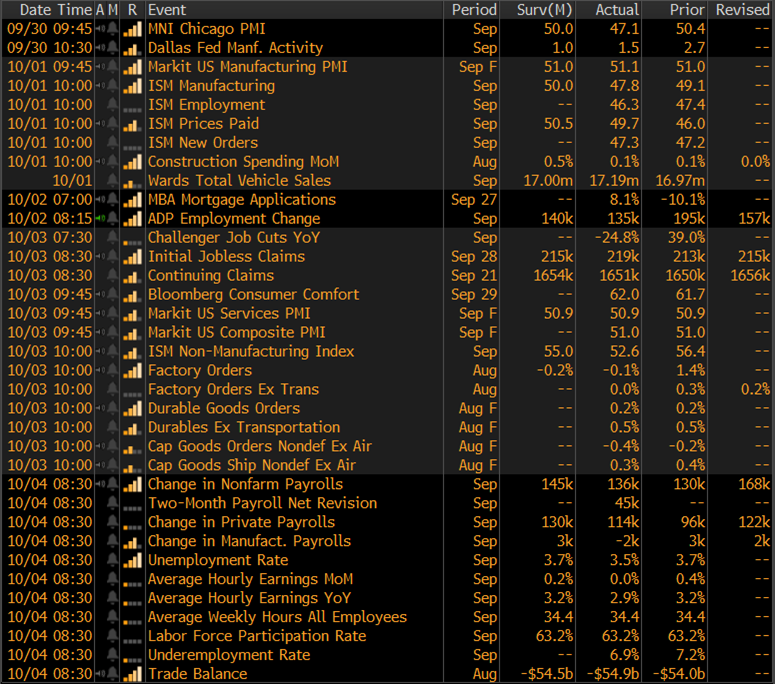
Of the remaining significant economic data is below, the biggest surprise of the week was the non-manufacturing PMI falling far below expectations. We have seen weakness in the manufacturing industry through multiple different economic indicators, but this was the first sign of weakness in consumer sentiment, which has remained strong through the tariffs and trade wars.
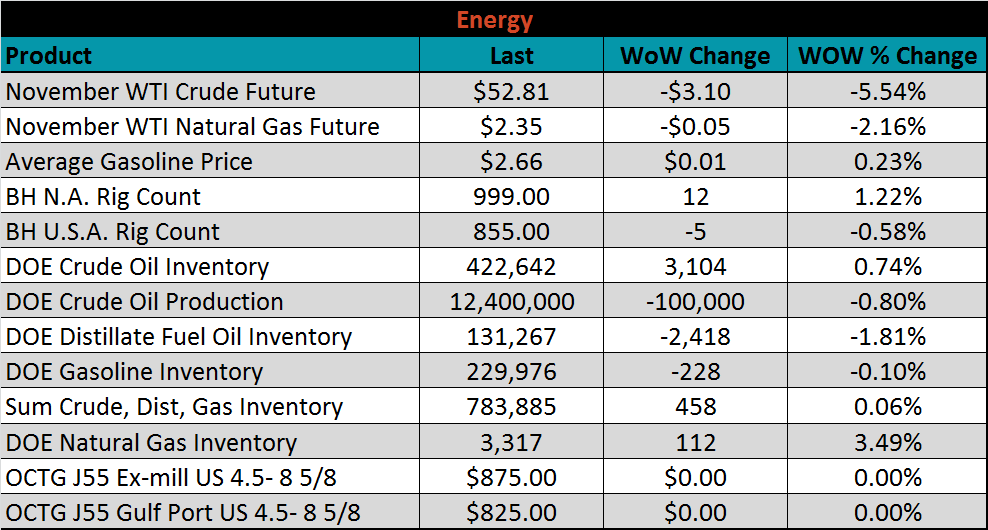
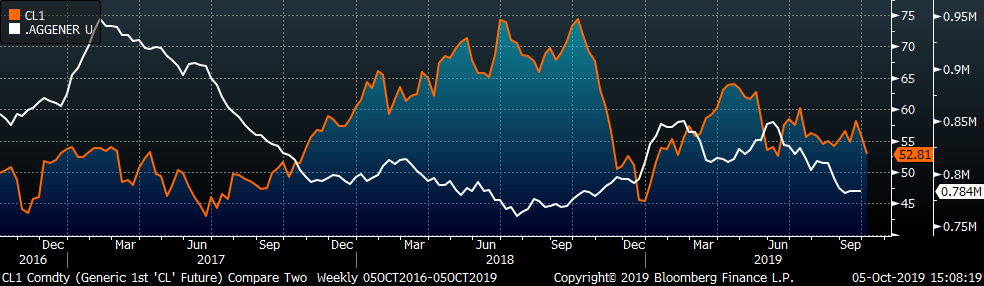
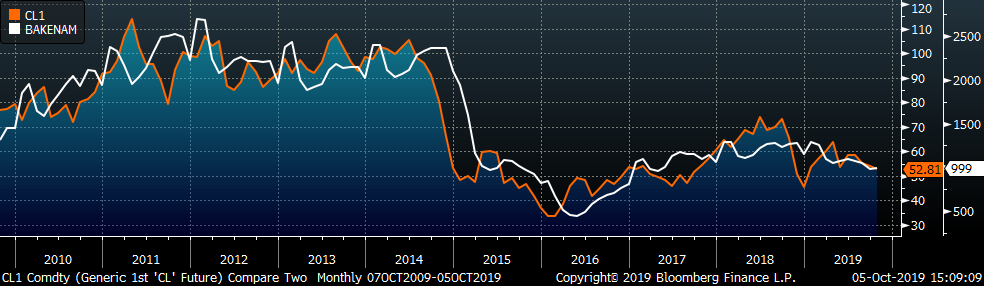
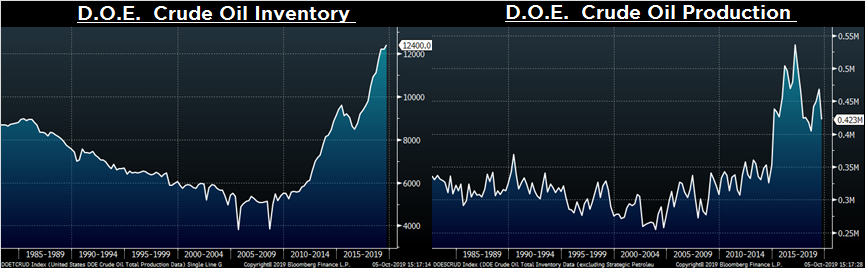
Last week, the November WTI crude oil future lost another $3.10 or 5.5% to $52.81/bbl. The aggregate inventory level was essentially flat, and crude oil production rose to 12.5m bbl/day. The Baker Hughes North American rig count gained twelve, while the U.S. count lost five.
The list below details some upside and downside risks relevant to the steel industry. The orange ones are occurring or look to be highly likely. The upside risks look to be in control.
Upside Risks:
Downside Risks: