Content
-
Weekly Highlights
- Market Commentary
- Upside & Downside Risks


Last week was significant for the physical market, as some of the numbers that have been floated through the rumor mill started to show up in published HRC spot prices. As lead times continue to come in and limited spot tons enter the market, it is becoming clear that more mills are willing to negotiate to make sales. With mills operating at record levels of profitability, the big question around what the downside of this cycle will look like is if any of the big 4 are willing to cut into profitably per ton for the opportunity of larger market share. Over the last 5-10 years, we’ve looked to EAF mills as first movers with more flexibility in both output and cost to anticipate new trends. Looking forward, it is less clear how dynamics between EAFs and BOFs will influence the spot prices for both steel and scrap. In the remainder of this week’s report, we will dive into the global dynamics shaping the scrap market over the next couple of years and how the potential global energy crisis may bring that timeline forward.

The historic relationship/correlation between Scrap and HRC broke down early in the rally as HRC significantly outpaced scrap and the metal spread broke above the previous record high. With such a long-standing relationship, it is assumed that the two markets will act largely in tandem as the gap between their prices collapse. Meaning the metal spread will converge because of a more dramatic decrease in HRC prices than in scrap. However, recent global and domestic developments point to a more supportive market for scrap than HRC. To start, the natural gas shortage is shaping up to cause severe decreases in economic activity and scrap generation in the Northern Hemisphere, specifically in Europe, the World’s largest exporter of ferrous scrap. The pandemic fast forwarded the inevitable in the steel market (e.g., mill consolidation, and demand for new homes, cars, and consumer goods). We anticipate this energy crisis will also expedite already existing trends for scrap. This includes regional restrictions for exports, and a global push towards increased EAF production (starting in China and expanding from there). While existing EAF’s have shown the ability to reduce costs by adjusting their mixes, an increase in demand and a decrease in free-flowing supply suggests the old rules may not apply to the market going forward.
What will this all mean for the U.S. domestic steel and scrap markets? Additional EAF furnaces are coming online domestically and will only intensify the higher sustained demand for scrap. Long running symbiotic relationships between mills and the manufacturing sector have left mills less exposed to spot market volatility historically because supply and demand was largely balanced. However, the relationship between both pricing and supply/demand has changed for the HRC and scrap markets. The ambiguity around where these prices will converge is a significant risk, but it is certain that higher scrap prices will give support to falling HRC.
The increased uncertainty around fair value for steel has the potential to lead to a more severe buyers strike. In 2020 when prices dipped below $500, there was very little room left to the downside, in large part because of the tightness of the metal spread. This provided buyers a higher level of confidence for when to start restocking. In our current market, a tightening of the metals spread will likely have the similar impact, but at these prices, the consequence of being wrong about the timing of purchases will have far more of an impact on your businesses balance sheet.

Below are the most pertinent upside and downside price risks:
Upside Risks:
Downside Risks:

The Platts TSI Daily Midwest HRC Index decreased by $50 to $1,900.

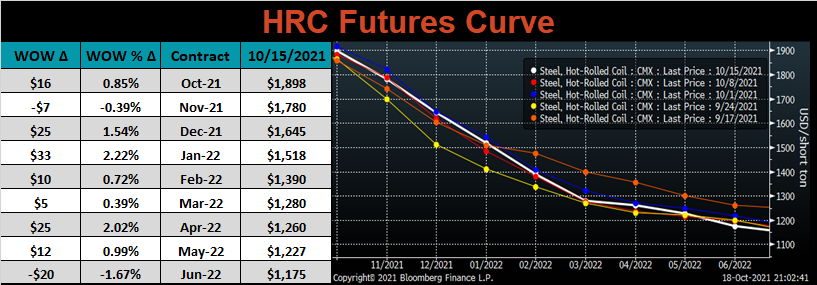
The CME Midwest HRC futures curve is below with last Friday’s settlements in white. Last week, the curve was mixed, but most expirations were slightly higher, led by January up $33, while June of next year was $20 lower.
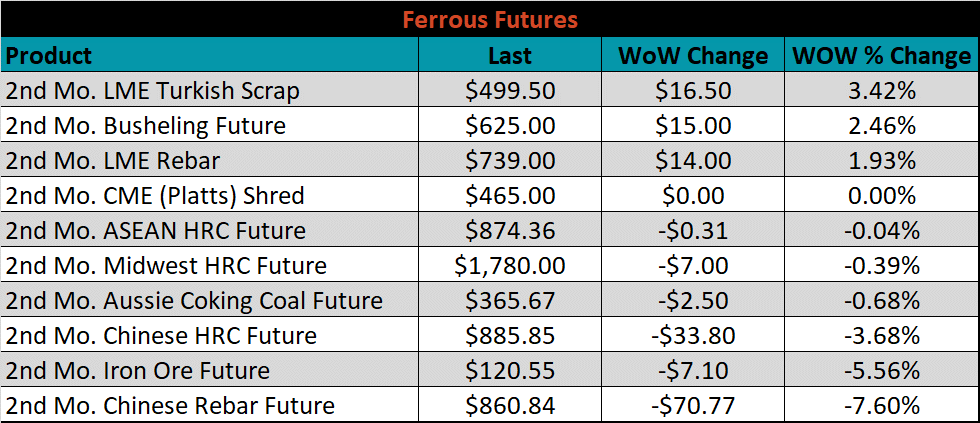
November ferrous futures were mixed. Turkish scrap was up another 3.4%, while Chinese rebar lost 7.6%.
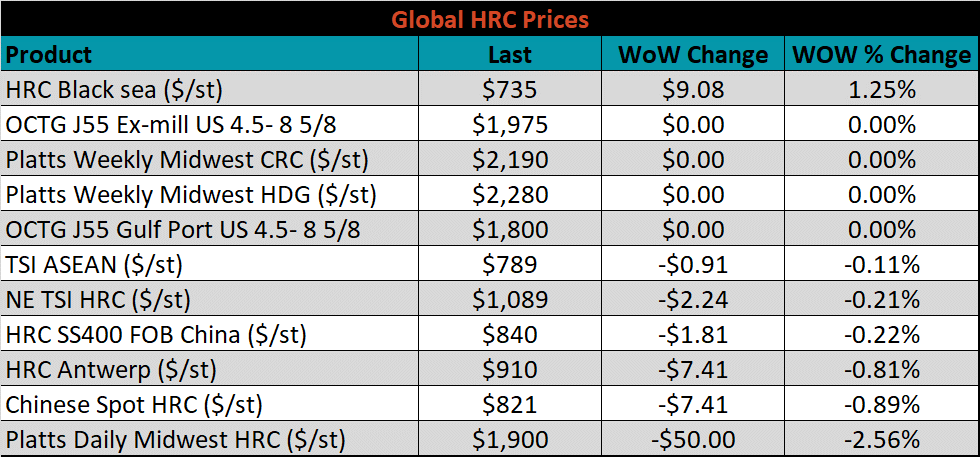
Global flat rolled indexes were mostly down small, led by Midwest HRC, down 2.6%, while Black Sea HRC was up 1.3%.
The AISI Capacity Utilization was down 0.6% to 84.2%.


October flat rolled import license data is forecasting a decrease of 39k to 1,020k MoM.

Tube imports license data is forecasting a decrease of 192k to 296k in October.


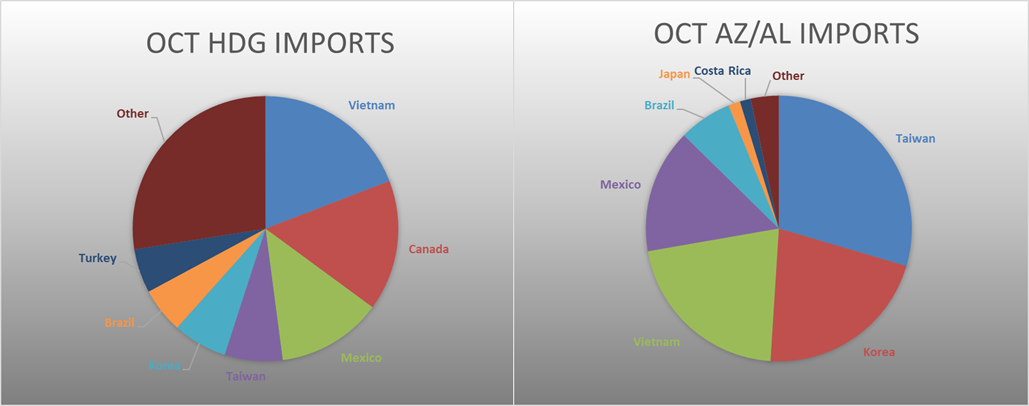
October AZ/AL import license data is forecasting an increase of 5k to 132k.

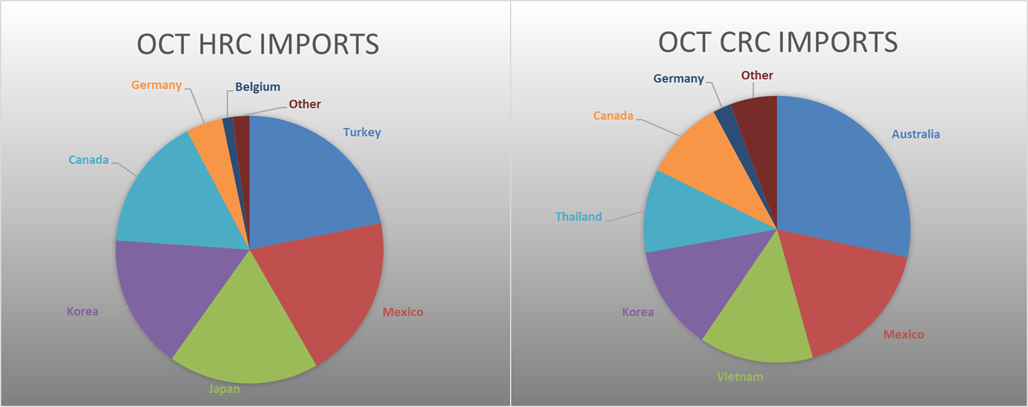
Below is September import license data through October 11th, 2021.


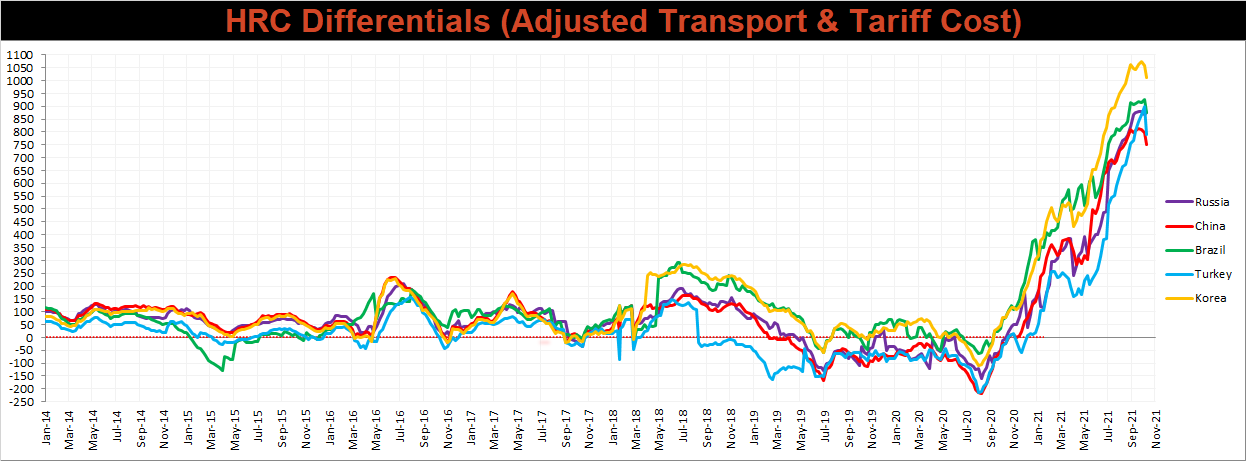
Below is the Midwest HRC price vs. each listed country’s export price using pricing from SBB Platts. We have adjusted each export price to include any tariff or transportation cost to get a comparable delivered price. Differentials decreased significantly for all the watched countries except for Russia, as the U.S. domestic price moved significantly lower for the first time in nearly 14 months.
SBB Platt’s CRC, HDG and HRC pricing is below. The Midwest CRC and HDG prices were unchanged, while the HRC price was down 2.6%. Outside of the U.S., the Turkish HRC export price was up 6%.


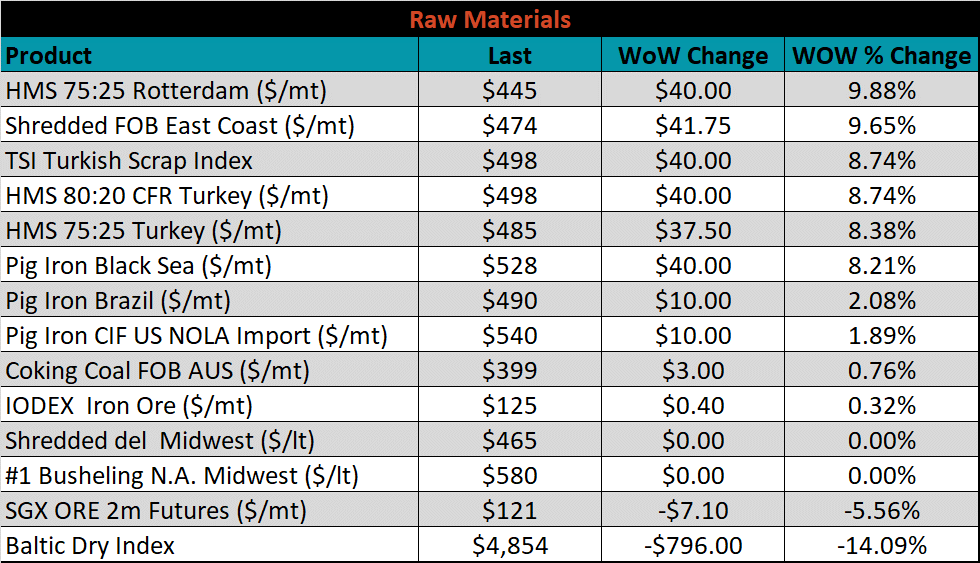
Raw material prices were mostly higher, led by Rotterdam 75:25 HMS, up 9.9%, while November iron ore futures lost 5.6%.
Below is the iron ore future curve with Friday’s settlements in orange, and the prior week’s settlements in green. Last week, the entire curve reversed the 3 week trend and shifted lower. This also reversed the recent flatenning of the curve, as later expirations fell far more significantly than anything in the next 3-6 months.

The ex-flat rolled prices are listed below.


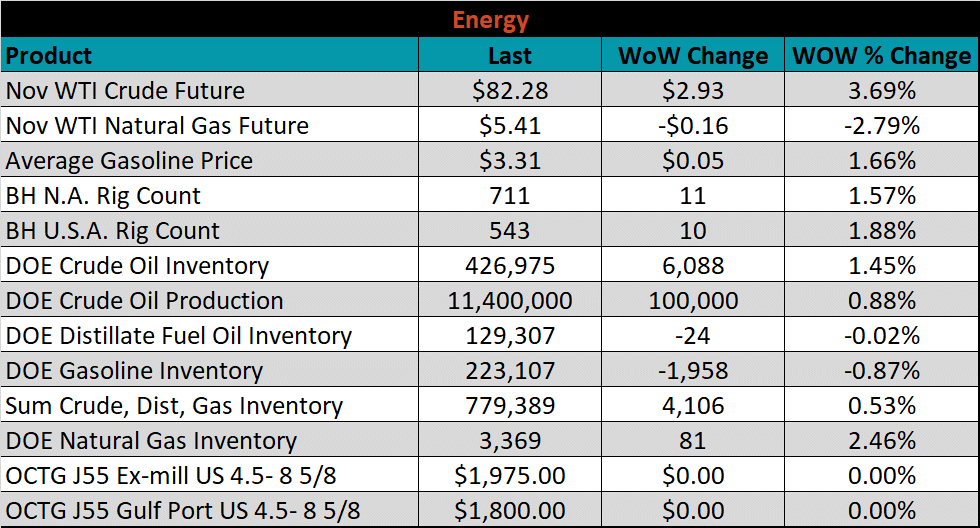
Last week, the November WTI crude oil future was up another $2.93 or 3.7% to $82.28/bbl. The aggregate inventory level was up 0.5%, and crude oil production increased to 11.4m bbl/day. The Baker Hughes North American rig count was up another 11 rigs, and the U.S. rig count was up 10 rigs.


The list below details some upside and downside risks relevant to the steel industry. The bolded ones are occurring or highly likely.
Upside Risks:
Downside Risks: