Content
-
Weekly Highlights
- Market Commentary
- Risks


While spot HRC prices continued to slide over the last week, there appears to be a change in the market’s sentiment regarding the pricing outlook. The futures curve saw buyers continue to enter the market, pushing the curve higher in 2020 for the second week in a row. Some of this buying is likely attributable to end users locking in tonnage at low prices for next year. However, this is creating an interesting divergence between spot prices and future curve prices, which provides insight into the market’s expectations. Below is a chart of the 6th month future price minus the 3rd month price, showing the divergence, or contango, of near term versus longer-term prices.
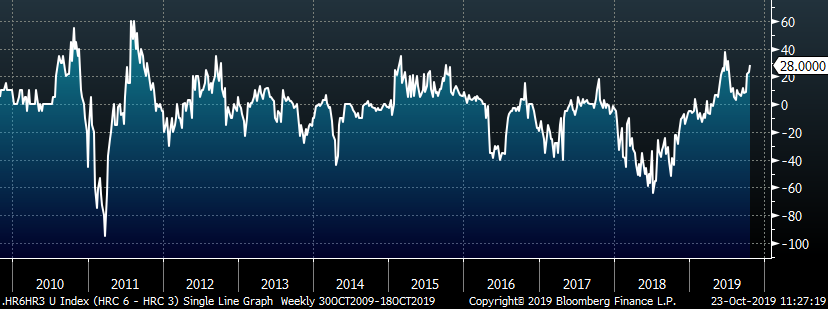
The contango is reaching historically high levels, and these peaks tend to precede spot price rallies. The steep futures curve reveals the market’s expectations that spot prices in the future will be higher than the current price. Therefore, the ideal strategy for steel purchasers is to buy spot tons now. This is a change from their successful approach over the last several months of delaying purchases into shrinking lead times.
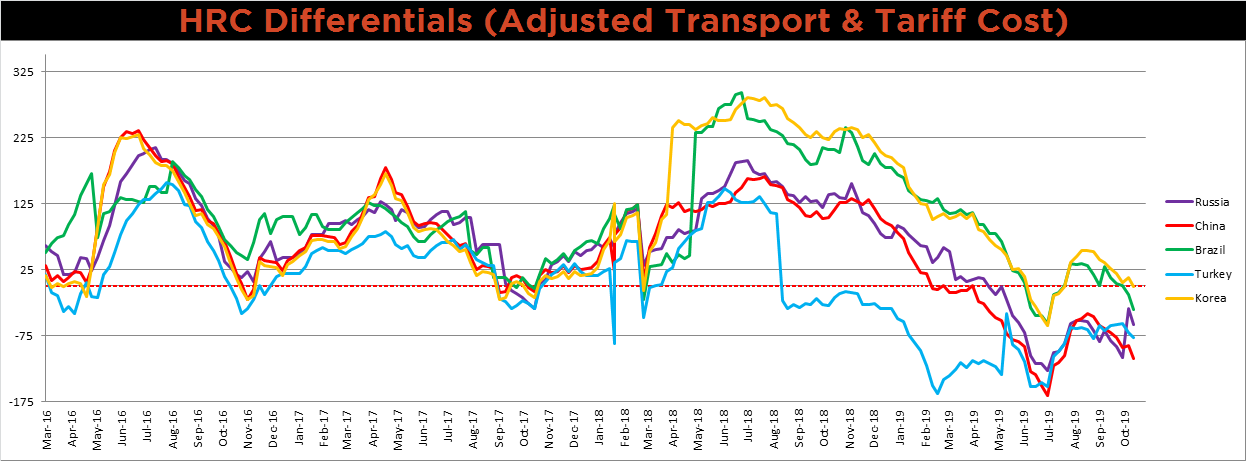
Another indicator that is also reaching an inflection point is the China price differential, the difference between the Midwest HRC price and the China export price, including transportation costs.
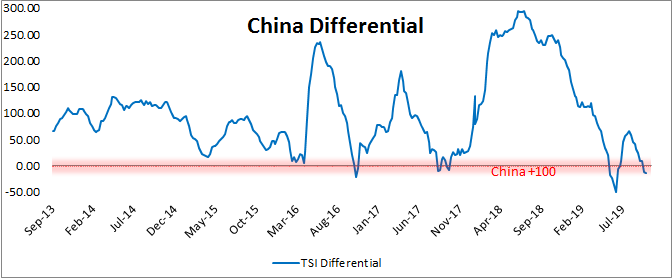
Historical data tells us when the differential crosses the horizontal red zero line, a sharp rally occurs in the spot price. This week the differential breached the zero line. Whether you believe prices have reached a bottom or still have more room to fall, it is important to understand the current risk and reward for your business in terms of pricing. Based on the current conditions, we estimate a downside price reward for a steel purchaser of $20 to $40/st while the upside price risk is $130 to $150/st. Hedging future purchases and/or buying spot tons is the obvious decision right now.
Below are the most pertinent upside and downside price risks:
Upside Risks:
Downside Risks:
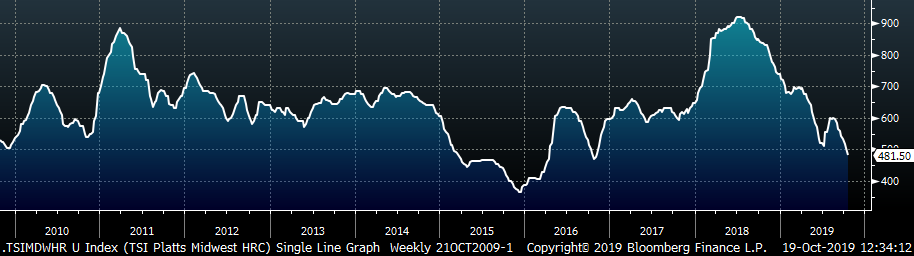
The Platts TSI Daily Midwest HRC Index was down $23.50 to $481.50.
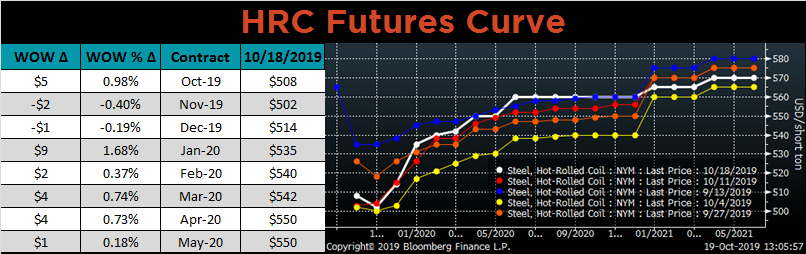
The CME Midwest HRC futures curve is below with last Friday’s settlements in white. The curve moved slightly higher over the last week.
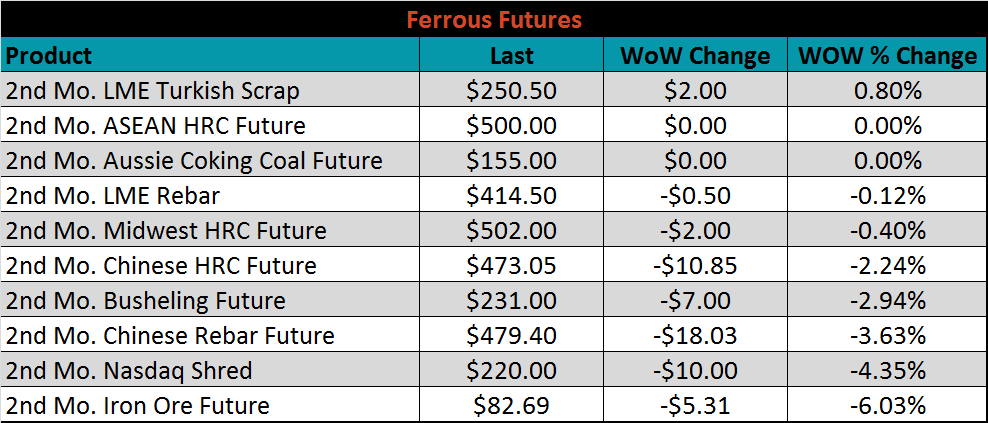
November ferrous futures were mostly lower. The iron ore future lost 6%.
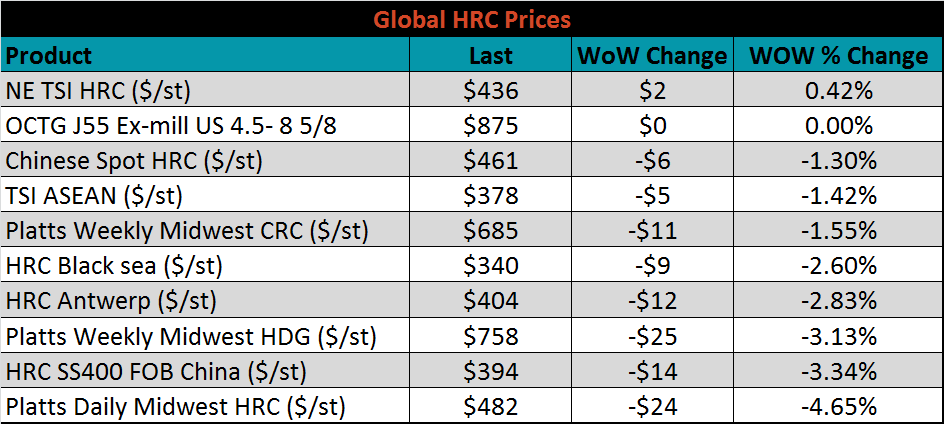
The global flat rolled indexes were mostly lower. Northern European TSI HRC was up slightly again, while Midwest TSI HRC was down 4.7%.
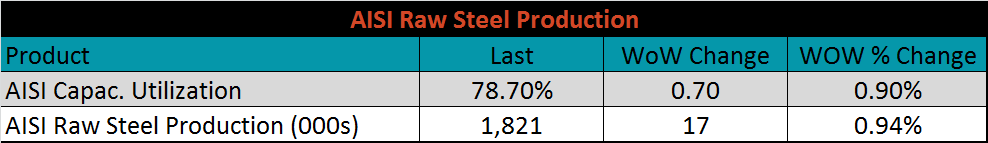
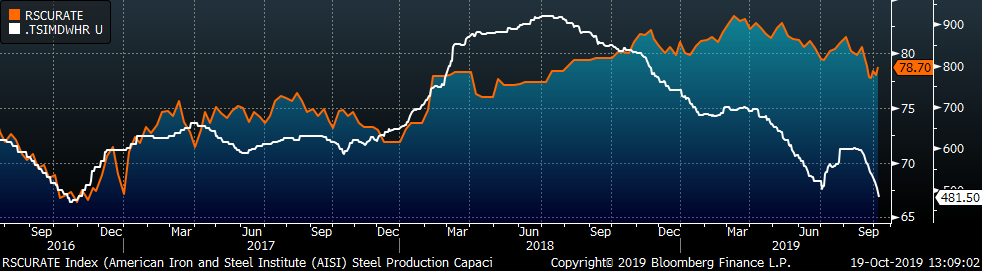
The AISI Capacity Utilization Rate was up 0.7% to 78.7%, and remains below the 80% goal set by the Trump administration. Mills are likely bringing production forward due to planned outages in the 4th quarter.
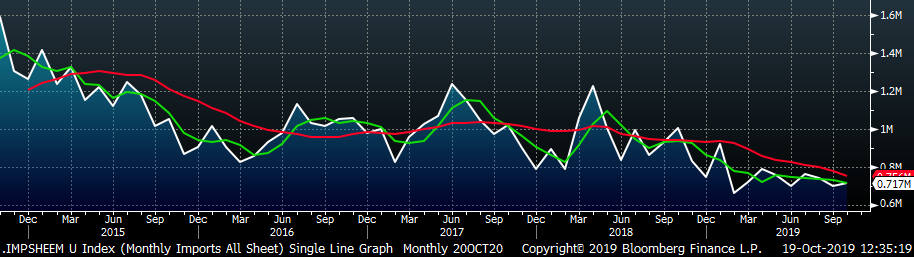
October flat rolled import license data is forecasting an increase of 16k to 717k MoM.
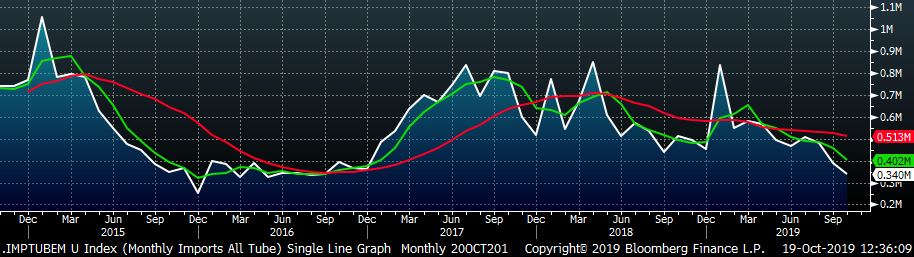
Tube imports license data is forecasting a MoM decrease of 48k to 340k tons in October.
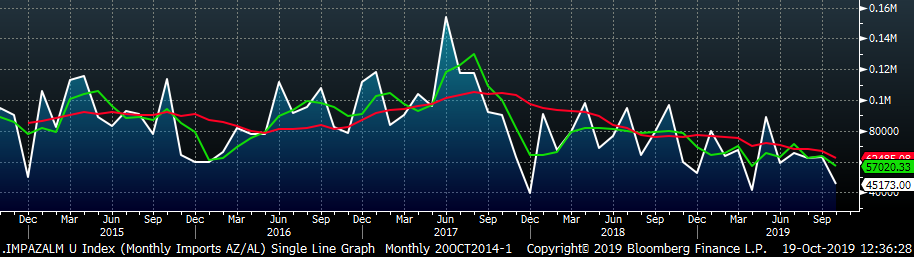
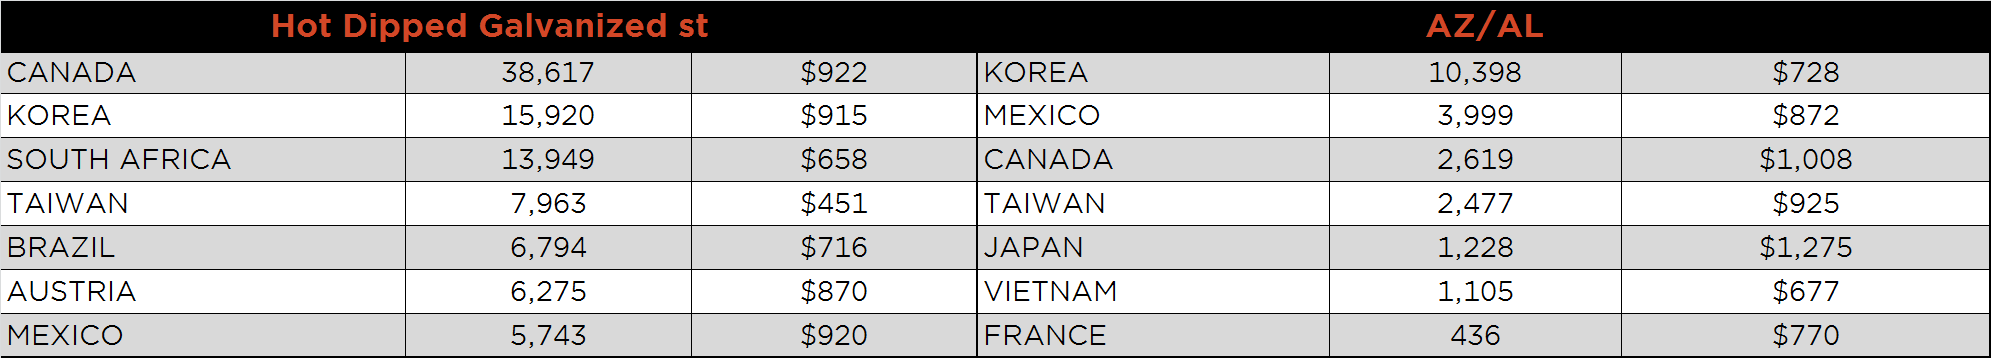
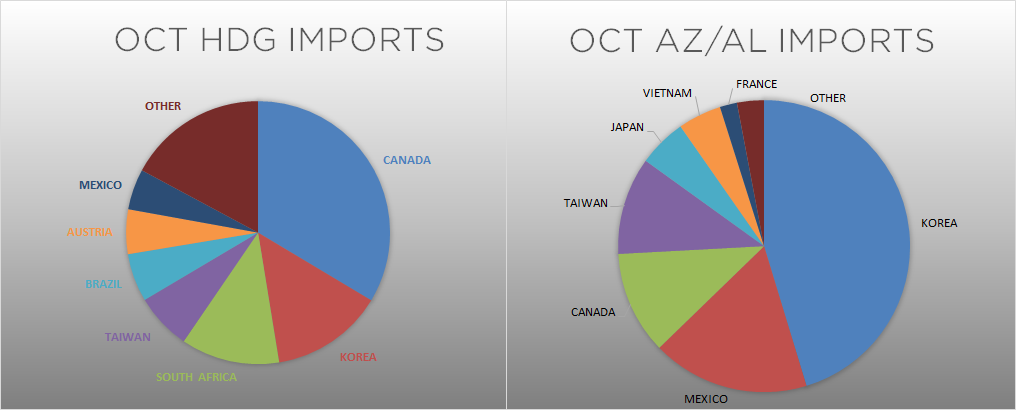
AZ/AL import license data is forecasting a decrease of 18k in October to 45k.
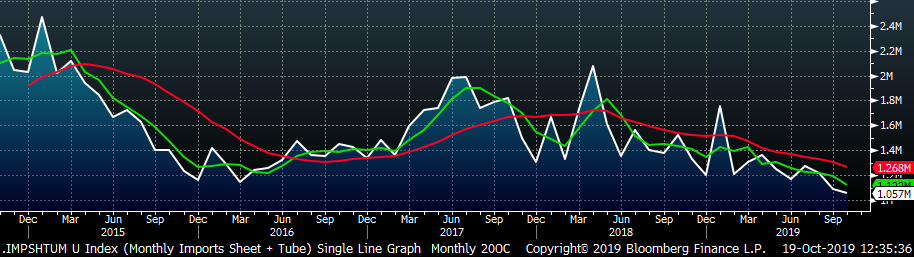
Below is September import license data through October 15, 2019.
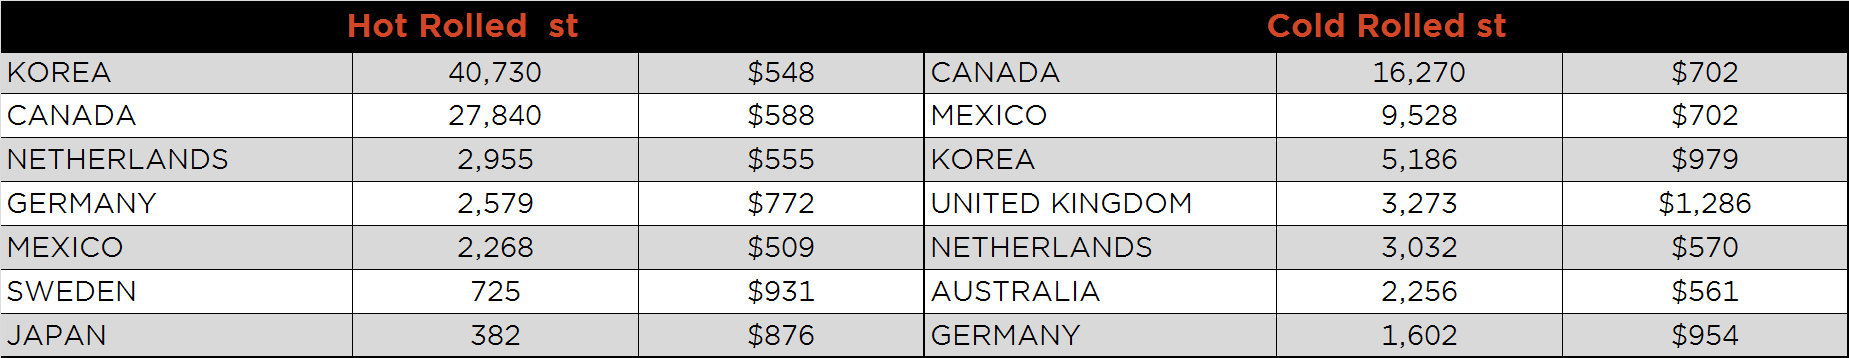
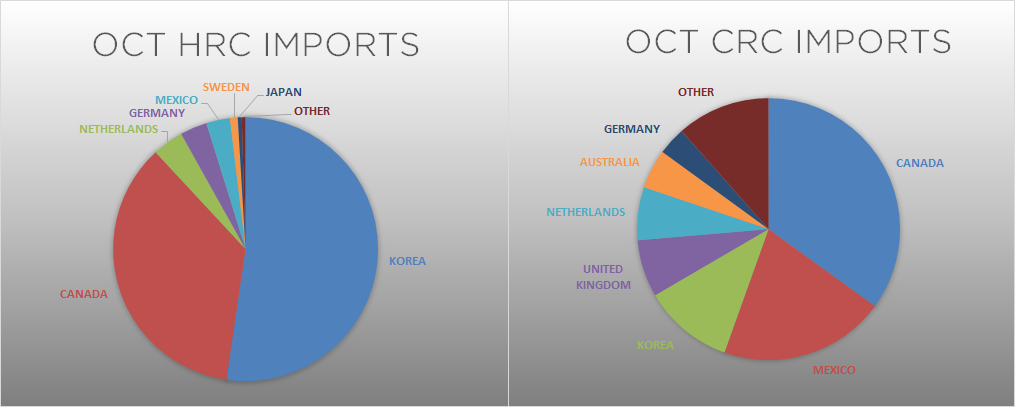
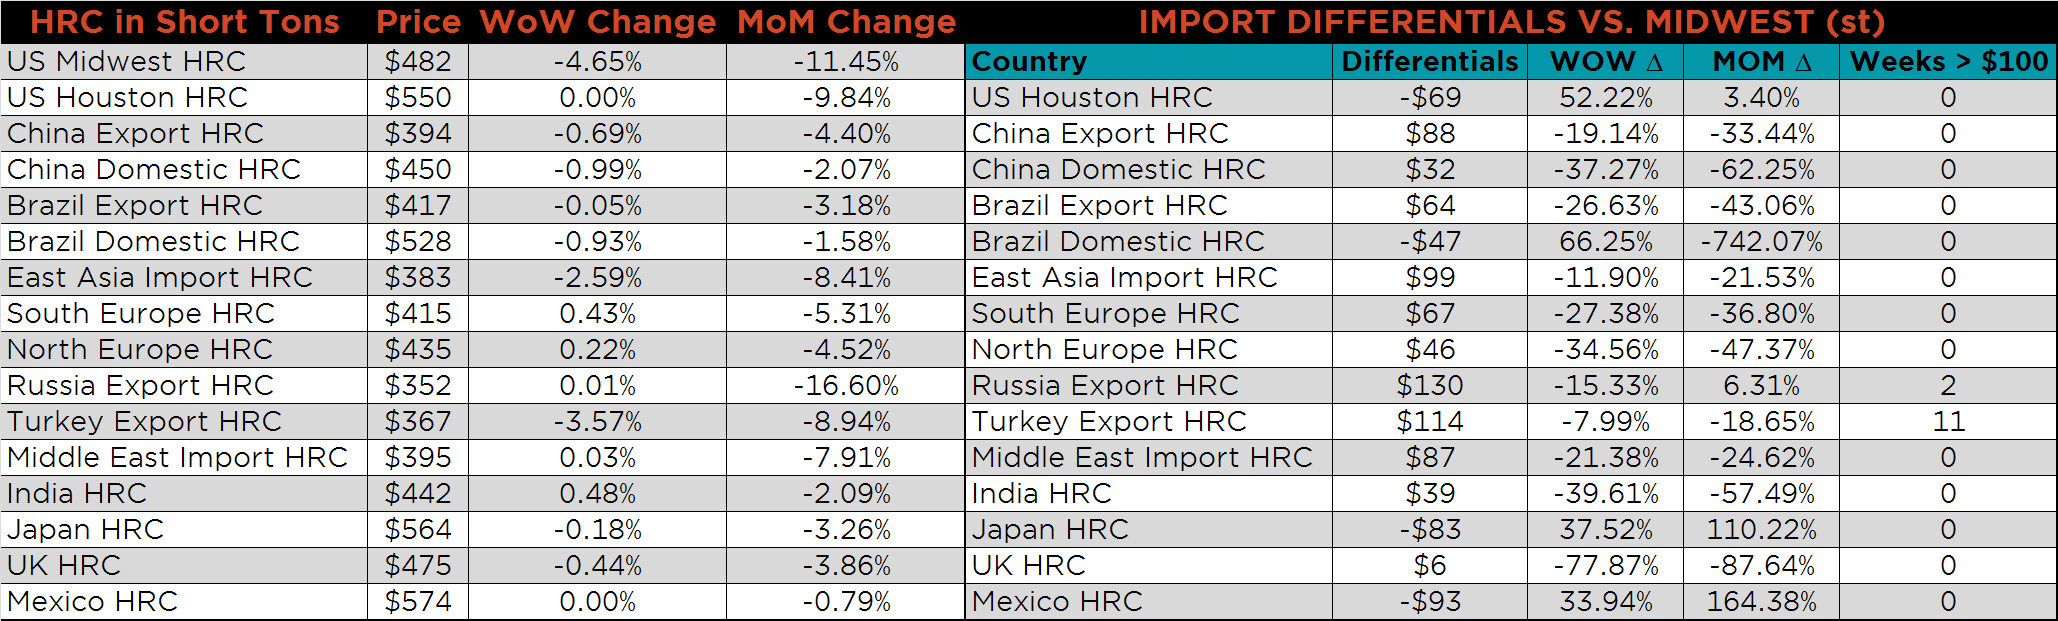
Below is the Midwest HRC price vs. each listed country’s export price using pricing from SBB Platts. We have adjusted each export price to include any tariff or transportation cost to get a comparable delivered price. Export prices remain relatively flat while the U.S. domestic price continued lower, driving the differentials lower.
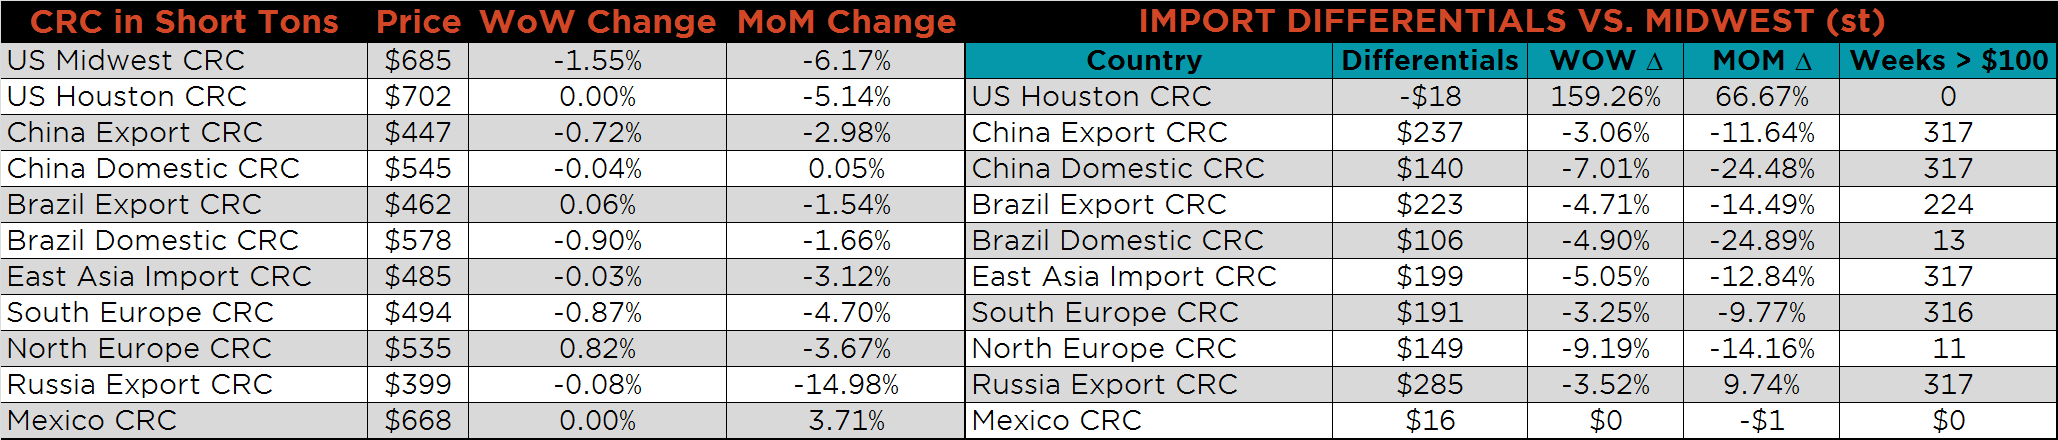
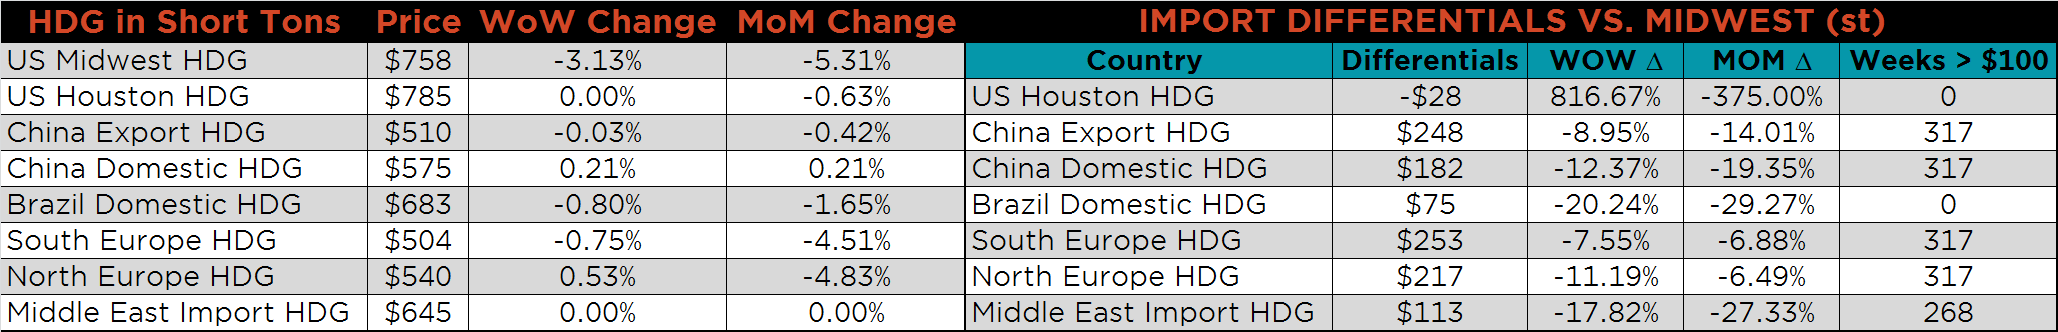
SBB Platt’s HRC, CRC and HDG pricing is below. The Midwest HRC, HDG and CRC prices were down 4.7%, 3.1% and 1.6%, respectively, while global steel export prices remained relatively flat.
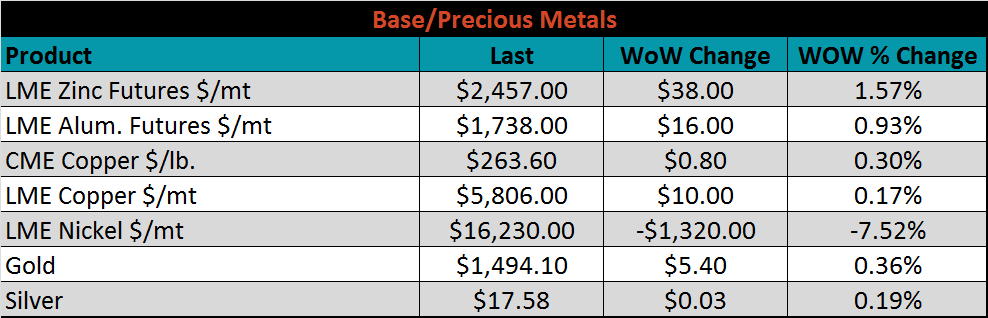
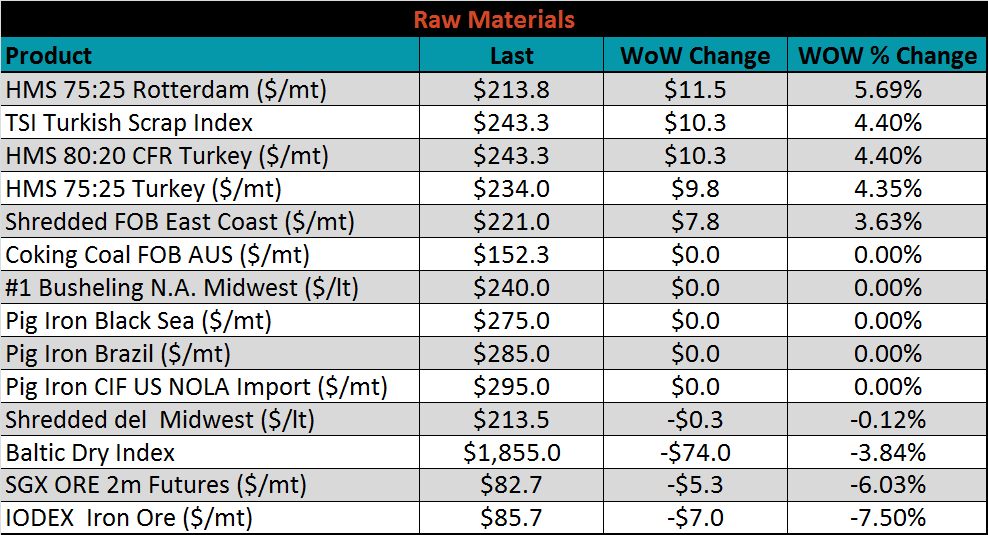
Raw material prices were mixed. Rotterdam 75:25 HMS was up 5.7%, while the IODEX Iron Ore was down 7.5%.
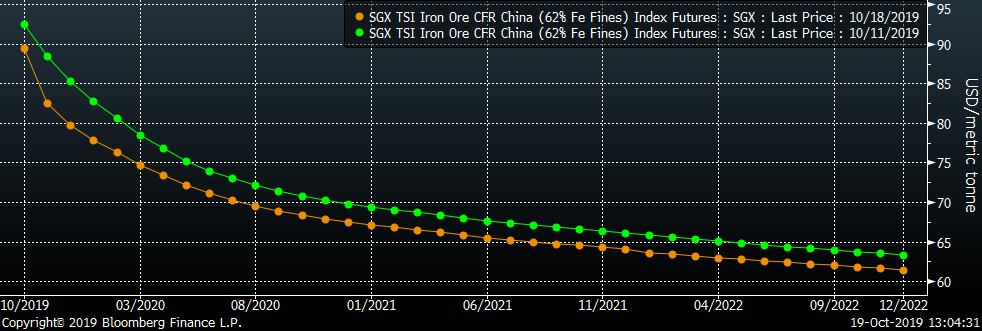
Below is the iron ore future curve with Friday’s settlments in orange, and the prior week’s settlements in green. The entire curve shifted lower across all expirations last week, but more so in the front expirations.
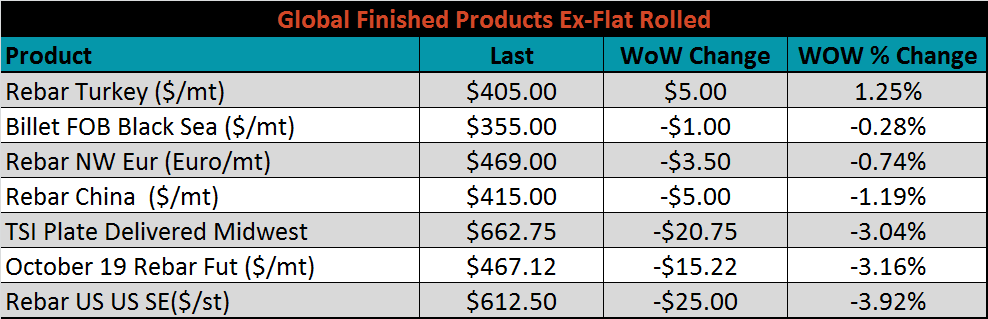
The ex-flat rolled prices are listed below.

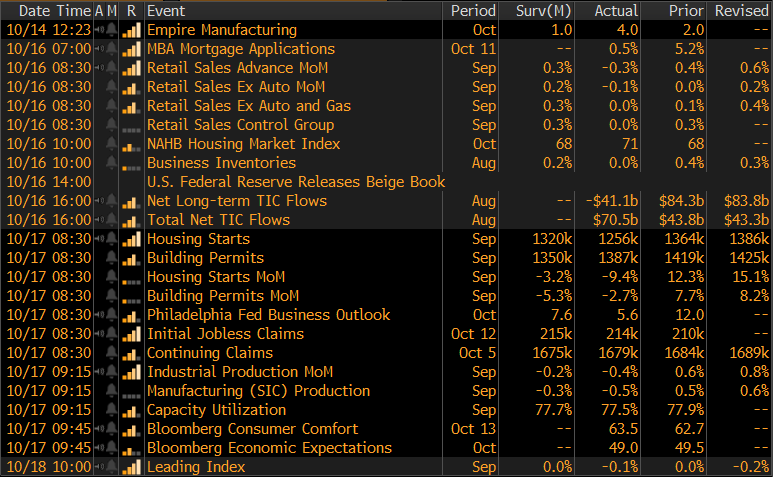
The remaining significant economic data is to the right. This week, two regional branches of the Federal Reserve released their monthly manufacturing indexes. The Empire (New York) Manufacturing index was up 2 points to 4, above the expectation of down 1, while the Philadelphia Fed Business Outlook was down by 6.4 points from September to 5.6, and below expectations of 7.6. This continues the trend of mixed readings across the manufacturing industry.
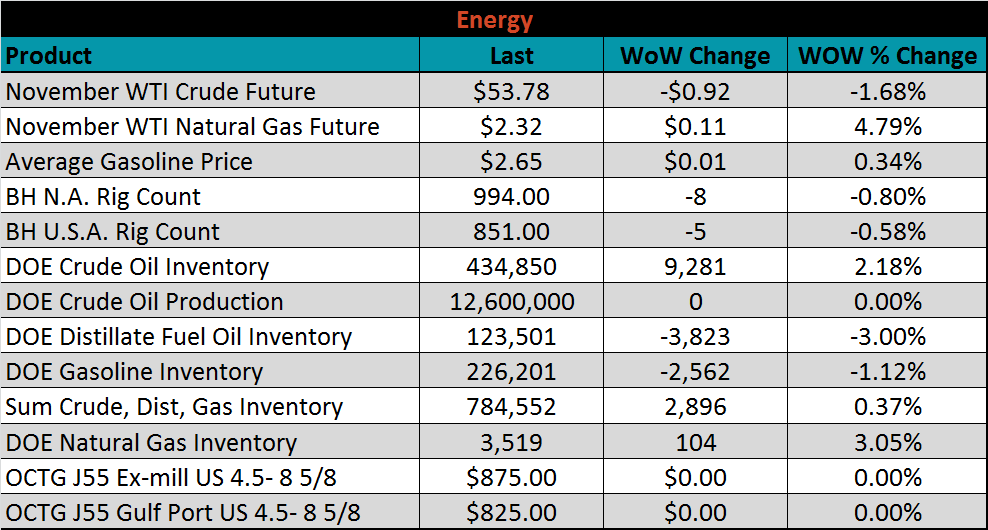
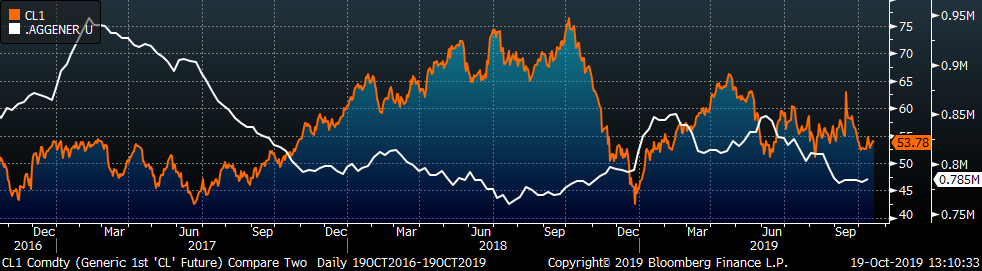
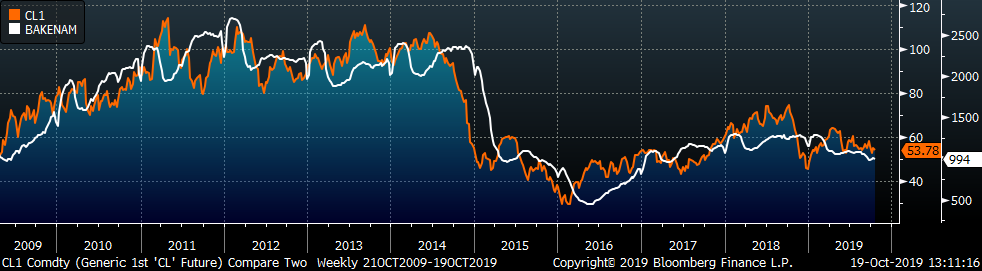
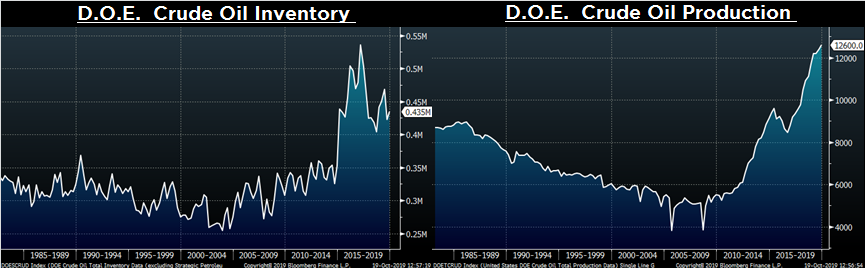
Last week, the November WTI crude oil future lost $0.92 or 1.7% to $53.78/bbl. The aggregate inventory level was up 0.4%, while crude oil production remains at 12.6m bbl/day. The Baker Hughes North American rig count lost eight rigs, while the U.S. count lost five.
The list below details some upside and downside risks relevant to the steel industry. The orange ones are occurring or look to be highly likely. The upside risks look to be in control.
Upside Risks:
Downside Risks: