Content
-
Weekly Highlights
- Market Commentary
- ISM PMI
- Global PMI
- Construction Spending
- Auto Sales
- Risks


Spot prices resumed their rally last week on the back of another round of mill price increases, pushing above $600/st for the first time since spring of 2019. While the move up in prices has been swift, the physical spot market remains quiet with few transactions. Panic within the buying community has subsided slightly as buyers are finally accepting the fact that higher prices are the new normal. However, the market continues to get tighter as lead times push out and service center inventories are consumed. This supports the recent price increase and signals that even higher prices are ahead. The forward curve popped last week, especially in the front of the curve, where the expectation is for prices to reach at least $625/st in October and November. While further increases are priced into the market, we realize that this is a mean reverting product, and the higher prices go, the greater the downside risk become. Many have pointed to a stalling economic recovery with additional fiscal stimulus delayed, slowing job growth and the uncertainty around a vaccine, the election, and Covid-19 as temperatures cool. This report will highlight several of the economic data points released last week, analyzing them within the backdrop of the steel market and changing preferences due to the pandemic.
A major risk for the economy as it recovers from the shutdowns earlier this year is the high unemployment levels that will be a drag on future consumer spending and economic growth. Moreover, monthly increases in job gains have slowed as fiscal benefits lapse. However, not all industries have the same influence on the steel market. The below chart compares job openings in all sectors of the economy (white) with manufacturing job openings from yesterday’s August JOLTS release.
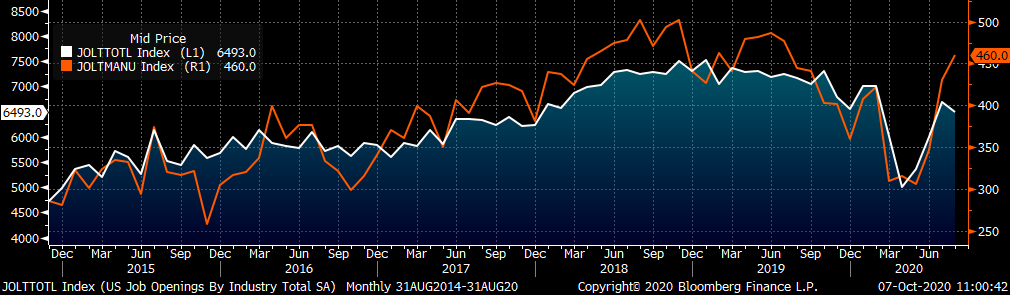
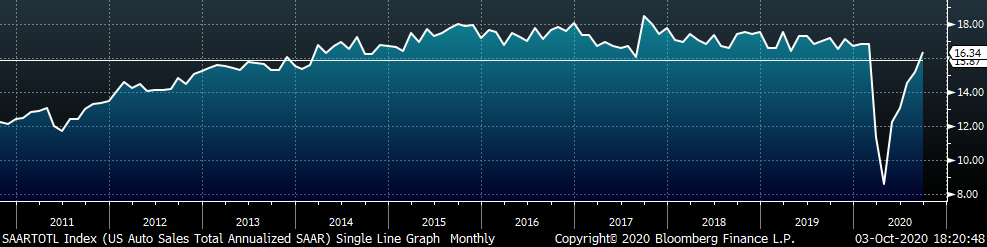
While the economy as a whole has slowed in terms of adding jobs, manufacturing companies are showing confidence in their outlook and future demand expectations by increasing their labor force. A similar divergence can be seen in the September auto sales data (below), where the seasonally adjusted annualized rate of automobile sales rose above the 10 average. This occurred in September despite a slowing rate of job growth, which tends to be a main driver of auto sales. A possible reason is the growing number of people moving out of cities and needing to buy a car to support their new lifestyle. The recent trend in construction spending data (below) supports this explanation, as residential spending is growing while non-residential spending growth has stalled.
A population shift, caused by the coronavirus pandemic, from congested cities to suburbs and rural areas will have ramifications for the economy. The majority of the economy exists within the services sector, which is more prevalent in urban areas with large populations, restaurants, and retail. However, when considering these changes from a perspective in the steel market, they appear to be beneficial for steel demand. Home buying, home improvement, warehouse and storage construction, delivery trucks and auto sales all entail higher demand for steel in the future, supporting a higher price level.
The chart below shows the relationship between the Platts Midwest HRC index and the ISM Manufacturing PMI over the past 10 years.
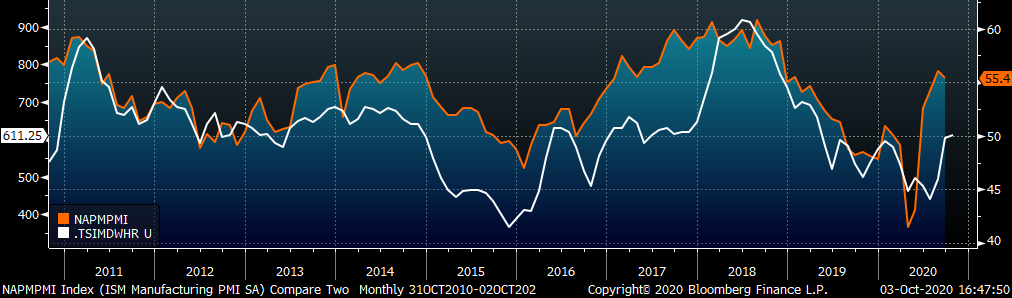
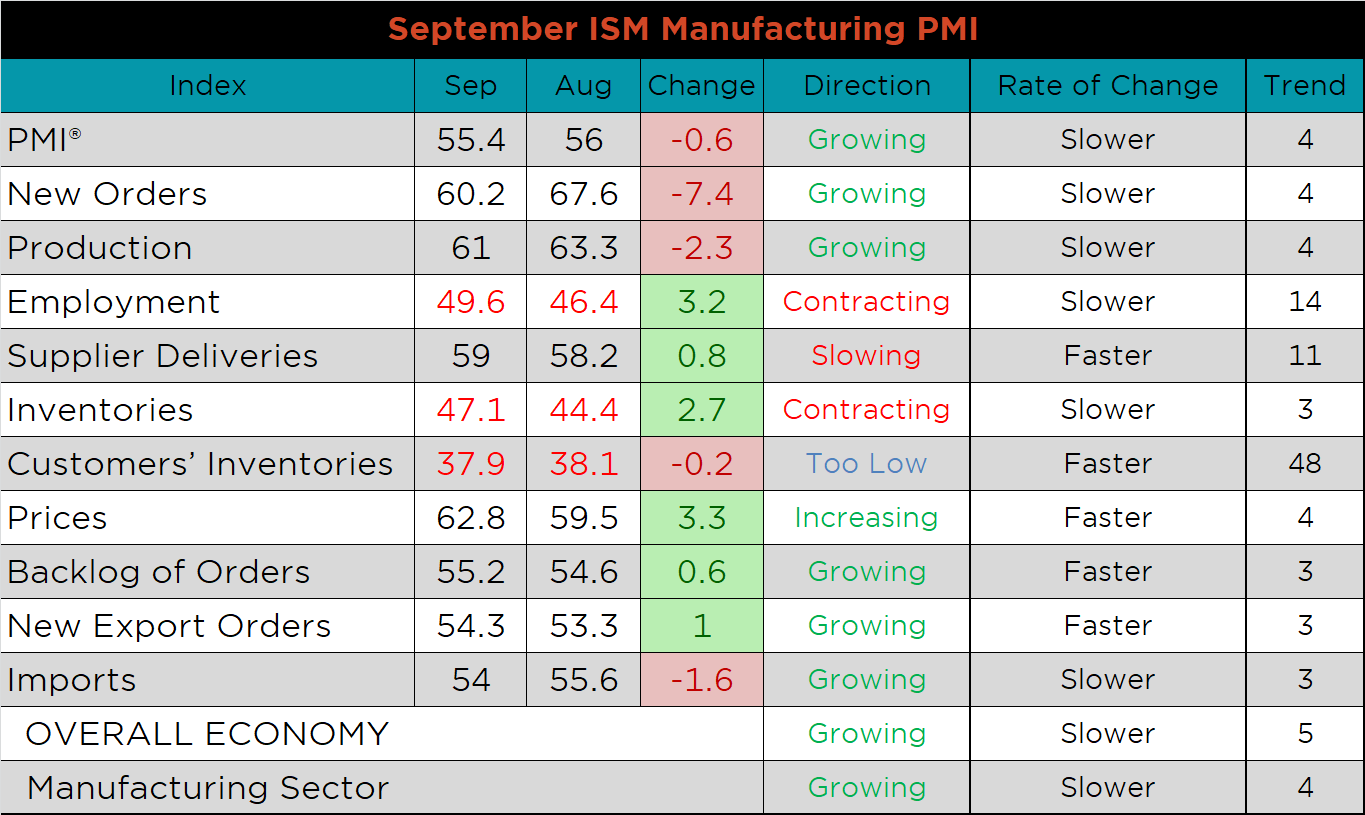
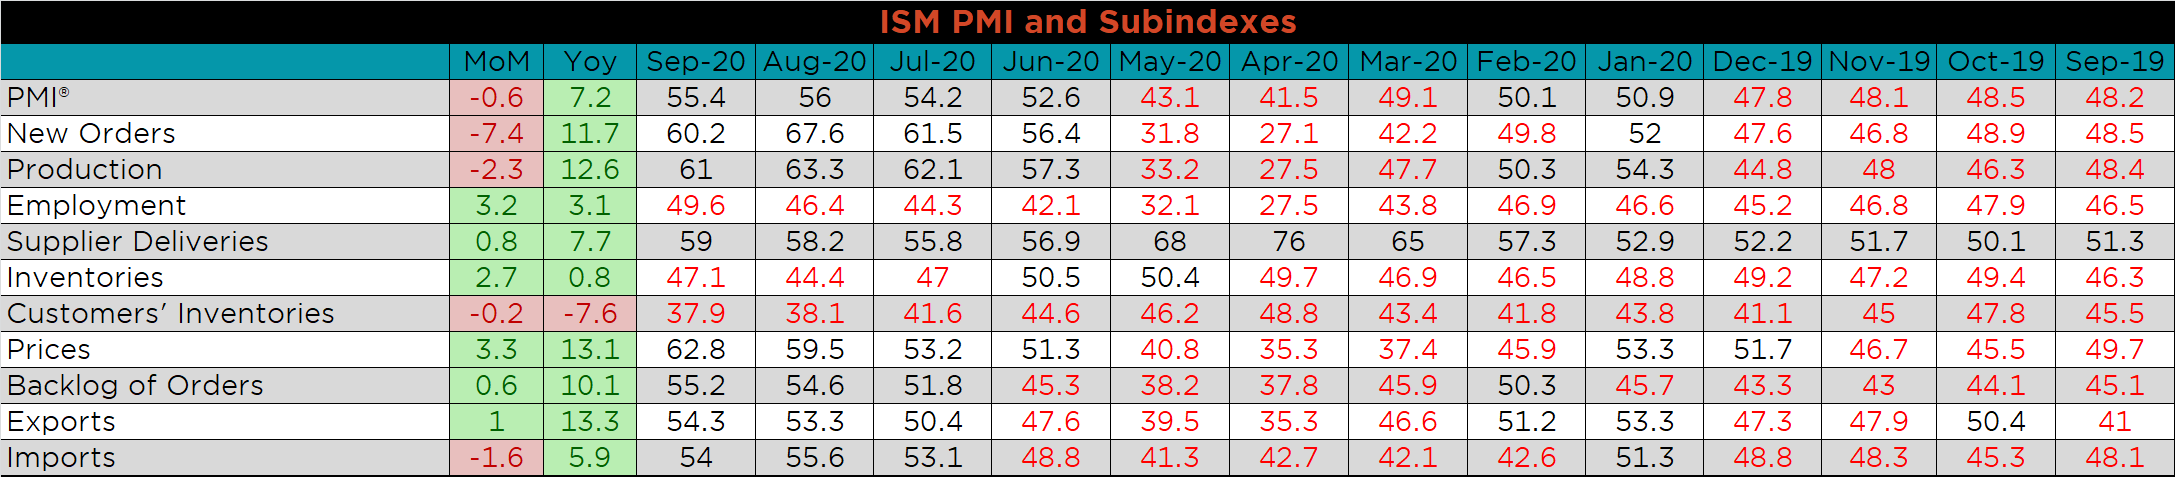
The September ISM Manufacturing PMI and subindexes are below. The topline PMI number slipped 0.6 points to 55.4.
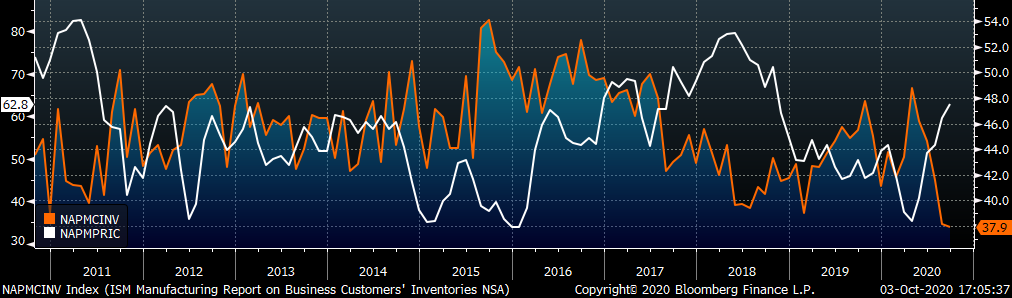
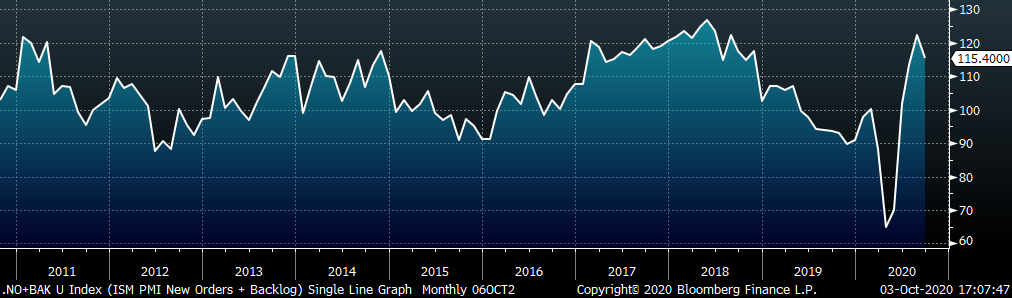
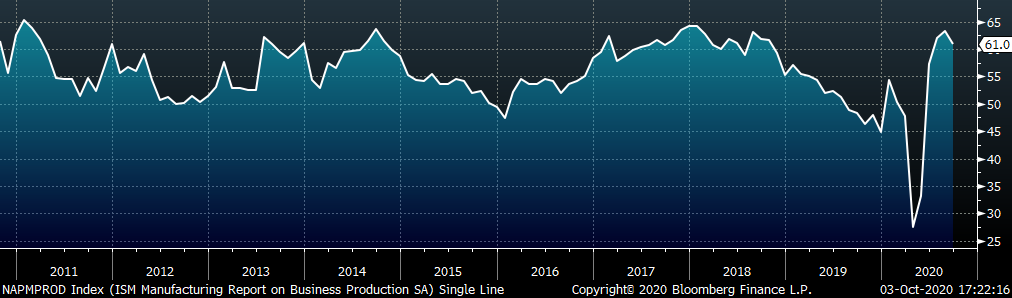
The chart below compares the ISM prices subindex with the ISM customer inventories subindex. The customer’s inventory subindex printed even lower than last month, while prices continue to climb. The second chart shows the new orders plus backlog subindex. Both subindexes remain elevated, but the new orders subindex retreated from its high level last month. The final chart shows the production subindex also pulling back from August’s reading, while remaining elevated for the fourth month in a row.
PMI subindexes were mixed MoM, with the prices and employment subindexes increasing the most, while new orders and production subindexes fell. Inventories, customer inventories and employment all remain in contraction.
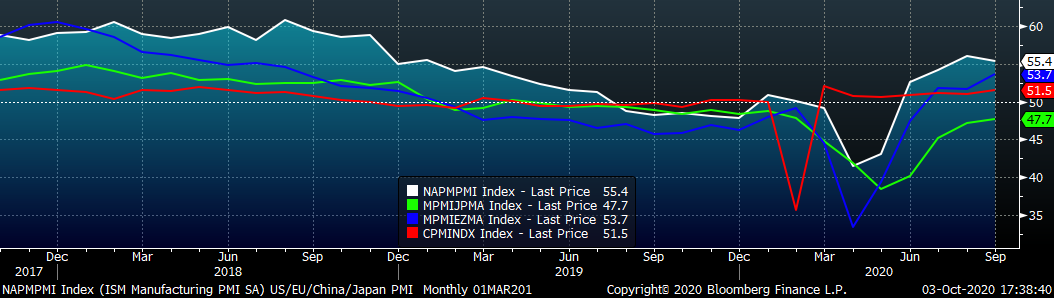
September global PMI printings were strong, with 19 of the 25 watched countries’ PMIs in expansion. PMIs in Germany, the Eurozone, Japan and China (Official) increased, while the US and China (Caixan) PMIs were slightly lower. Japan remains the largest economy still in contraction, printing at 47.7.
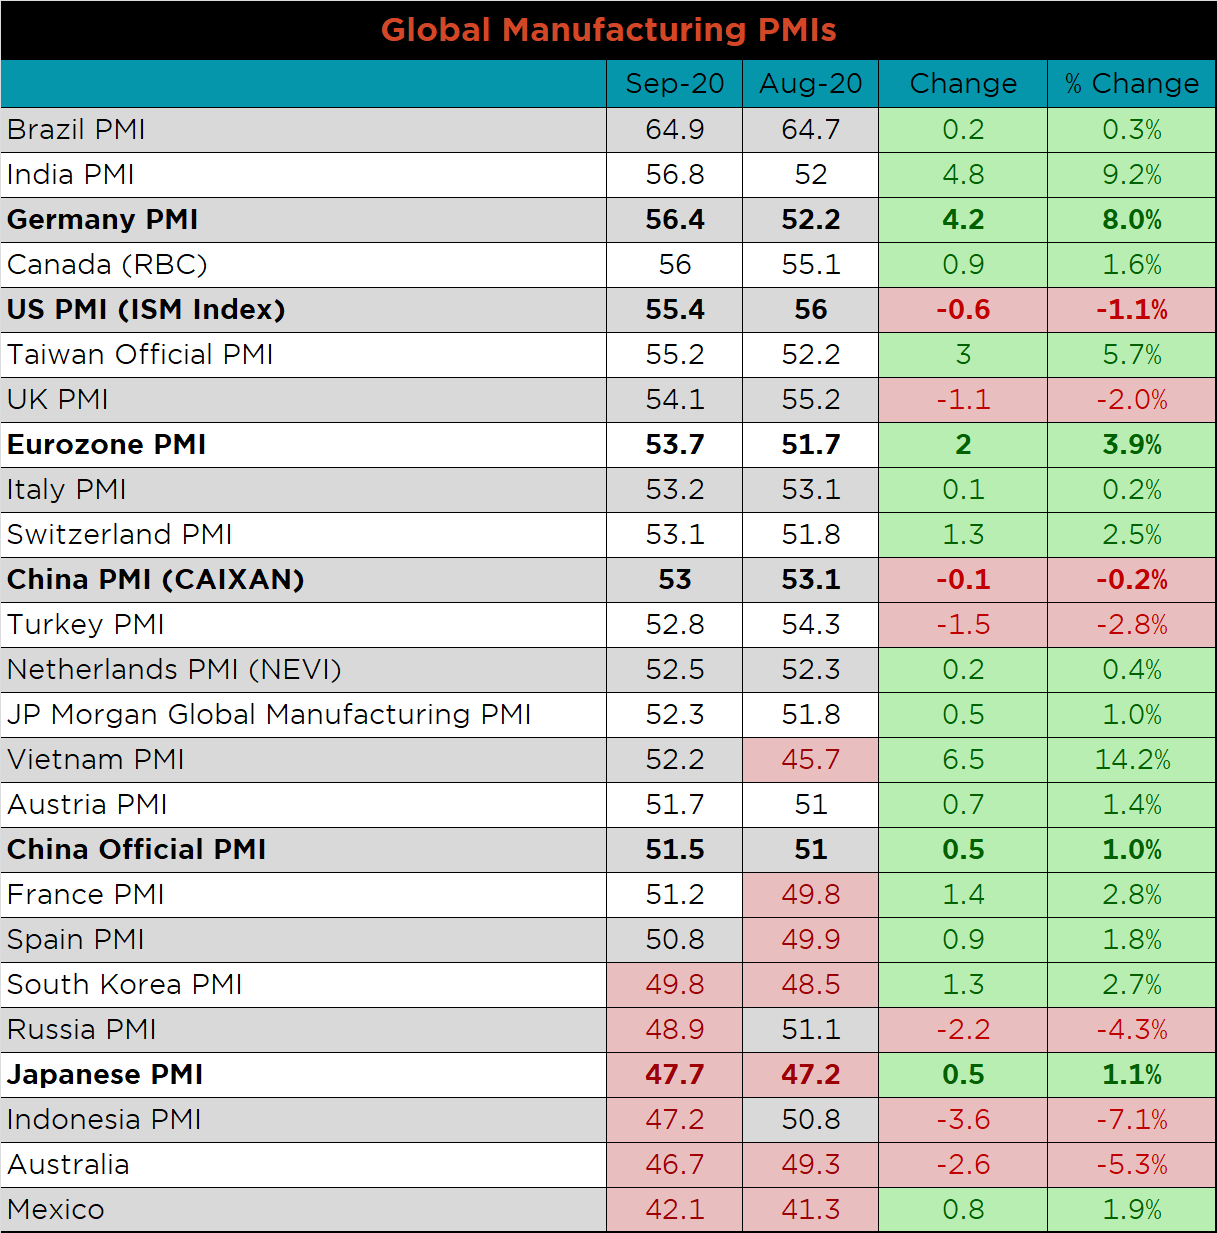
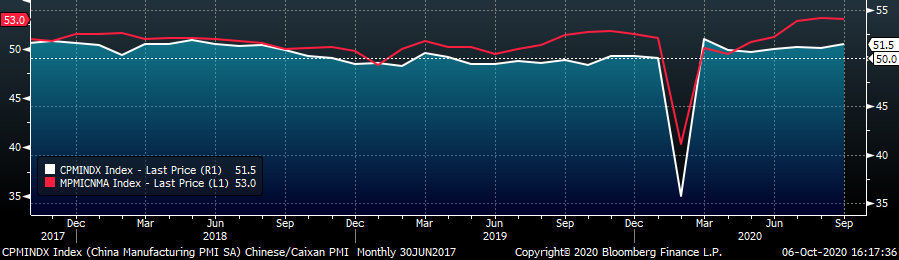
China’s official manufacturing PMI printed higher, while the Caixan PMI dropped slightly. Both remain in expansion.
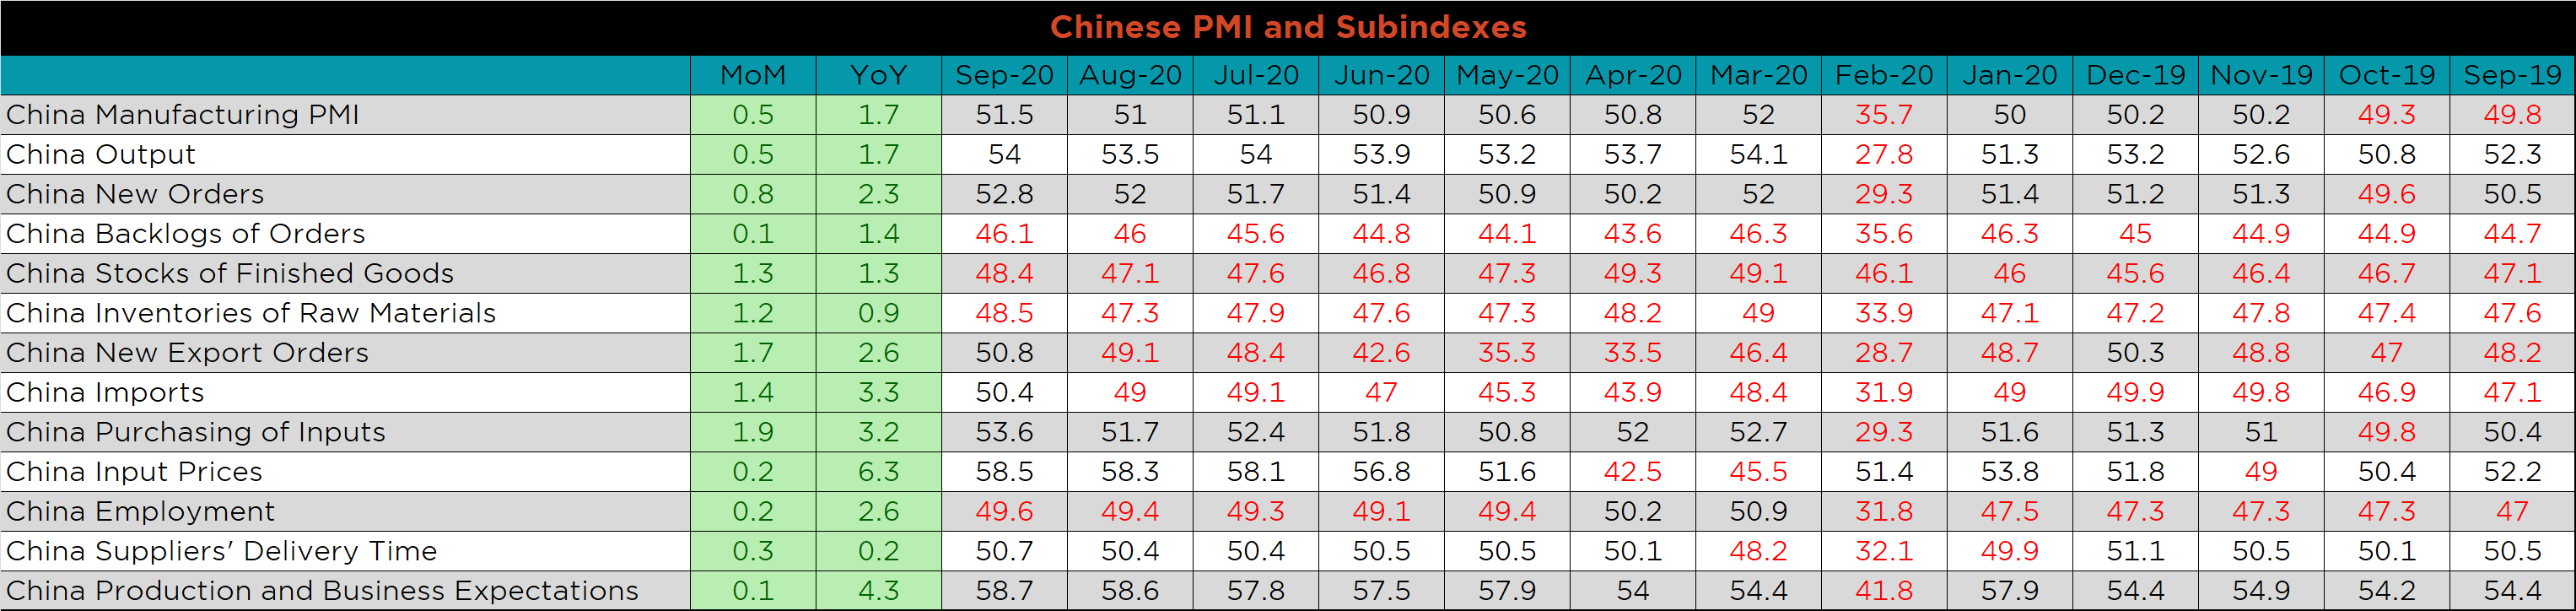
The table below breaks down China’s official manufacturing PMI subindexes. All subindexs increased in September, but employment, stocks of finished goods and inventories of raw materials remain in contraction.
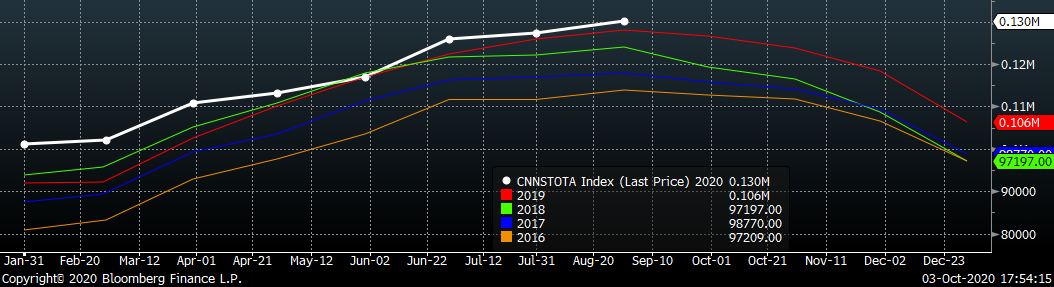
August seasonally adjusted U.S. construction spending was up 1.5% compared to July, and 2.5% higher than a year ago.
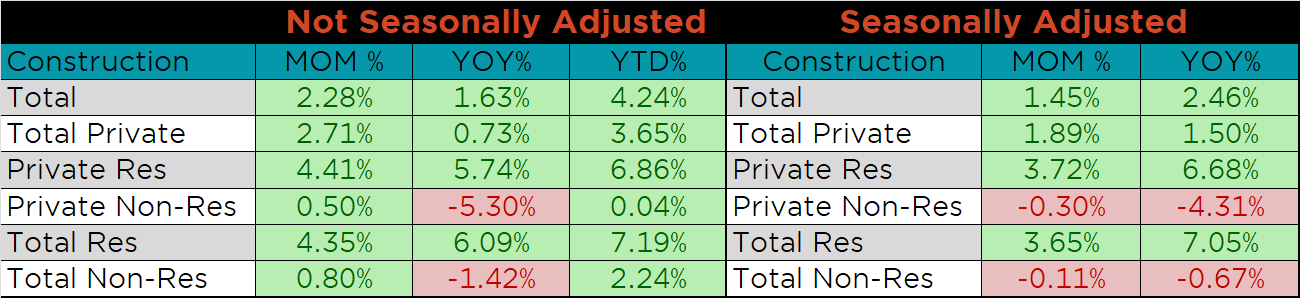
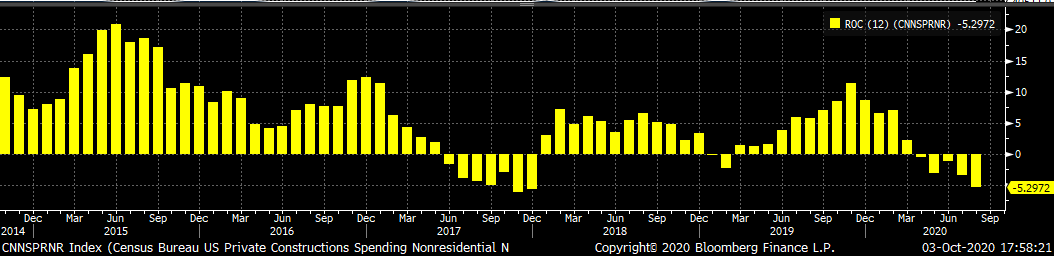
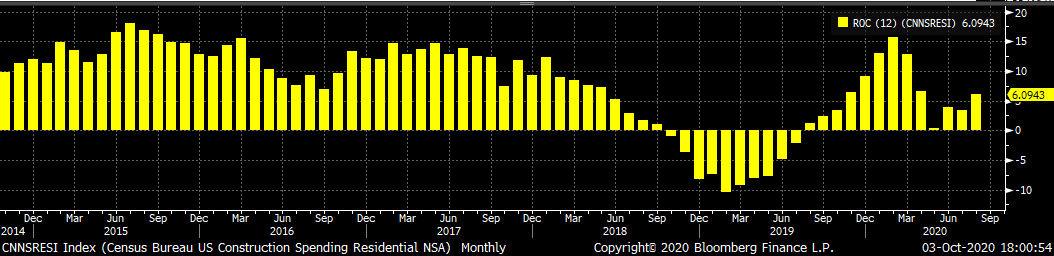
The white line in the chart below represents construction spending in 2020 and compares it to the spending of the previous 4 years. Spending levels in August rose compared to July and increased above last year’s levels. The last two charts show the YoY changes in construction spending. Private non-residential spending decreased further in August, the fifth month in a row, while residential spending continues to show strength.
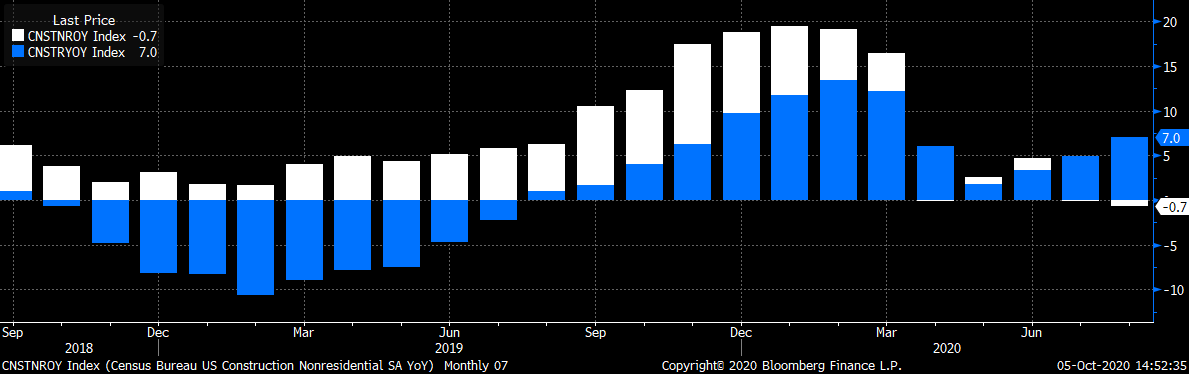
YoY growth in seasonally adjusted residential construction spending (blue) is a promising sign, as non-residential spending (white) has been relatively flat since April. While residential construction is less steel intensive, strength in this category signals a change in preferences due to the pandemic. This shift also implies downstream benefits in automotive and appliance industries.
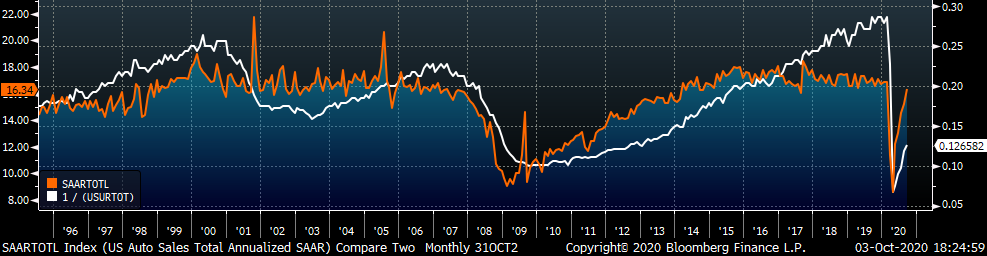
September U.S. light vehicle sales increased further to a 16.3m seasonally adjusted annualized rate (S.A.A.R). The second chart shows the relationship between the unemployment rate and auto sales. The unemployment rate is inverted to show that declining unemployment typically leads to increasing auto sales. Both continued to improve in September, with auto sales rebounding at a faster pace than employment.
Below are the most pertinent upside and downside price risks:
Upside Risks:
Downside Risks:
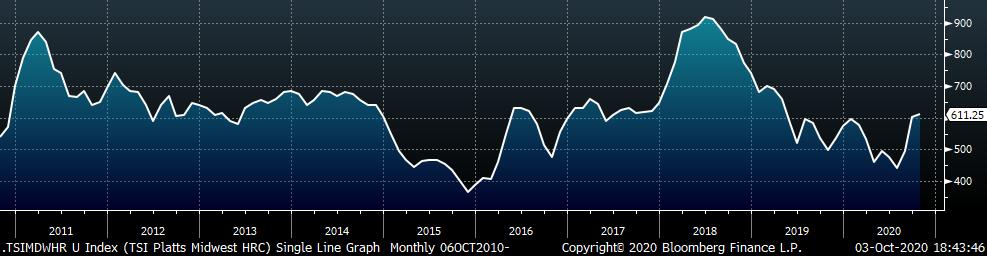
The Platts TSI Daily Midwest HRC Index rose $12 to $611.25.
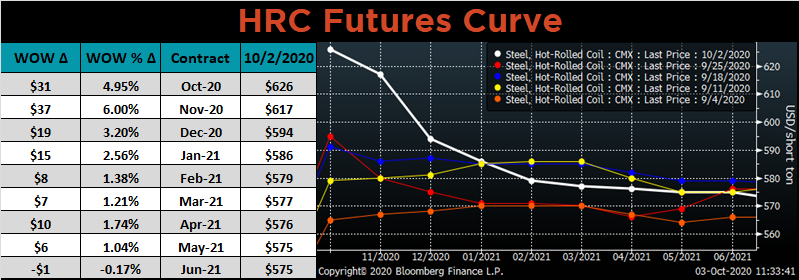
The CME Midwest HRC futures curve is below with last Friday’s settlements in white. The front of the curve rose significantly last week, up over $30.
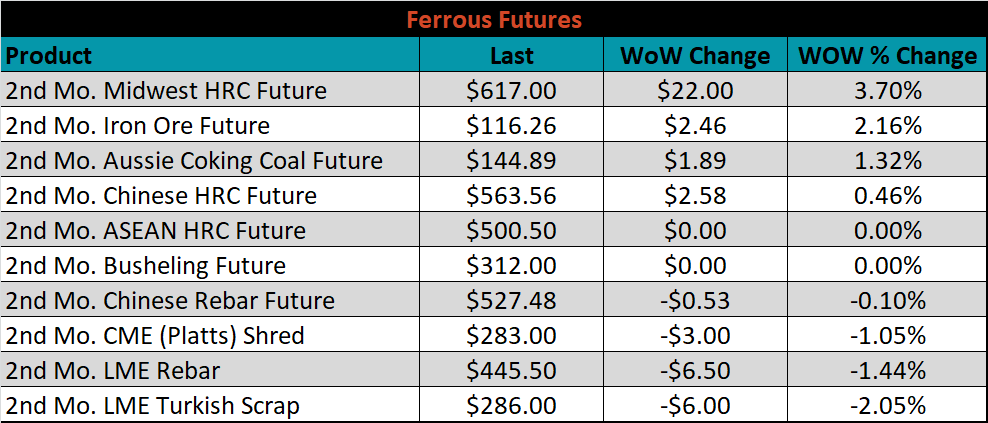
November ferrous futures were mixed. Midwest HRC gained 3.7%, while Turkish scrap fell 2.0%.
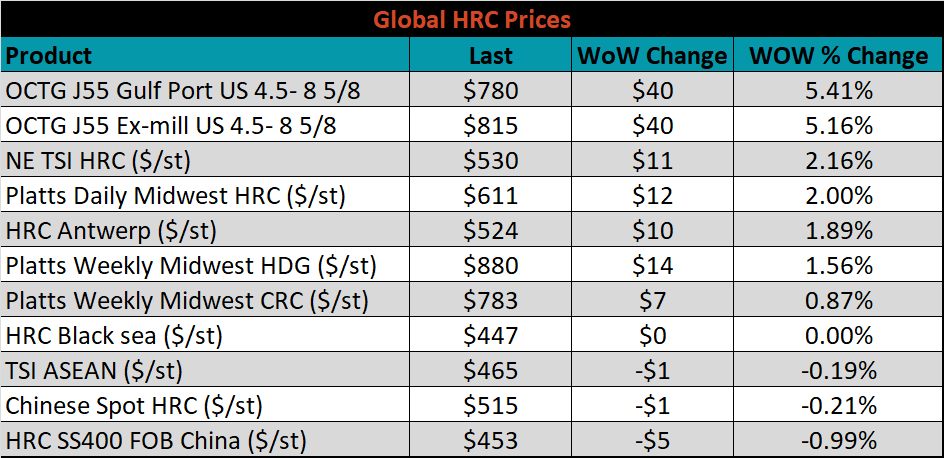
The global flat rolled indexes were mostly higher. Oil Country Tubular Goods were up over 5%, while China export prices slipped 1.0%.
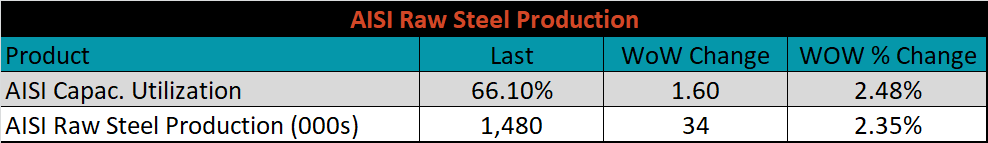
The AISI Capacity Utilization rate increased 1.6% to 66.1%.
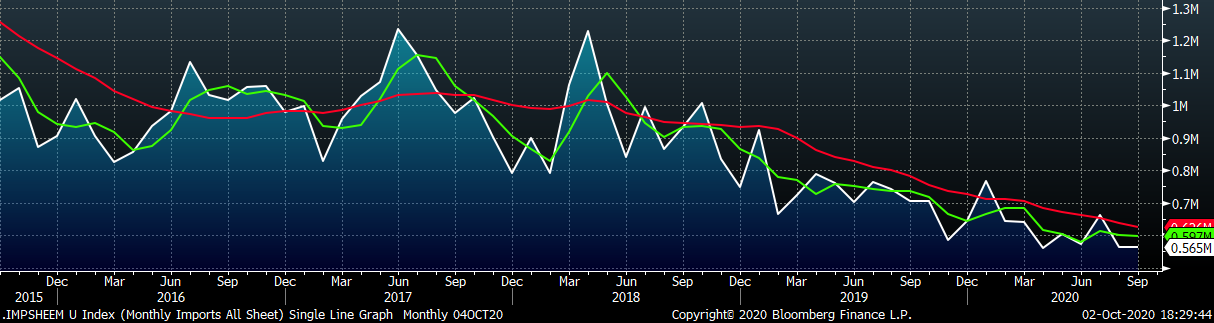
September flat rolled import license data is forecasting no change MoM at 565k.
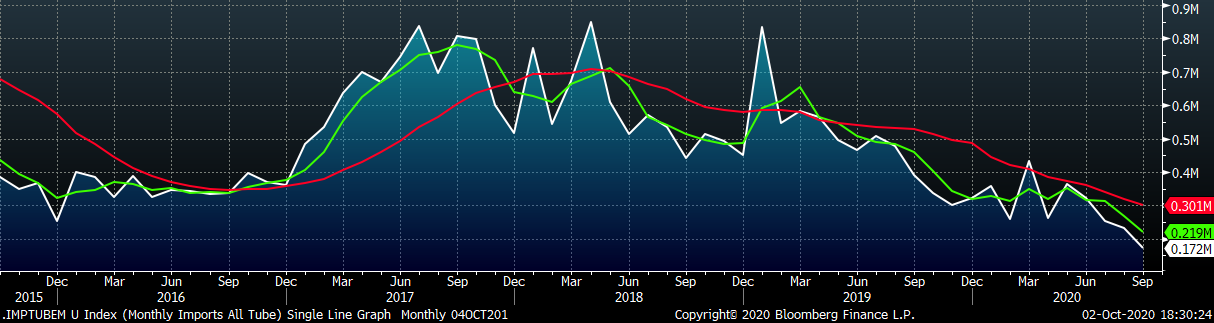
Tube imports license data is forecasting a decrease of 61k to 172k in September.
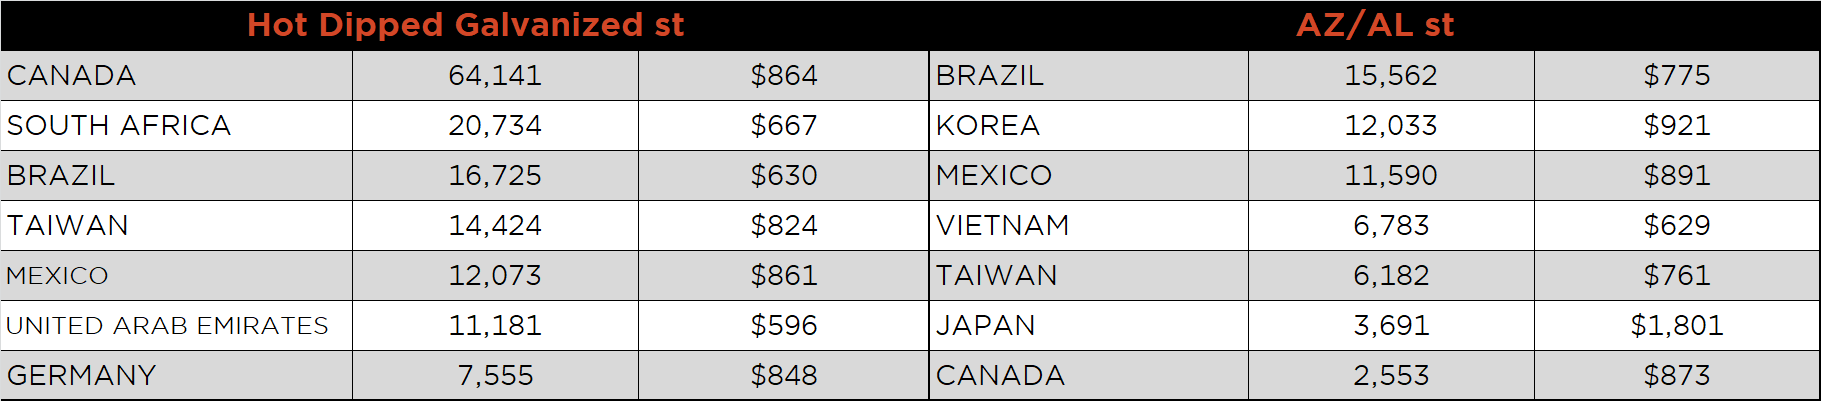
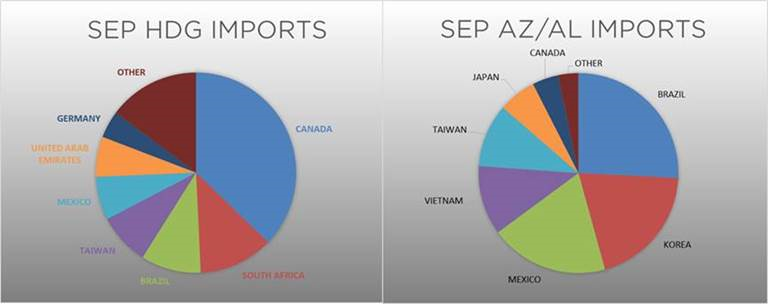
September AZ/AL import license data is forecasting a 6k increase to 64k.
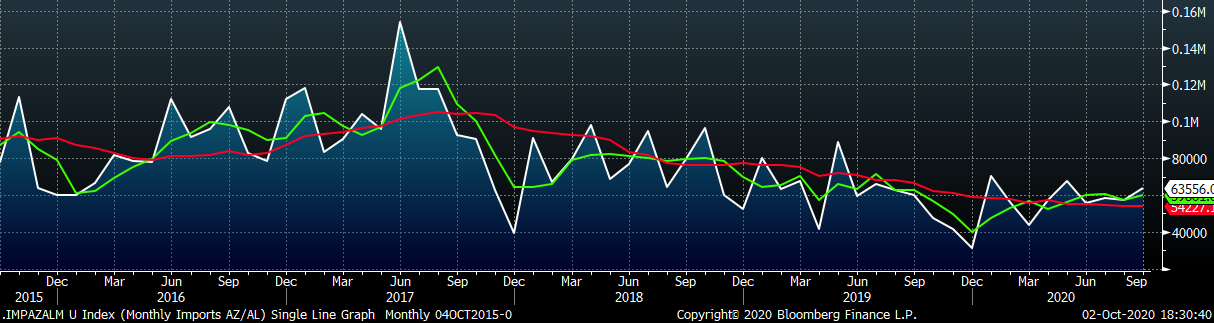
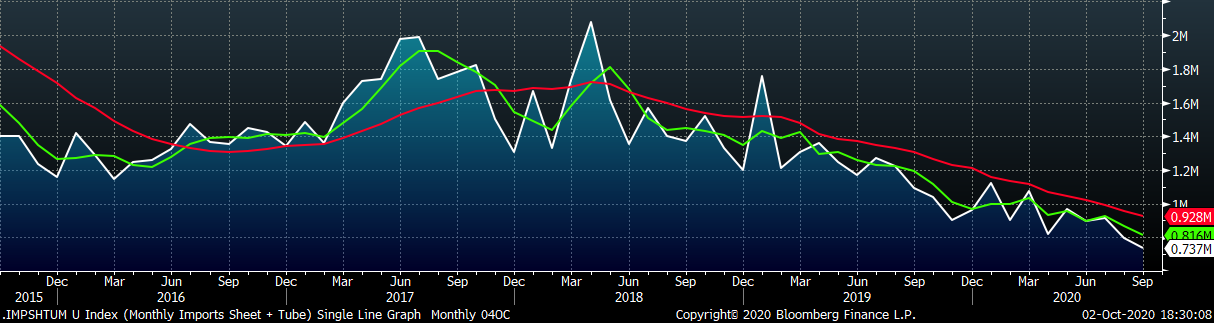
Below is September import license data through September 29, 2020.
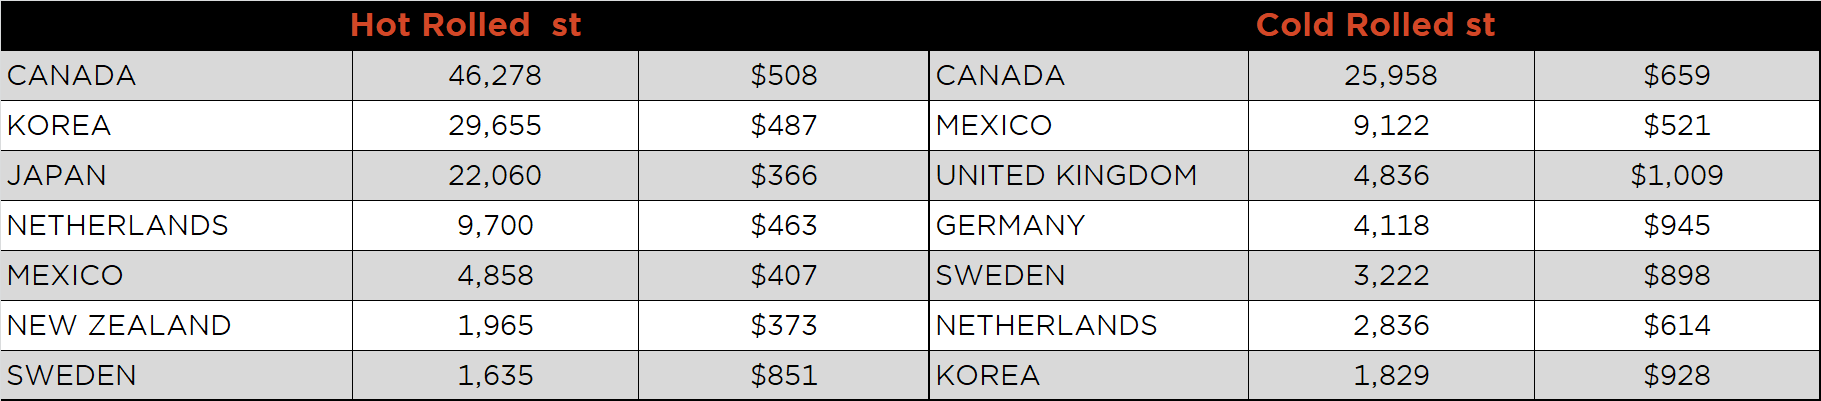
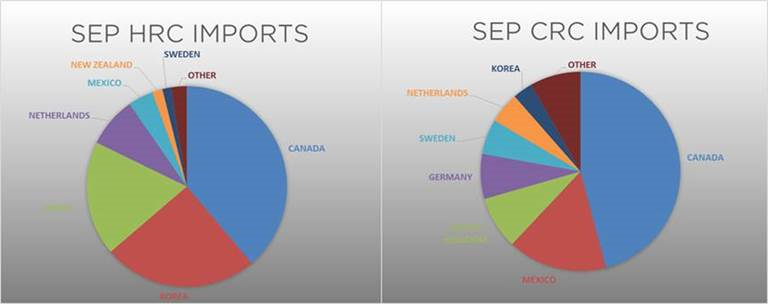
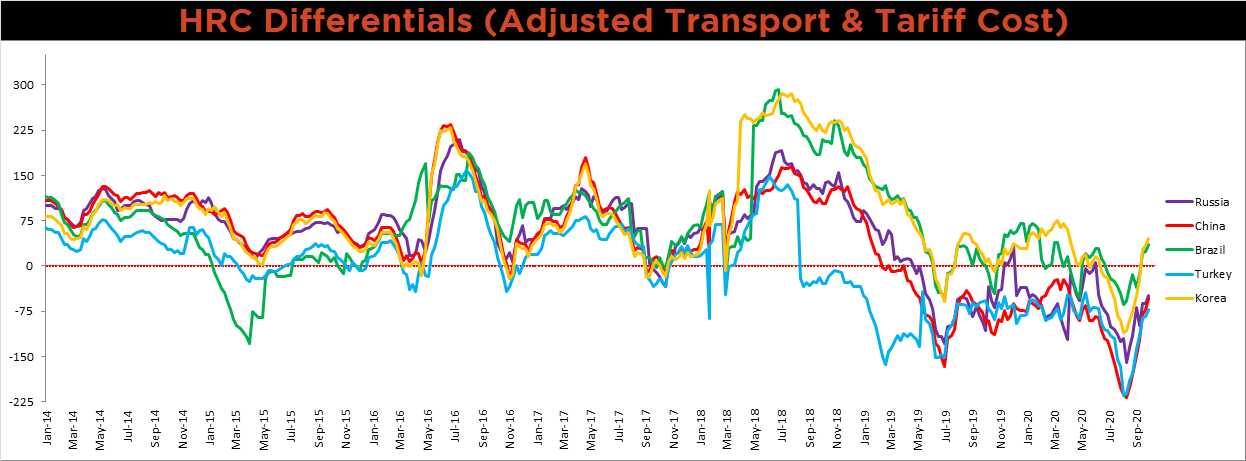
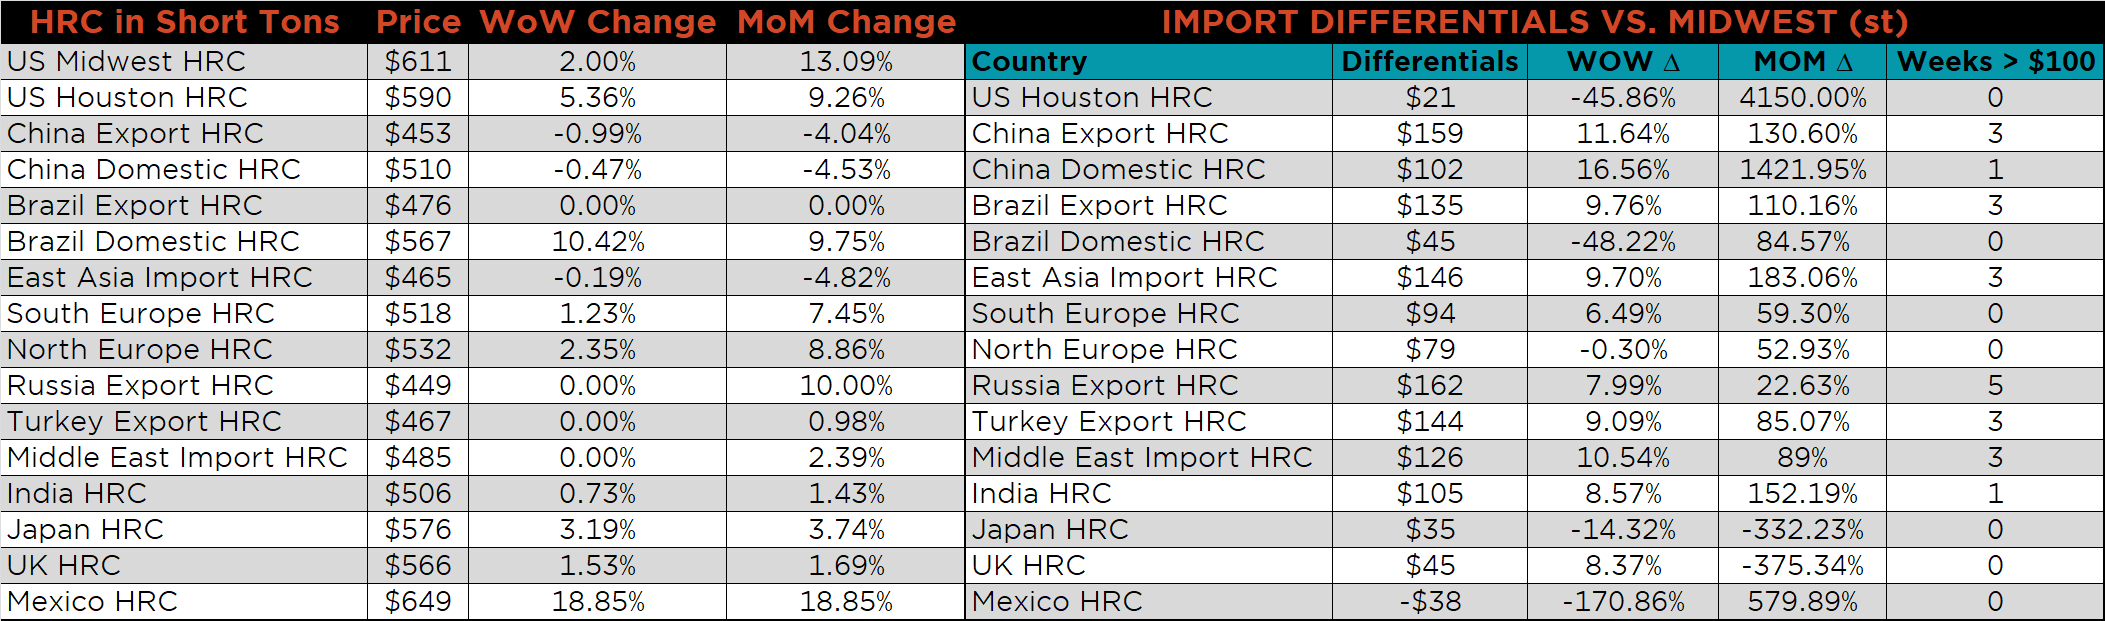
Below is the Midwest HRC price vs. each listed country’s export price using pricing from SBB Platts. We have adjusted each export price to include any tariff or transportation cost to get a comparable delivered price. The differentials for all watched countries increased again last week, as the U.S. price rose and global prices were unchanged or slightly lower.
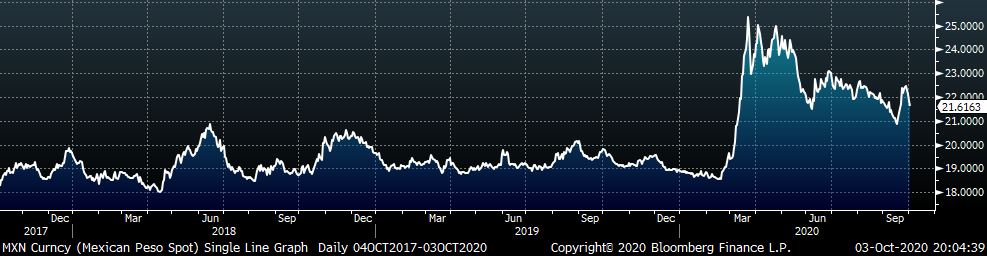
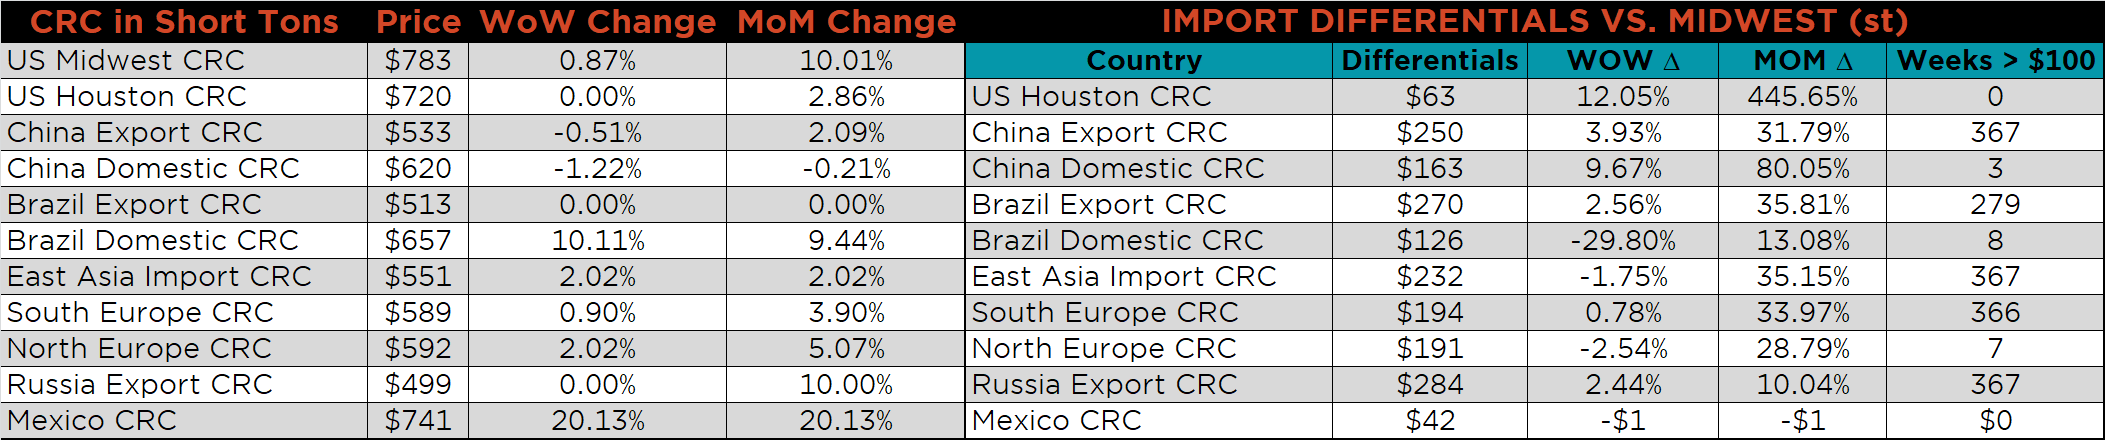
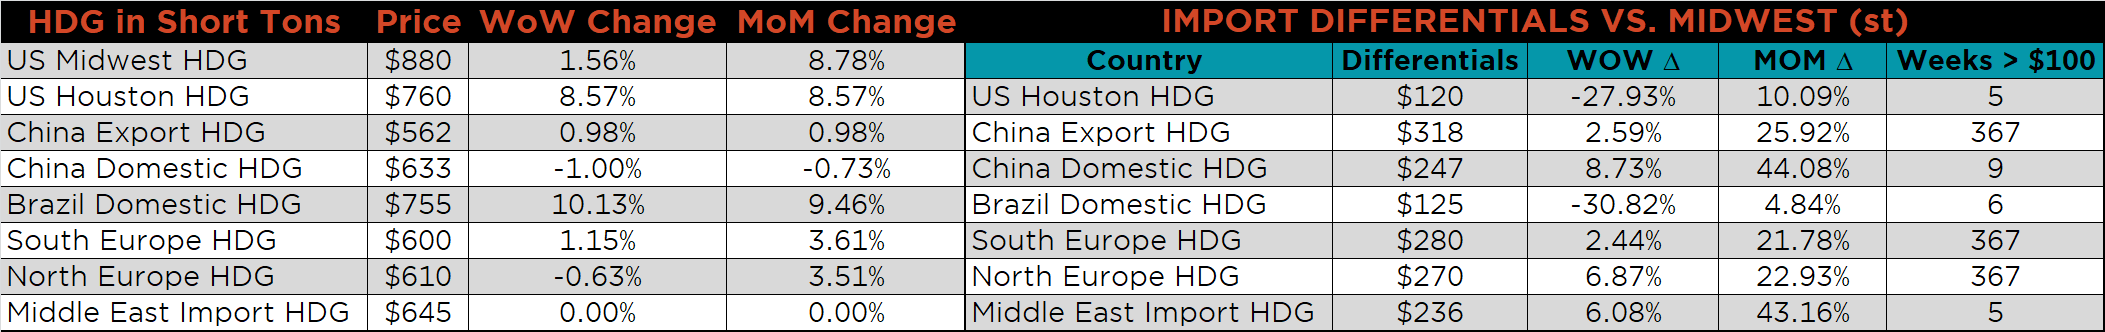
SBB Platt’s HRC, CRC and HDG pricing is below. The Midwest HRC, HDG and CRC prices were up, 2.0%, 1.6% and 0.9%, respectively. Globally, Mexico CRC and HRC prices were up 20.1% and 18.9% respectively.
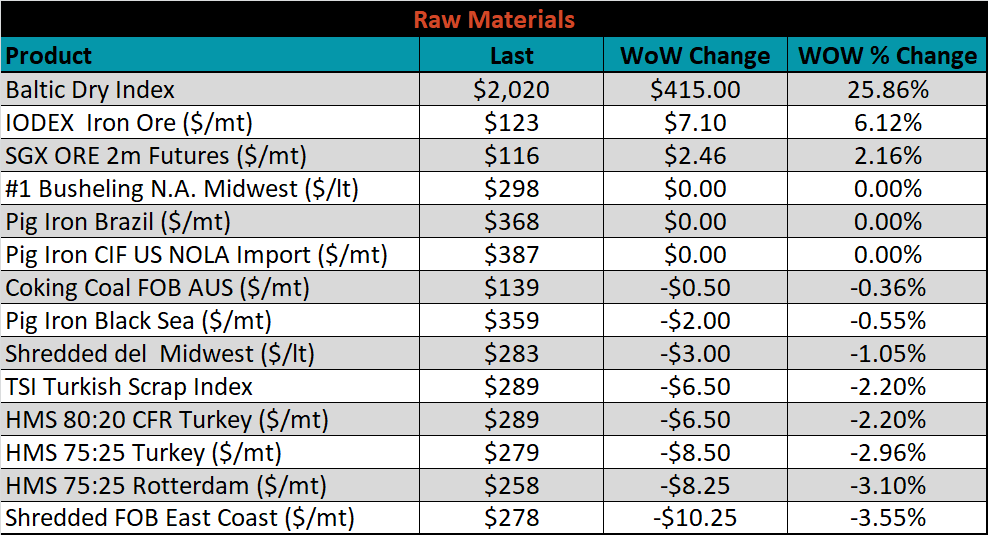
Raw material prices were mostly lower. Iron ore was up 6.1%, while East Coast shredded scrap was down 3.6%.
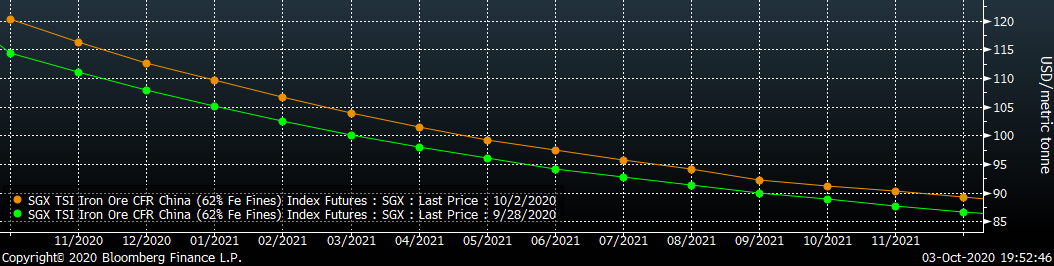
Below is the iron ore future curve with Friday’s settlements in orange, and the prior week’s settlements in green. Last week, the curve increased, most significantly in the front.
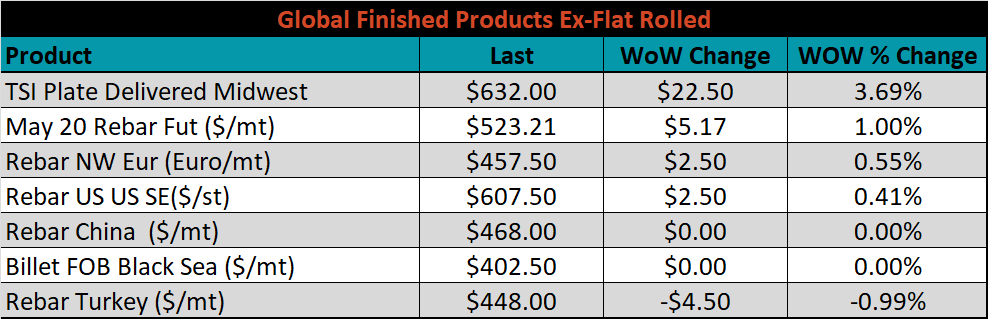
The ex-flat rolled prices are listed below.

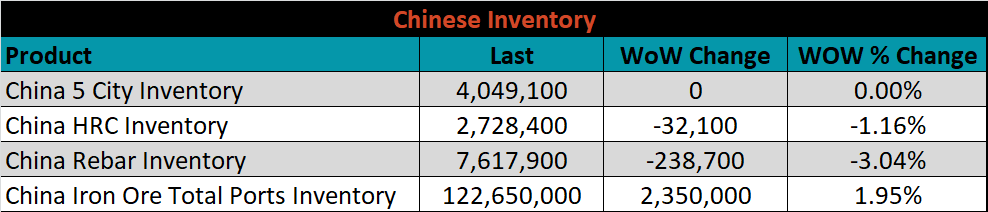
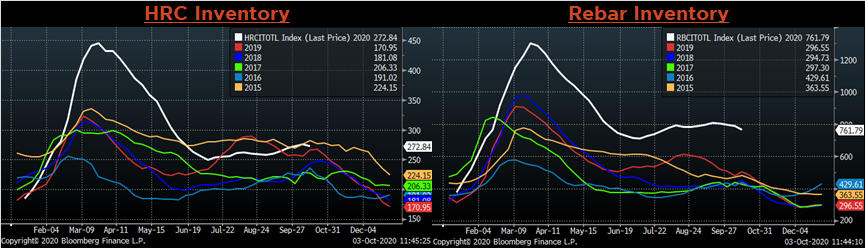
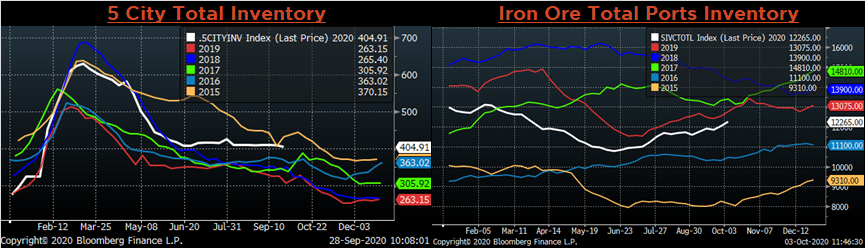
Below are inventory levels for Chinese finished steel products and iron ore. Last week, the HRC and rebar inventory levels were lower, iron ore inventory levels increased again. Last week, China entered its weeklong Golden Week holiday, leaving multiple markets closed and/or illiquid.
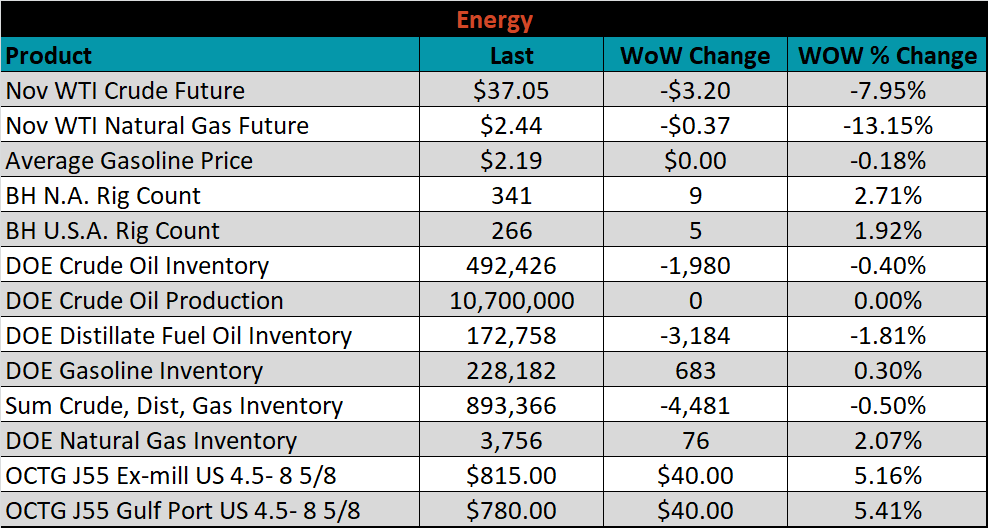
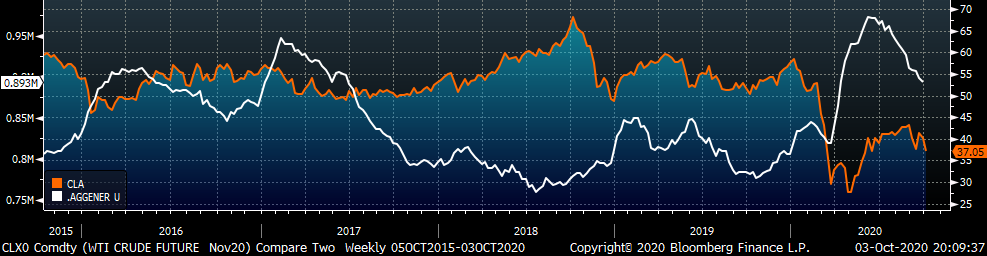
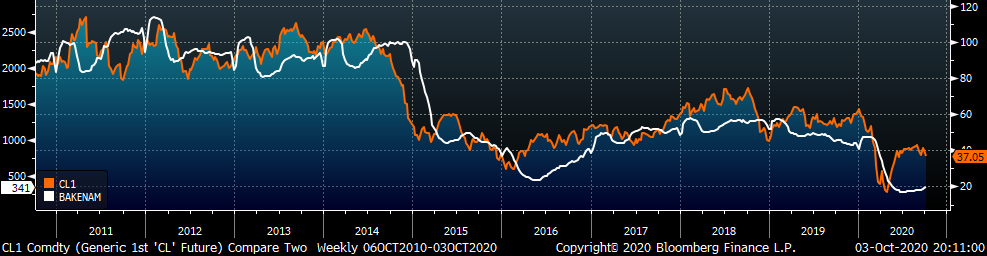
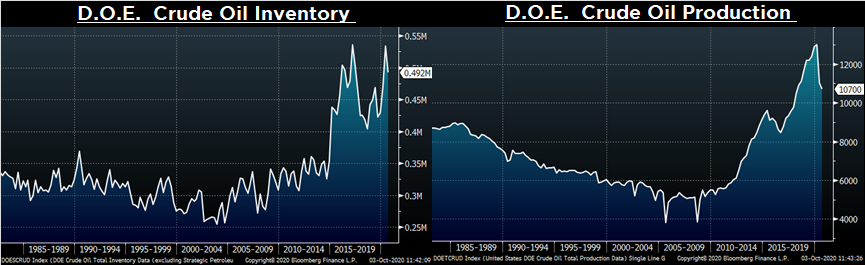
Last week, the November WTI crude oil future lost another $3.20 or 8.0% to $37.05/bbl. The aggregate inventory level was down another 0.5%, while crude oil production was flat at 10.7m bbl/day. The Baker Hughes North American was up 9 rigs and the U.S. rig count was up 5 rigs.
The list below details some upside and downside risks relevant to the steel industry. The orange ones are occurring or look to be highly likely. The upside risks look to be in control.
Upside Risks:
Downside Risks: