Content
-
Weekly Highlights
- Market Commentary
- Risks


More of the same this week, as spot prices resume their upward momentum in one of the fastest price rallies over the past decade. Currently, mills are offering around $680/st for new HRC inquiries, with lead times extending through the end of the year. Most mill are holding off on quoting January tons, with the belief that waiting to open order books in a rising price environment will be lucrative. The risk for mills is that prices move too high, deterring buyers from placing orders once the January order book opens. However, we do not believe this is likely due to the structural deficit that has developed in the spot market over the past few months. This week, we will analyze this deficit and discuss possible ways in which may be resolved.
In order to understand the current tightness in the spot market, we made several assumptions about both supply and demand over the past 10 months. First, we assumed that the market was stable in the first few months of this year, with the domestic steel supply in line with demand. This includes both domestic production and imports, which have remained stable at historically low levels throughout this year. From the AISI raw steel production data that we include in this report weekly, we estimated changes to the flat rolled domestic production, giving us the supply of steel in the domestic market throughout the year.
Next, we turned to the demand side, attempting to estimate the total steel consumed in the domestic market during the year. We used industry and company specific economic data from these main steel consuming sectors of the economy: Automotive, Construction, Appliance, OEM and Energy. For example, auto production came to a halt during the spring shutdown, but has since continued to increase as the seasonally adjusted annual rate of auto sales has moved back above its recent historical average. Construction spending has been resilient as previously funded projects continue towards completion, and the residential construction market is on fire. The appliance industry has caught a tailwind as more families allocate savings and discretionary income towards home improvement projects. OEM demand initially took a hit as factories shutdown around the country when workers contracted Covid. However, most have reopened and production levels continue to recover. The energy industry has been weak throughout the recovery. Prices remain under pressure as the oil market is oversupplied and rig counts sit at historically low levels. Bringing all of this together, we were able to estimate flat rolled steel demand during the year, and through comparing it to supply, we estimated the monthly surplus or deficit in terms of tons. These components are shown in the below chart.
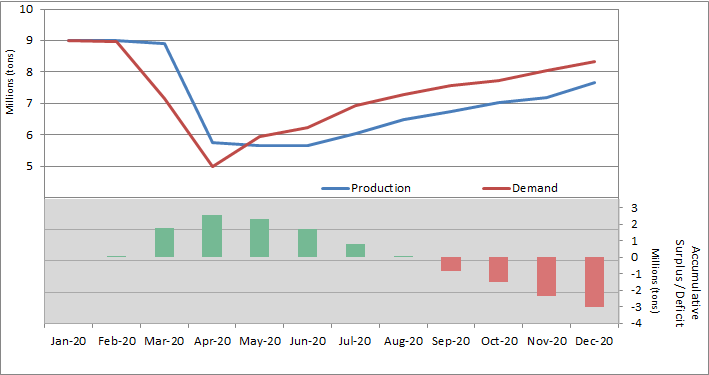
Projecting these same estimates to the final two months of the year, the accumulative deficit at year-end will be near 3 million tons. Therefore, for the current rally to stop, production will have to ramp up to levels above demand for a period long enough to make up this deficit, which appears unlikely given the discipline from domestic producers this year.

Below are the most pertinent upside and downside price risks:
Upside Risks:
Downside Risks:

The Platts TSI Daily Midwest HRC Index increased by $27.75 to $680.50.

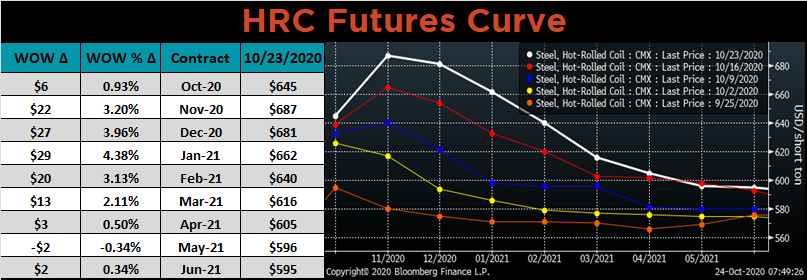
The CME Midwest HRC futures curve is below with last Friday’s settlements in white. The front of the curve rose significantly last week.
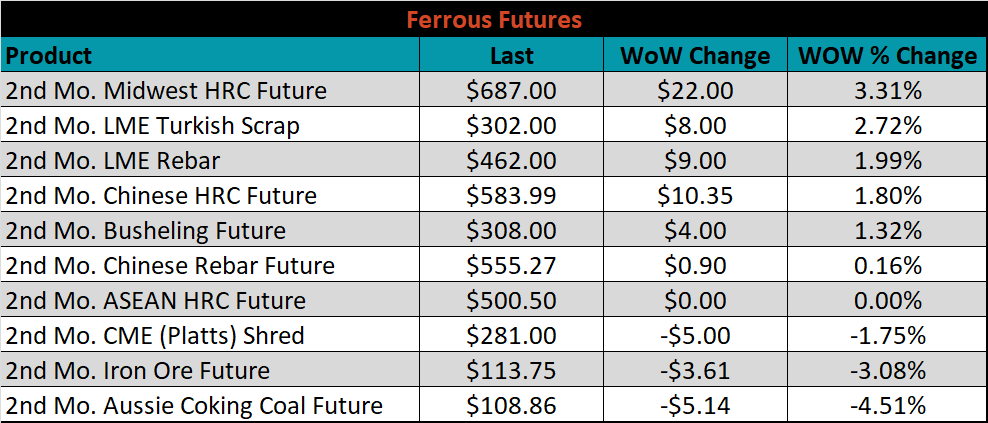
November ferrous futures were mixed. Midwest HRC gained 3.3%, while Aussie coking coal fell another 4.5%. The November Aussie coking coal future is down nearly 25% over the past month.
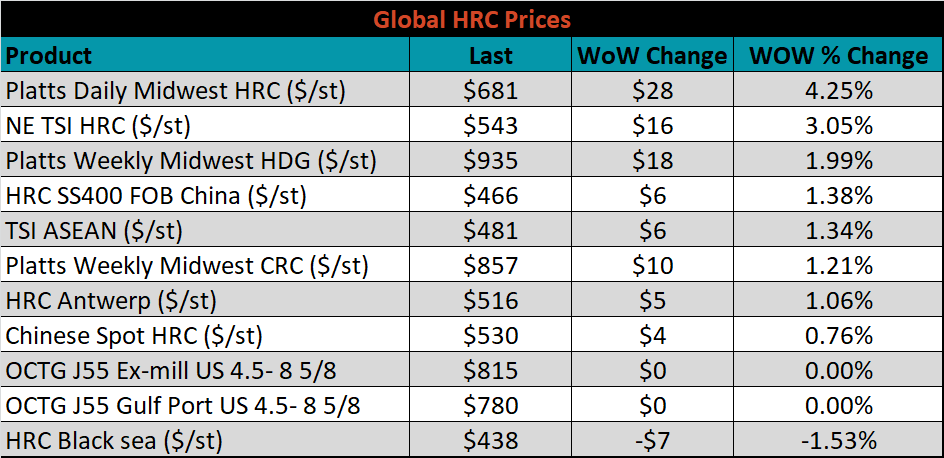
The global flat rolled indexes were mostly higher. TSI Platts Midwest HRC was up 4.3%, while HRC Black Sea was down 1.5%.
The AISI Capacity Utilization rate increased 1.5% to 69.4%.


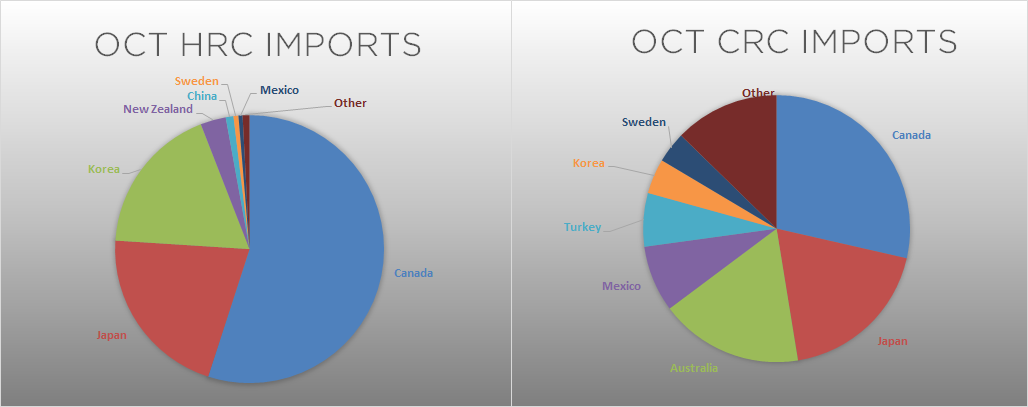
October flat rolled import license data is forecasting a decrease of 68k to 549k MoM.

Tube imports license data is forecasting a decrease of 10k to 170k in October.


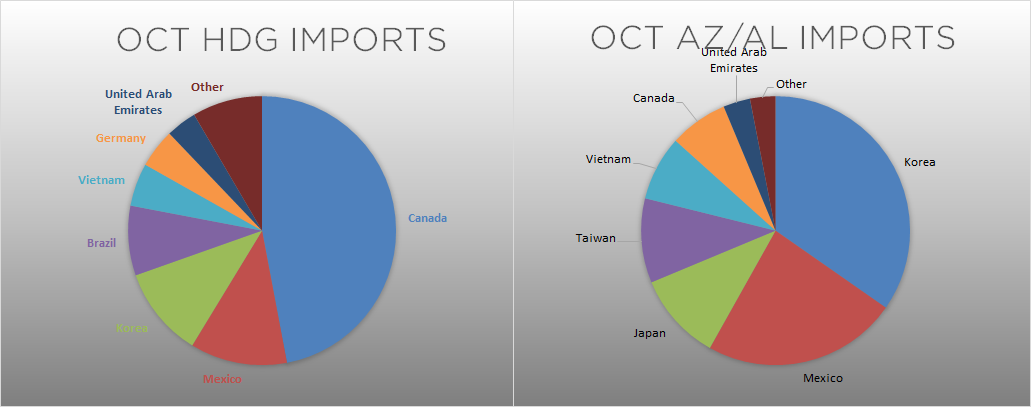
October AZ/AL import license data is forecasting a 22k decrease to 41k.

Below is October import license data through October 20, 2020.


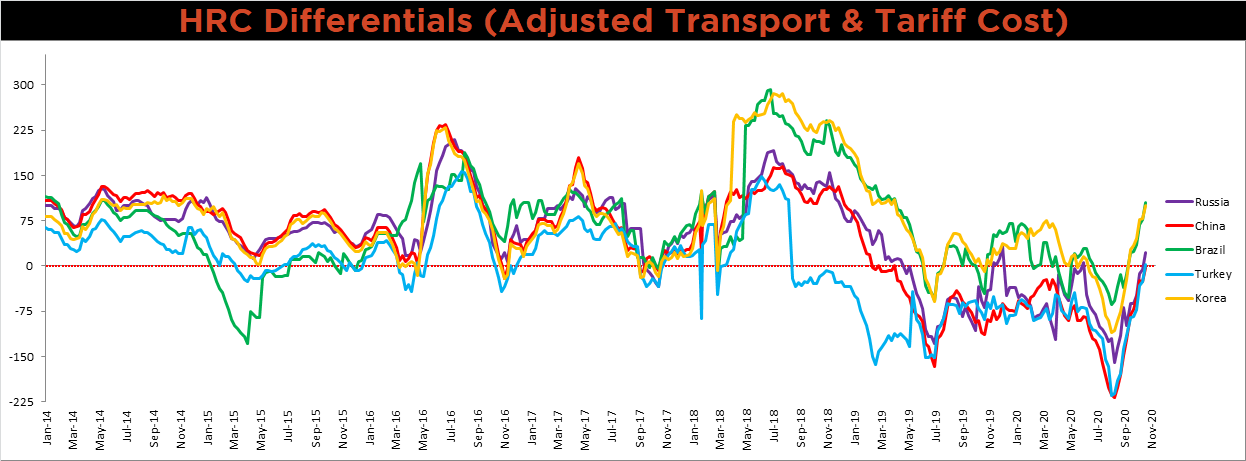
Below is the Midwest HRC price vs. each listed country’s export price using pricing from SBB Platts. We have adjusted each export price to include any tariff or transportation cost to get a comparable delivered price. The differentials for all watched countries increased again last week, as the U.S. price outpaced all global prices.
SBB Platt’s HRC, CRC and HDG pricing is below. The Midwest HRC, HDG and CRC prices were up, 4.3%, 2% and 1.2%, respectively. Globally, the Northern European HRC price was up 2.8%.


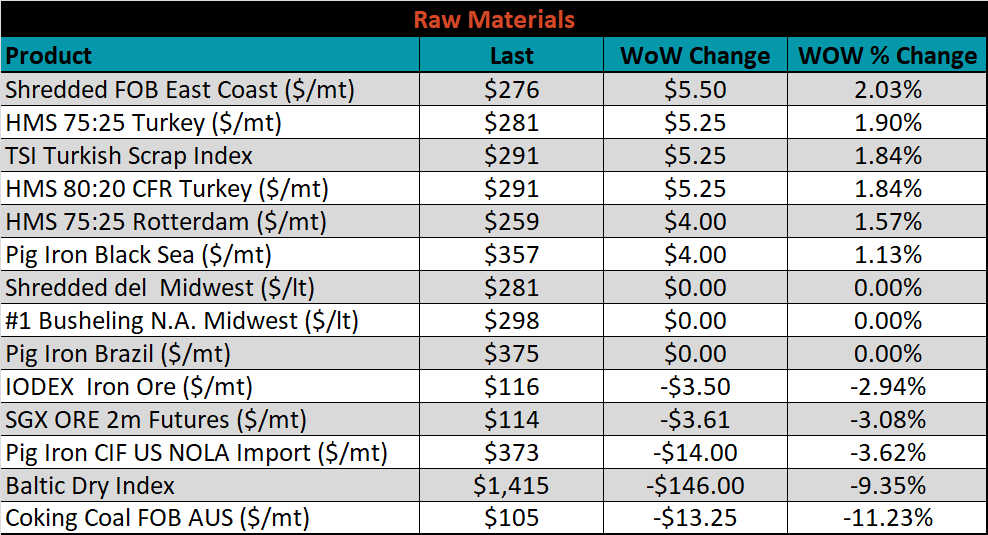
Raw material prices were mixed. East Coast shredded was up 2%, while Aussie coking coal was down another 11.2%.
Below is the iron ore future curve with Friday’s settlements in orange, and the prior week’s settlements in green. Last week, the curve decreased slightly, more so in the front, excluding the front month expiration.

The ex-flat rolled prices are listed below.


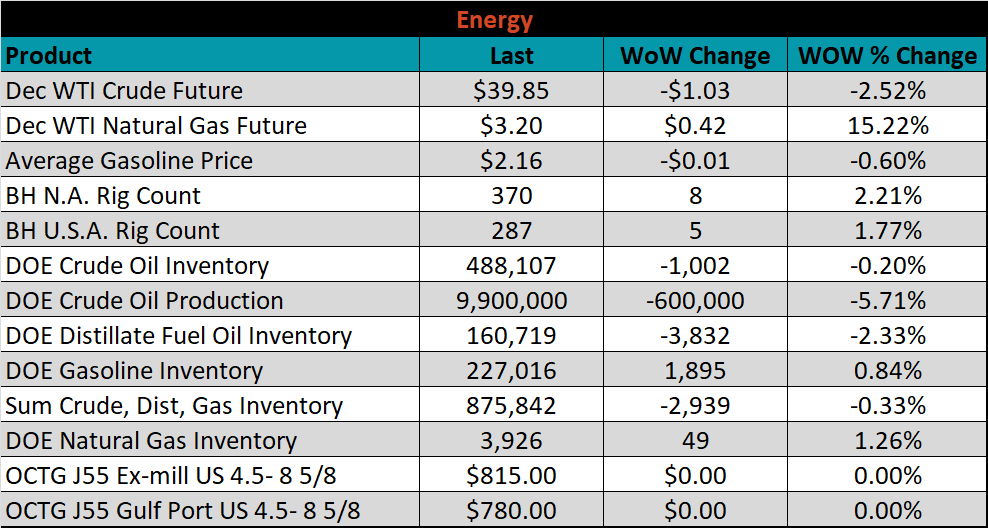
Last week, the December WTI crude oil future lost $1.03 or 2.52% to $39.85/bbl. The aggregate inventory level was down another 0.3%, while crude oil production fell to 9.9m bbl/day. This is the first time production is below 10m bbl/day since February 2018. The Baker Hughes North American rig count was up 8 rigs and the U.S. rig count was up 5 rigs.


The list below details some upside and downside risks relevant to the steel industry. The orange ones are occurring or look to be highly likely. The upside risks look to be in control.
Upside Risks:
Downside Risks: