Content
-
Weekly Highlights
- Market Commentary
- Risks


The big news at the end of last week was ArcelorMittal raising sheet prices $40/st, which was immediately followed by increases at all the other mills. This move by the mills was largely anticipated by the market, and has raised the lowest HRC mill offers from mid to low $400/st into a tighter range just below $500/st. Now the question is “Will the increase be successful, and if so, how far can prices rally?” To answer this, we will look at the market conditions during the two previous mill increase announcements this year and how prices reacted to each. Below is a graph of the Platts TSI Daily Midwest HRC Index, with the red arrows signaling the two periods where mills attempted to raise prices.
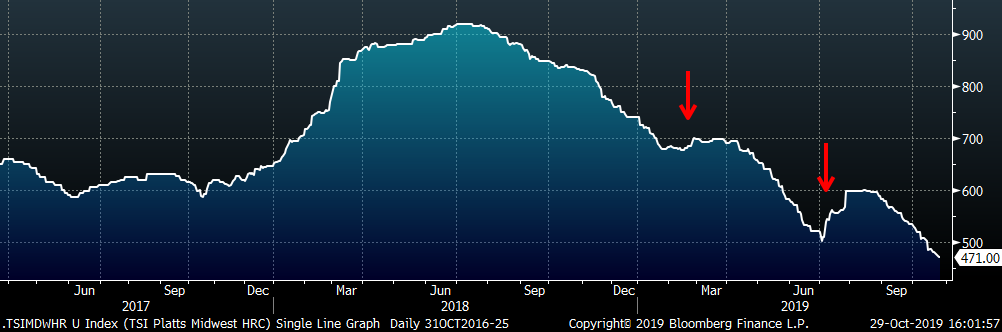
In the first quarter, mills announced price increases, which temporarily stabilized the spot price. At this point, scrap prices stabilized, and both BOFs and EAFs were producing and selling profitably, allowing them to maintain production levels. Import levels declined, but did not disappear.
Prices resumed their decline in the 2nd quarter until mills raised prices again in July. Before the price increase announcements, profitability on the marginal ton produced was negative for BOFs, and at the lowest level for both integrated and mini mills since 2016. This caused US Steel to remove capacity, which supported the increases. Differentials between domestic and global prices reached the lowest level in 5 years in July, signaling that imports were extremely unattractive. Scrap prices also moved up $30-$40 during July and August.
The summer announcements were successful in actually raising the price $100/st, but both increases only temporarily paused the downtrend. Destocking and tighter inventory management throughout the year has reinforced the steel buyer’s position to delay purchases, pushing spot prices to the lowest levels since 2016. Based on the factors above, for the current increase announcements to hold and encourage further increases, scrap prices will need to move higher in both November and December. Additionally, production will need to decrease to levels that match current demand, as a falling price represents an oversupplied market. Mills do have planned outages throughout the fourth quarter, but any holes in their November or December order book would signal too much supply. Imports will need to continue to decline.
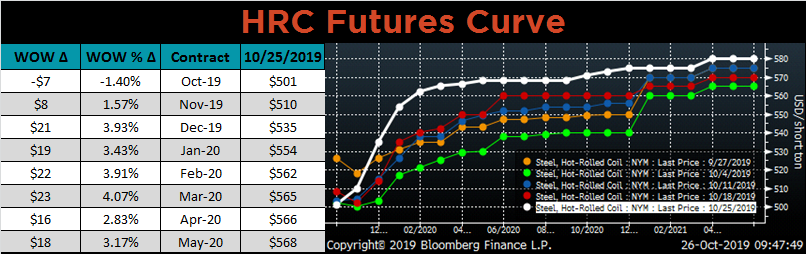
We often discuss the futures curve as it represents the markets expectations for future spot prices, despite the fact that it has a horrible track record of predicting prices. In February, the curve was priced above $700/st for 2019, and around $720 for the second quarter. We now know that spot prices fell to $500/st in June. The futures curve had last week’s price increase priced in, as well as multiple more increases through the end of the year. With the current market factors discussed above, this seems ambitious. Therefore, we continue to recommend buying spot tons now at the lowest prices since 2016.
Below are the most pertinent upside and downside price risks:
Upside Risks:
Downside Risks:
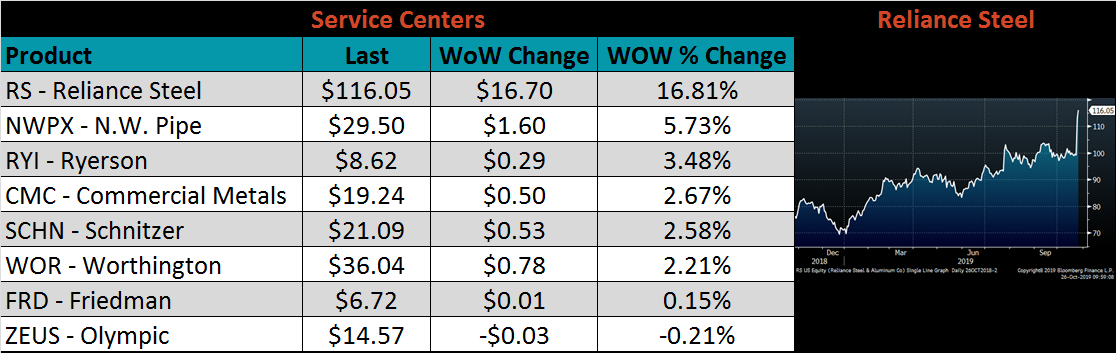
The Platts TSI Daily Midwest HRC Index was down $10.50 to $471.00.
The CME Midwest HRC futures curve is below with last Friday’s settlements in white. The curve moved up across all expirations more significantly in the front.
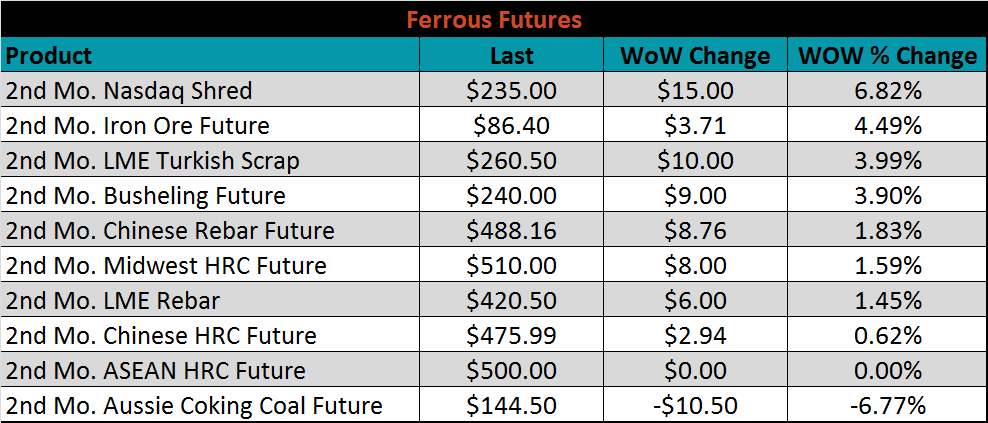
November ferrous futures were mostly higher. The December Nasdaq shred future gained 6.8%.
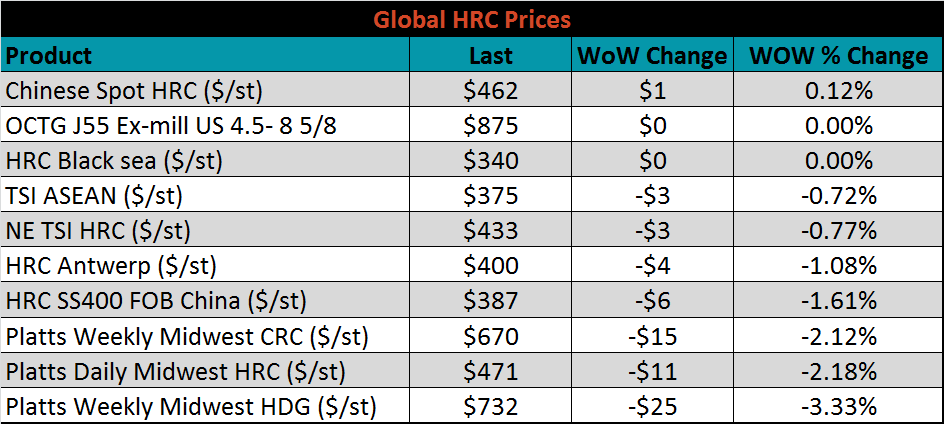
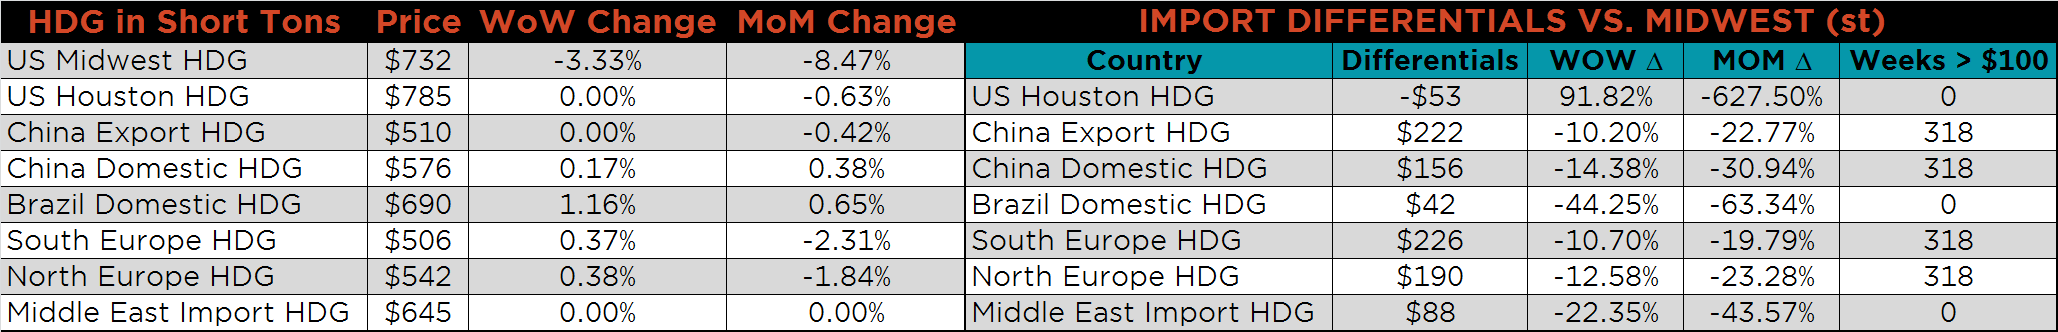
The global flat rolled indexes were mostly lower. Chinese spot HRC was up slightly, while Midwest TSI HDG was down 3.3%.
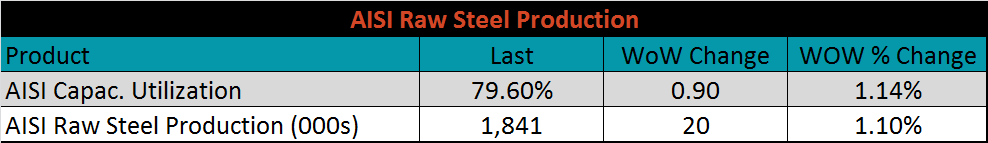
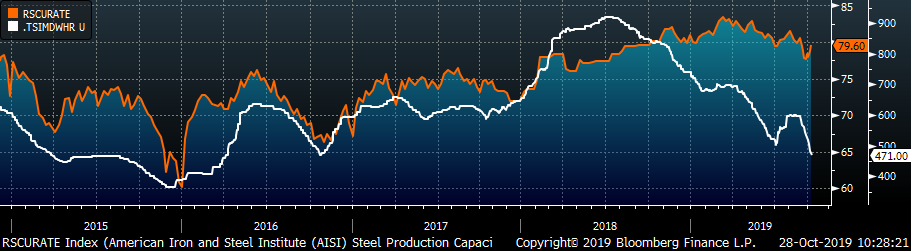
The AISI Capacity Utilization Rate was up 0.9% to 79.6%. Production has been climbing recently and the utilization rate has been inching closer to the 80% goal set by the Trump administration. It is difficult to see a significant price rally in the months ahead with the current level of production and additional capacity to be added next year.
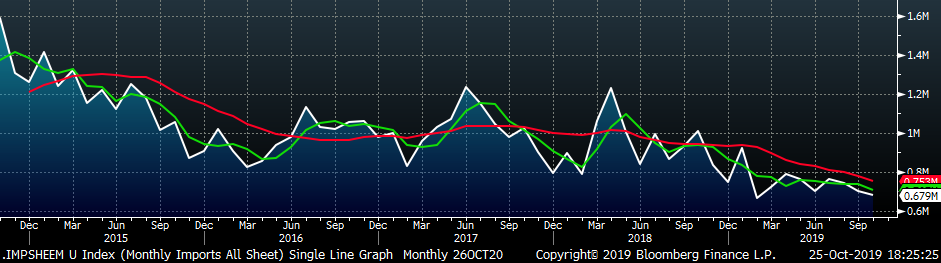
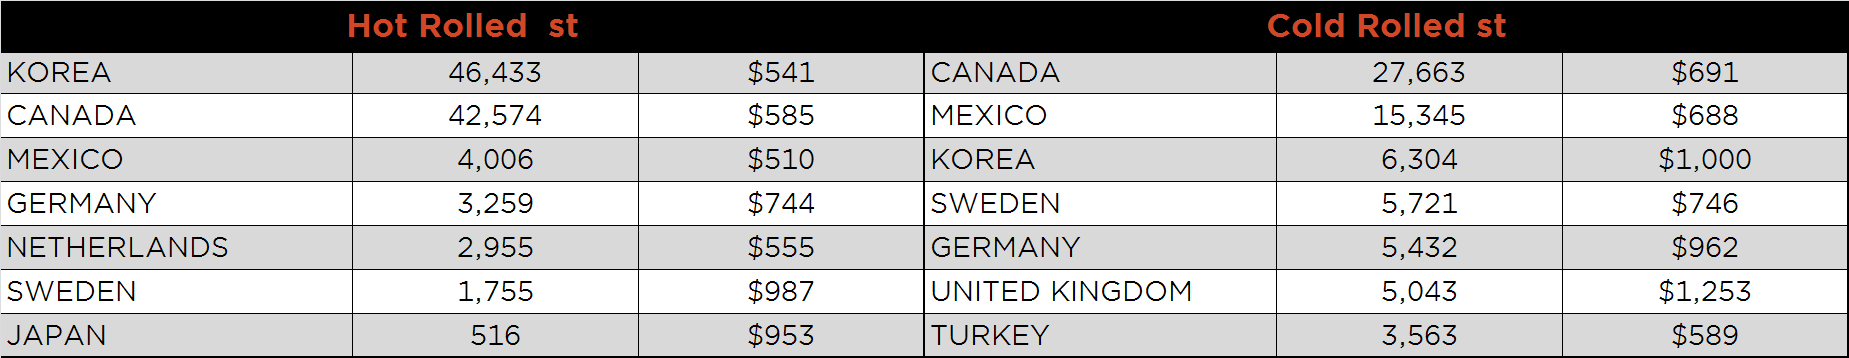
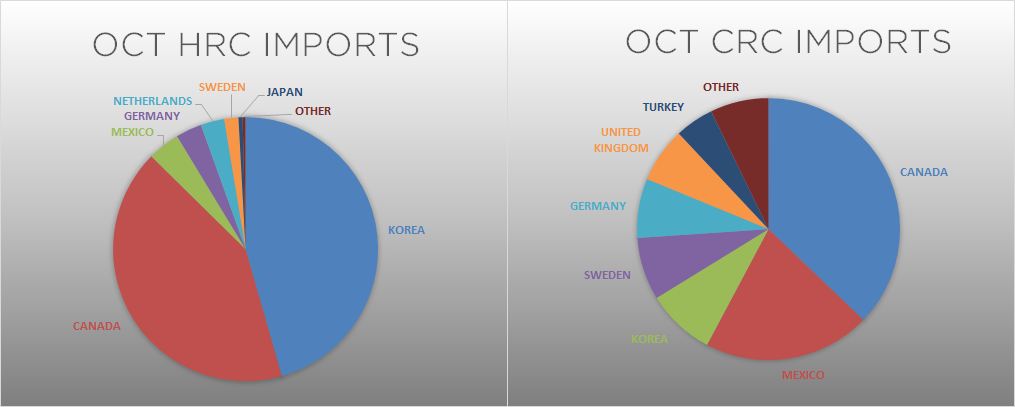
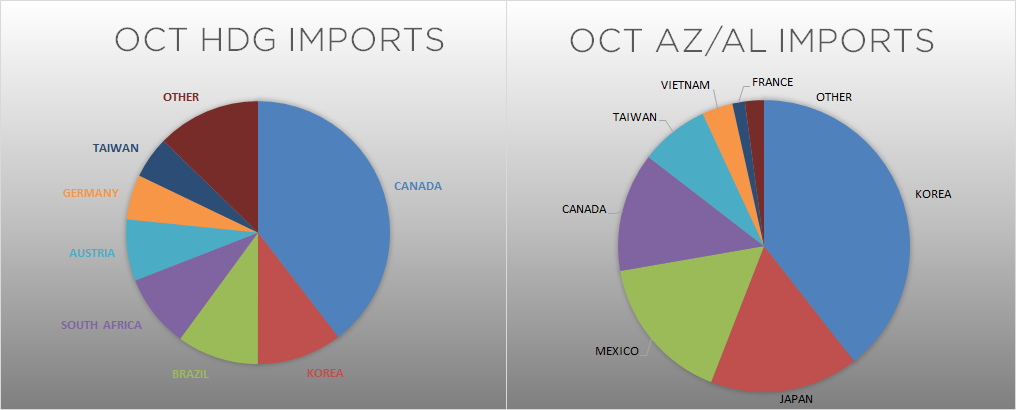
October flat rolled import license data is forecasting a decrease of 22k to 679k MoM.
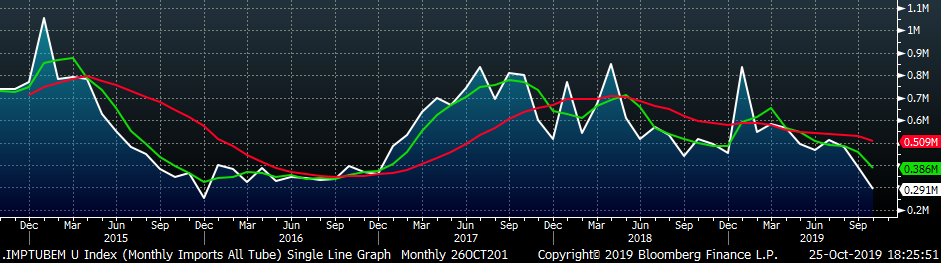
Tube imports license data is forecasting a MoM decrease of 98k to 291k tons in October.
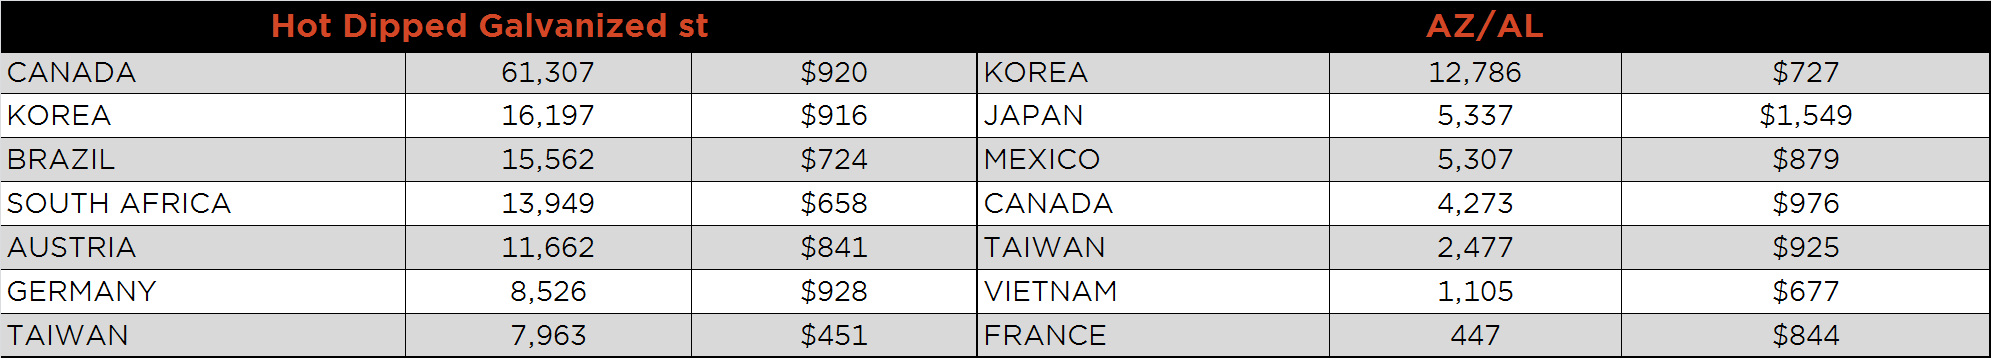
AZ/AL import license data is forecasting a decrease of 24k in October to 40k.
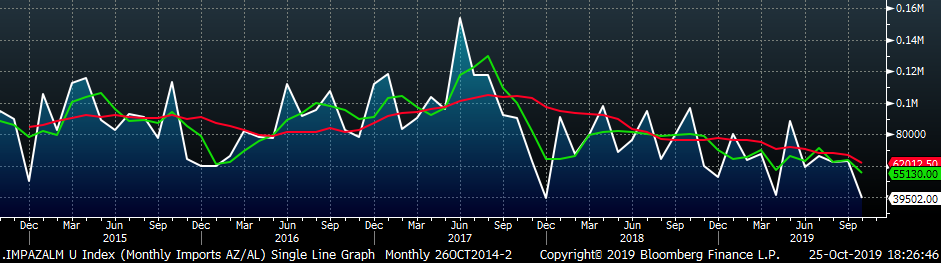
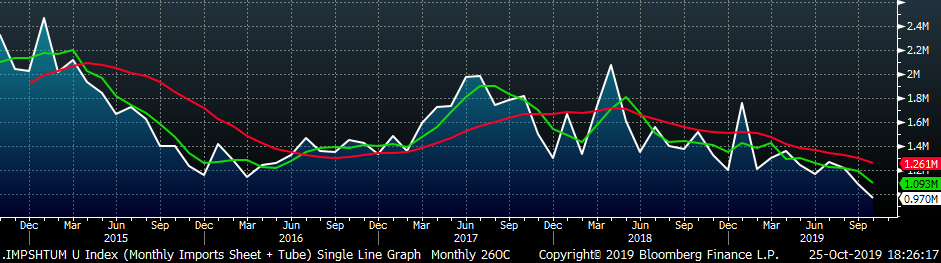
Below is October import license data through October 22, 2019.
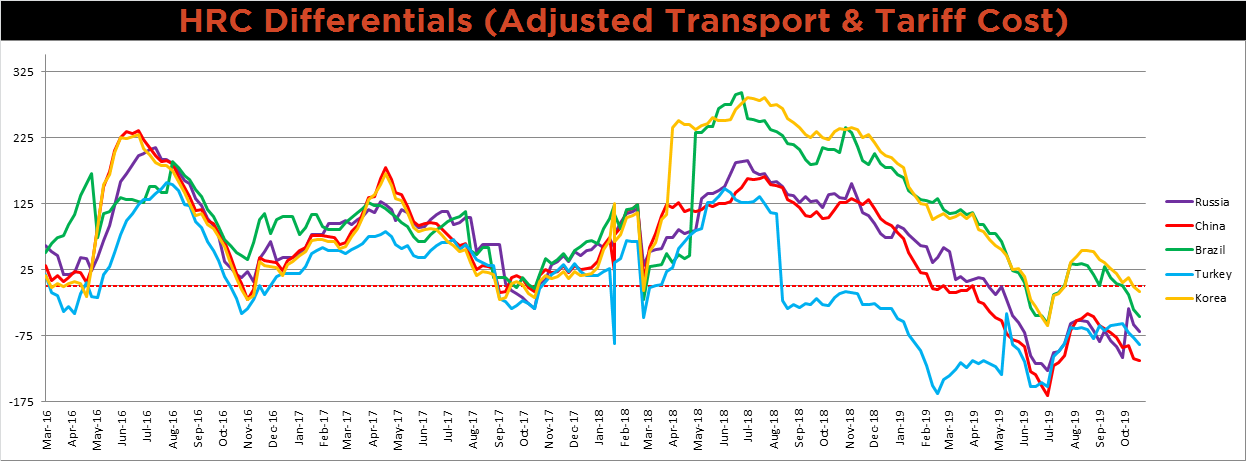
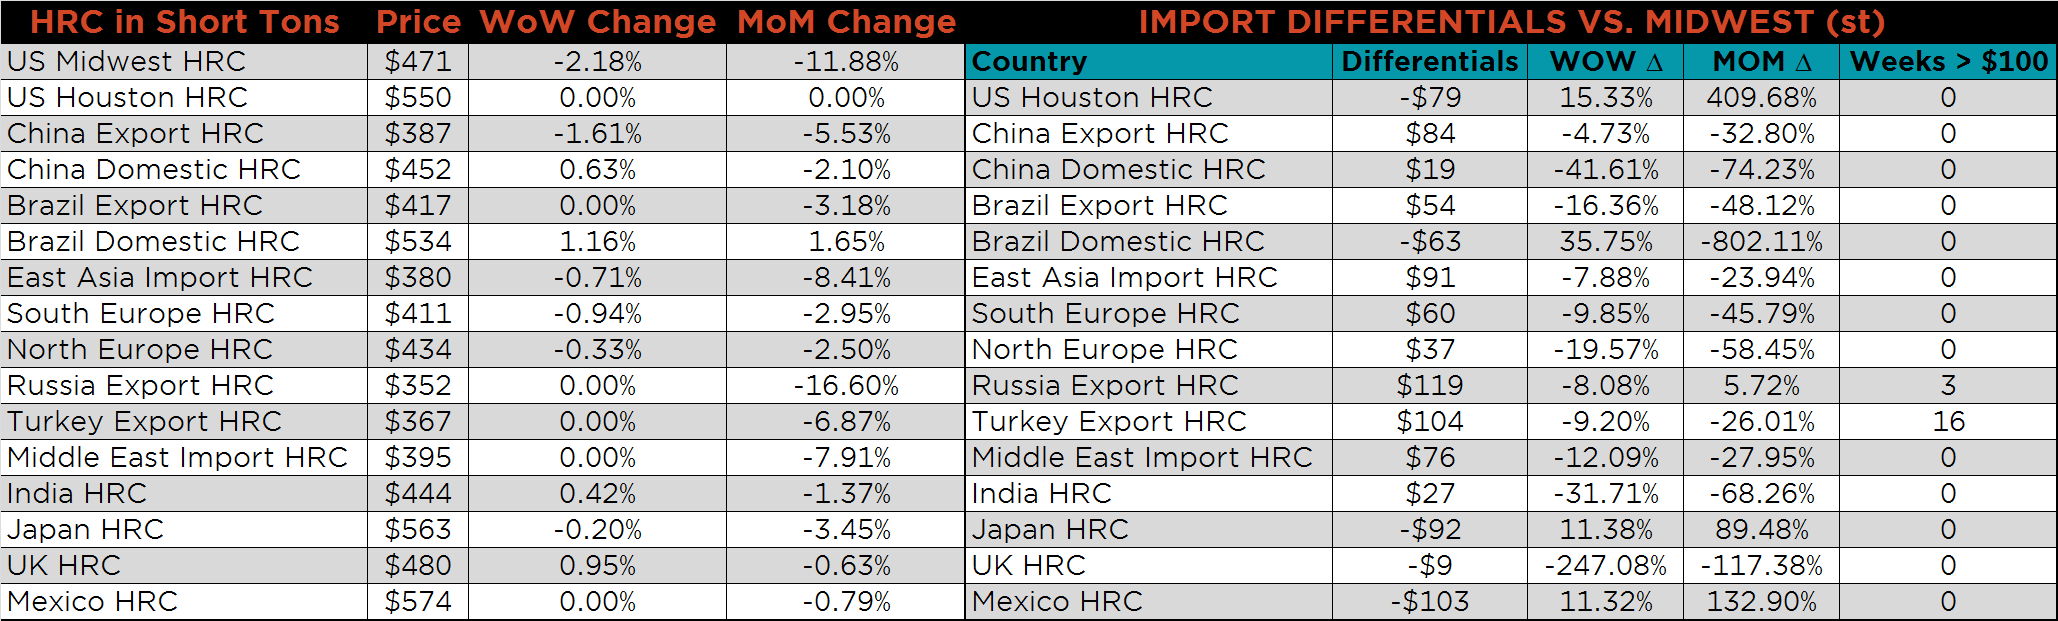
Below is the Midwest HRC price vs. each listed country’s export price using pricing from SBB Platts. We have adjusted each export price to include any tariff or transportation cost to get a comparable delivered price. Global differentials continued to move lower as recent global steel prices have leveled off, while the U.S. domestic price continues its downward trend.
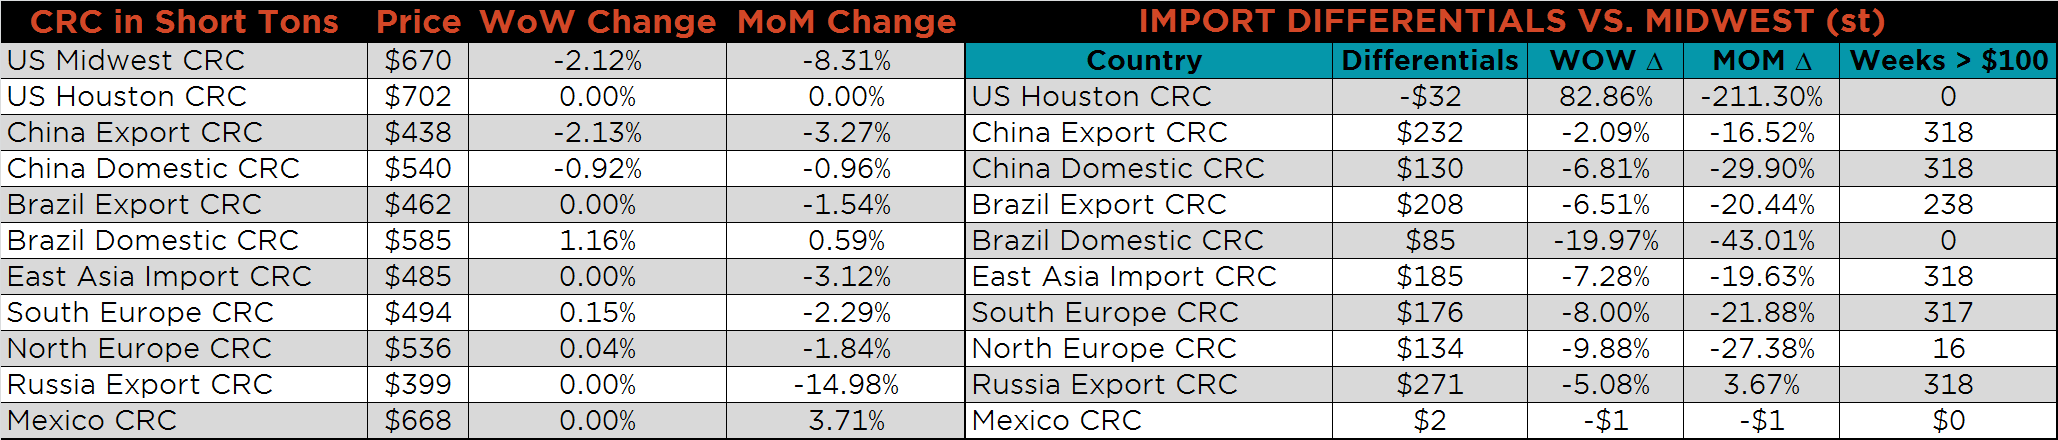
SBB Platt’s HRC, CRC and HDG pricing is below. The Midwest HDG, HRC and CRC prices were down 3.3%, 2.2% and 2.1%, respectively, while Chinese CRC and HRC export prices were down 2.1% and 1.6%, respectively.
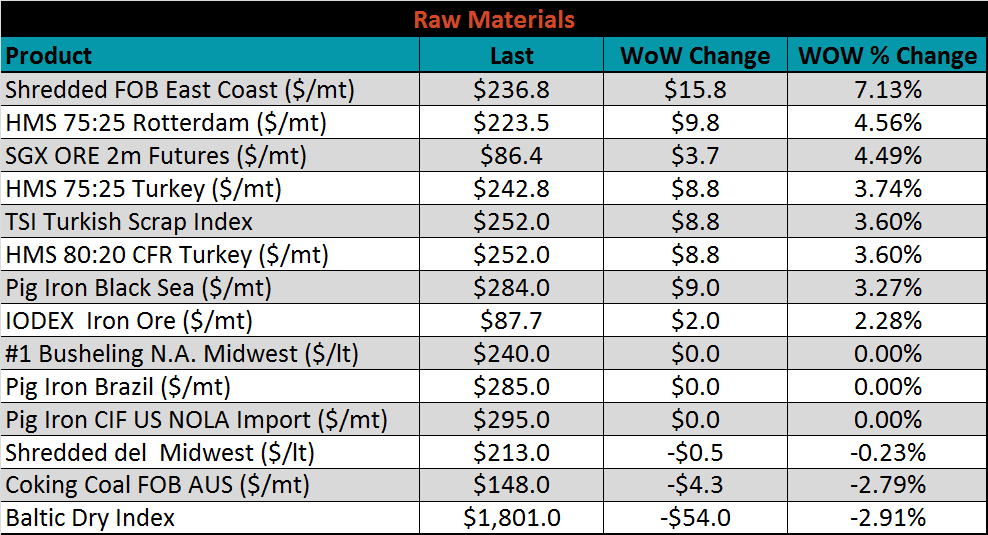
Raw material prices were mostly higher. Shredded FOB East Coast was up 7.1%, while coking coal FOB Australia was down 2.8%.
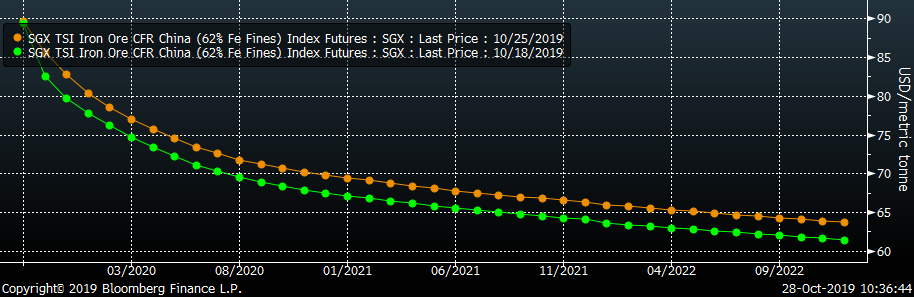
Below is the iron ore future curve with Friday’s settlments in orange, and the prior week’s settlements in green. The curve shifted higher across all expirations.
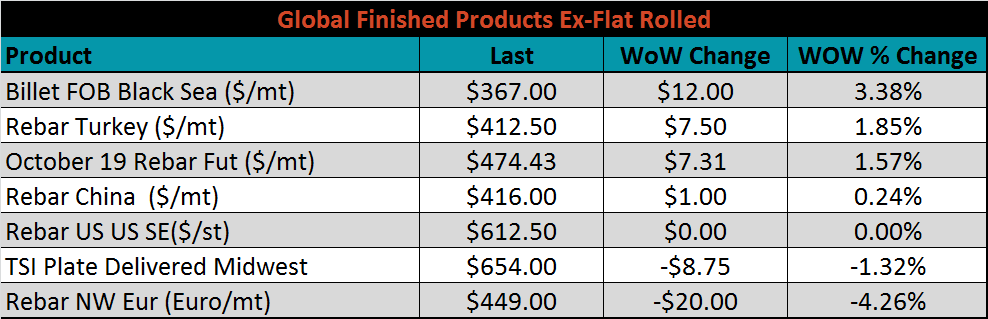
The ex-flat rolled prices are listed below.

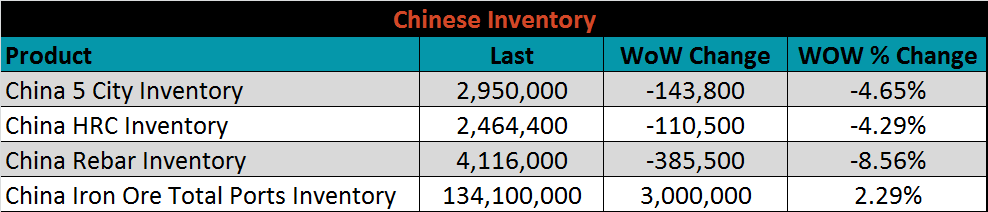
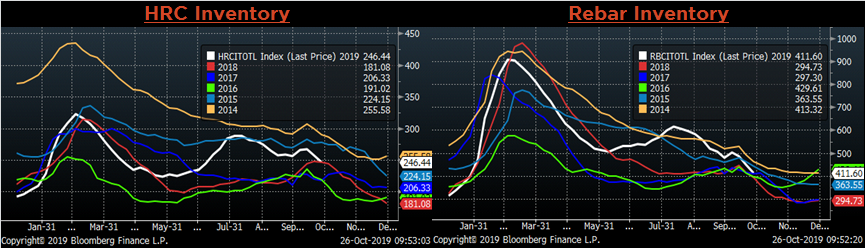
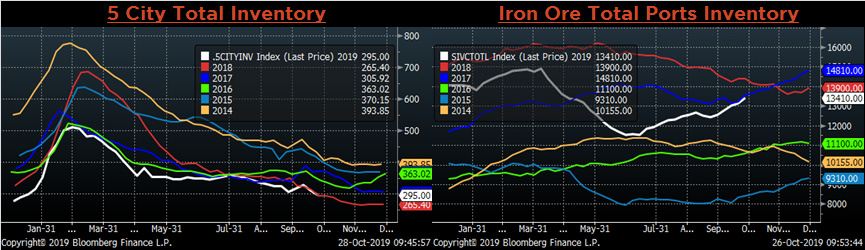
Below are inventory levels for Chinese finished steel products and iron ore. The Chinese Rebar, 5-city and HRC inventories were lower again on the week, 8.6%, 4.6 and 4.3%, respectively. On the other hand, iron ore inventory continues to build, up 2.3%. Seasonality suggests a general trend lower is anticipated in Rebar, 5-city and HRC inventory, which should lead to lower iron ore inventory levels at current elevated price and weak global steel demand.
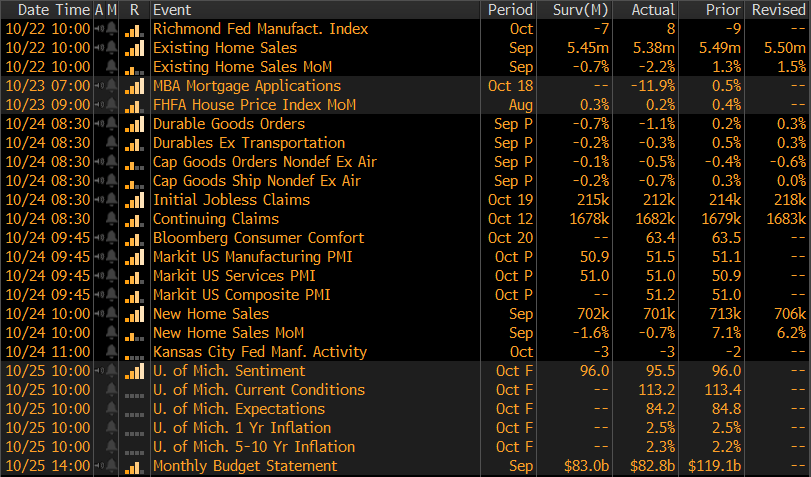
The remaining significant economic data is to the right. This week, the preliminary September Durable Goods Report came in below expectations of minus 0.7% down to minus 1.1%. This is largely because of the uncertainty around the UAW – GM strike, but new orders were still slightly lower MoM at minus 0.3% after removing transportation. Additionally, the October Richmond Fed Manufacturing Index printed 17 points higher than September at 8, well above the expectation of -7. The October Kansas City Fed Manufacturing Index was down 1 point from September and matching the expectation of -3.
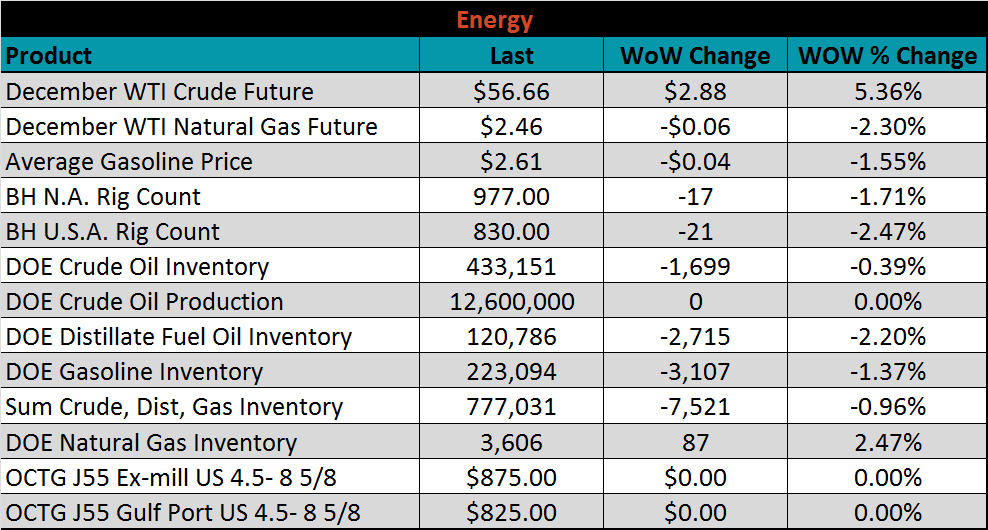
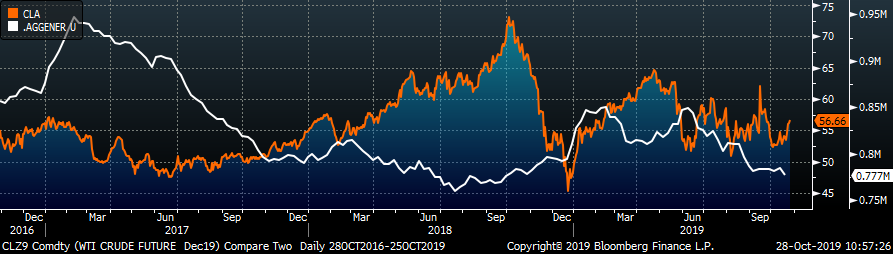
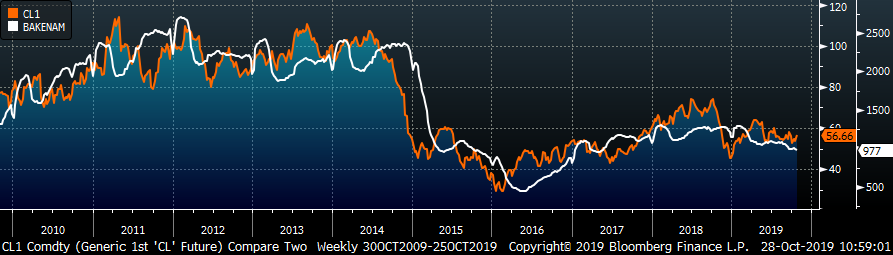
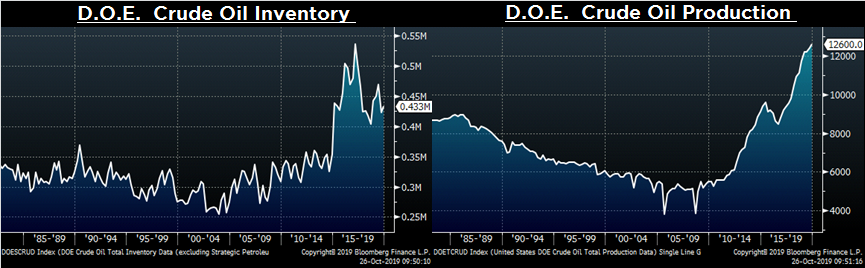
Last week, the December WTI crude oil future gained $2.88 or 5.4% to $56.66/bbl. The aggregate inventory level was down 1%, while crude oil production remains at 12.6m bbl/day. The Baker Hughes North American rig count lost seventeen rigs, while the U.S. count lost twenty-one. Steel demand from the energy sector has been weak, signaling that higher oil prices are needed to induce producers to add any meaningful production.
The list below details some upside and downside risks relevant to the steel industry. The orange ones are occurring or look to be highly likely. The upside risks look to be in control.
Upside Risks:
Downside Risks: