Content
-
Weekly Highlights
- Market Commentary
- Upside & Downside Risks


Last week was a quiet week in the physical market, as spot pricing continued its grind lower, albeit at a wide range of offerings depending on specs and geography. As we get closer to the end of the year, it appears as though neither mills nor buyers want to do anything to rock the boat. Lead times continued to dip slightly, and additional mills have started to offer limited spot availability (for mid-December production). However, the seasonal slowdown within the steel market has not yet provided a light at the end of the tunnel for current logistics hurdles. This will be one of the most important stories for the beginning of year, as anticipated import arrivals are expected to be higher even higher in 1Q22. In the remainder of this report, we will analyze recent news around steel trade negotiations.
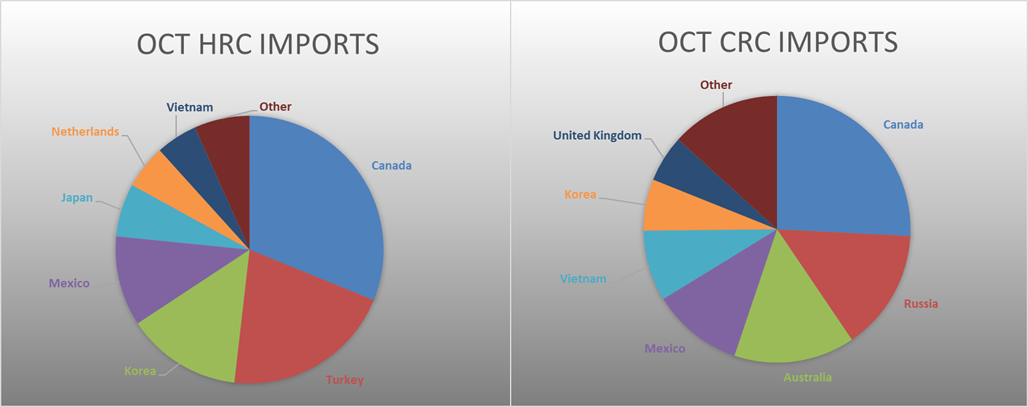
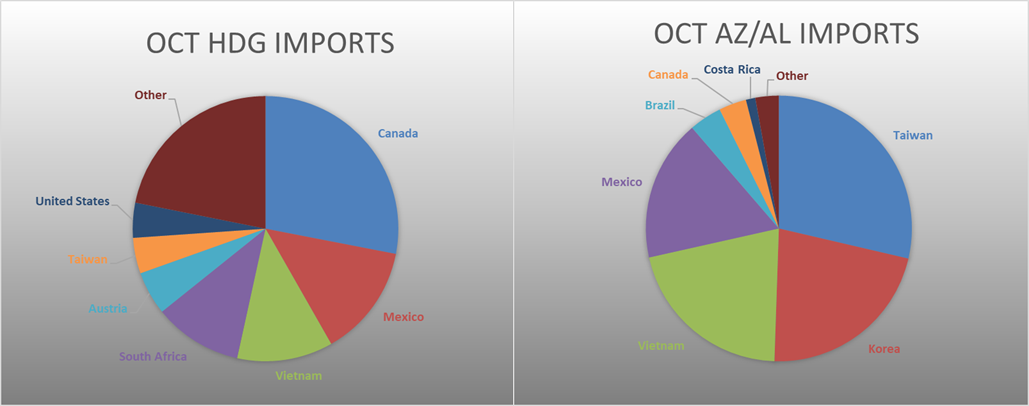
Over the weekend and with an impending deadline, the E.U. and U.S. came to an all but expected resolution on tariffs where the 25% tariffs will be replaced by a tariff rate quota (TRQ). This shifts the system from blanket tariffs to an annual 3.3M ton quota and 25% tariffs on all additional arrivals. As soon as the Biden administration was sworn in, headlines around E.U. and U.S. trade normalization started to print, each time having less of an impact on the HRC futures market. This likely occurred because the market realized that pre-232 tariffs, European sheet steel imports made up, on average, less than 2% of all imports and domestic production each year. While we believe the overall impact of the TRQ system with the E.U. will not have a significant impact on the domestic market, there are important signals being broadcast to other countries still impacted by vestiges of the Trump administration trade policies. The chart below breaks down inflows of HRC, CRC & HDG from the major importing regions.
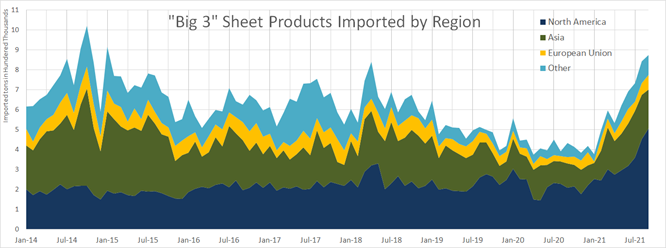
Just by looking at the chart, the two beneficiaries (other than U.S. domestic mills) have been Mexico and Canada. This chart also clearly shows the point mentioned above, that Europe is not a driver of this market. Turning back to the new E.U. – U.S. TRQ system, a standout phrase that will provide a blueprint for any additional 232 trade resolutions going forward is “melted and poured.” This language embedded in the agreement is a clear signal of additional resistance by the U.S. towards exporters attempting to pass “unclean” steel produced in less environmentally focused countries (namely China) onto our shores. Digging deeper into the historical figures, Chinese imports have been the most negatively impacted from trade protectionism, going from a month average of 57,000st to just 4,000/st.
Thinking about what comes next – Korea, Brazil, Japan, Turkey, and Taiwan are trading partners that have been watching these negotiations closely. Those 5 countries combined were exporting nearly 3 times as much steel to the U.S. compared to the E.U. pre-232, and at significantly lower prices. Somewhat buried in the headlines is the fact that the U.S. and Japan are working on a similar agreement and all signs point to an impending announcement there. Korea and Brazil each have firm cap quota’s currently in place already. After that, negotiations appear to be at a standstill for both Turkey and Taiwan. Our analysis of the 232 tariffs shows that it took nearly 9 months for the policy change in 2018 to impact actual arrivals. With current global logistics problems, we believe it would take even longer to see a material impact on the current market. While the implications of E.U. – U.S. agreement will likely drive continued convergence of global and domestic prices, it will not solve your current availability needs.

Below are the most pertinent upside and downside price risks:
Upside Risks:
Downside Risks:

The Platts TSI Daily Midwest HRC Index decreased by $12.50 to $1,890.

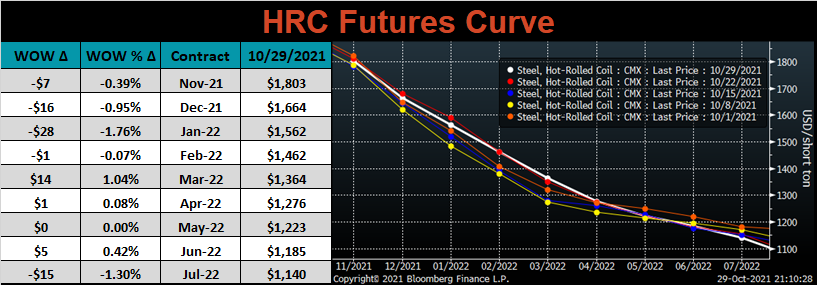
The CME Midwest HRC futures curve is below with last Friday’s settlements in white. Last week, the curve was mixed, with the front end lower.
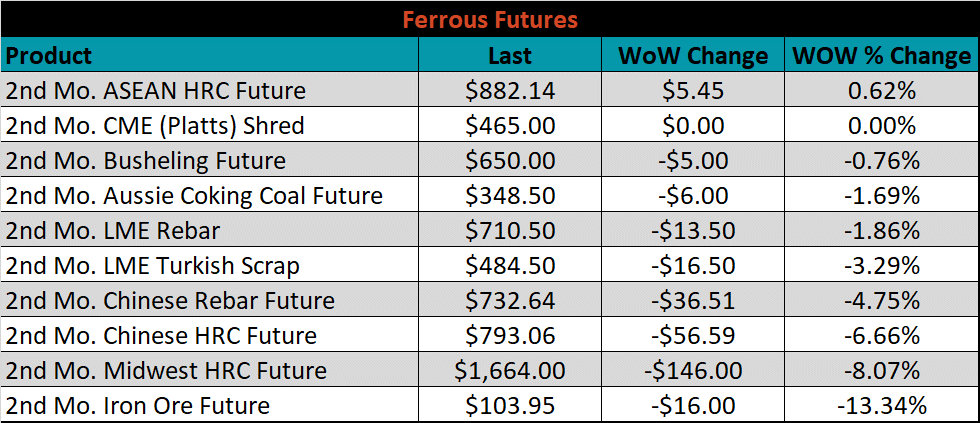
December ferrous futures were mostly lower, led by iron ore which lost 13.3%, while ASEAN HRC gained 0.6%.
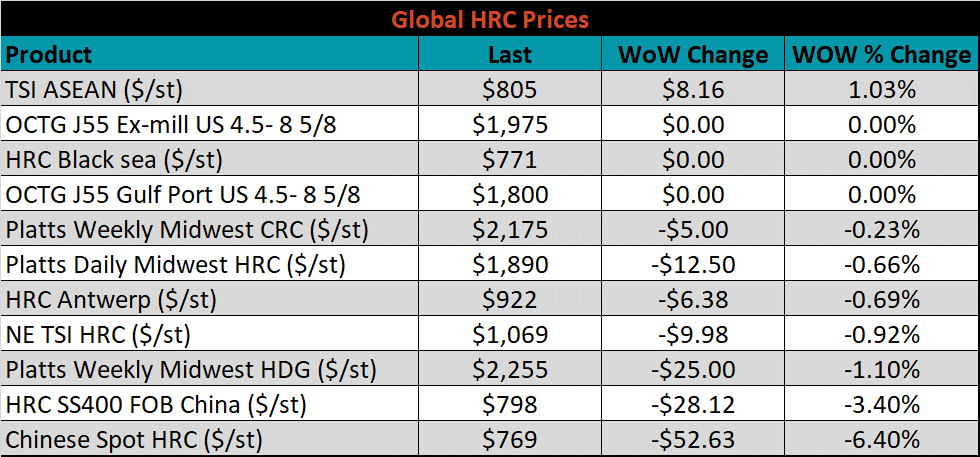
Global flat rolled indexes were also mostly lower, led by Chinese spot HRC, down 6.4%, while TSI ASEAN was up 1%.
The AISI Capacity Utilization was down 0.6% to 84.7%.


October flat rolled import license data is forecasting a decrease of 249k to 1,036k MoM.

Tube imports license data is forecasting a decrease of 197k to 303k in October.


October AZ/AL import license data is forecasting a decrease of 28k to 93k.

Below is October import license data through October 25th, 2021.


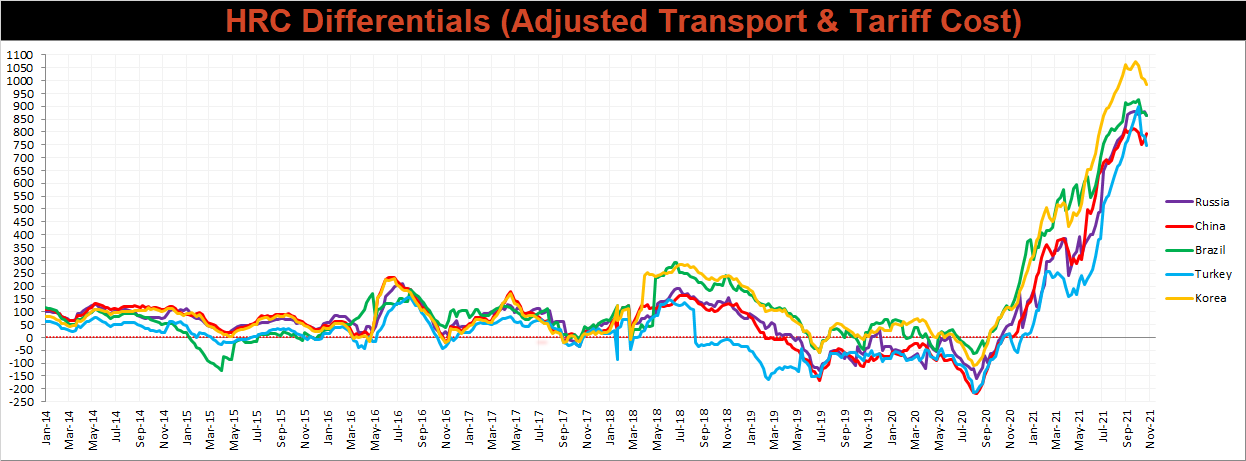
Below is the Midwest HRC price vs. each listed country’s export price using pricing from SBB Platts. We have adjusted each export price to include any tariff or transportation cost to get a comparable delivered price. The Chinese HRC differential was the only one that increased this week, as their prices decreased more significantly than the U.S. domestic price.
SBB Platt’s CRC, HDG and HRC pricing is below. The Midwest HDG, HRC & CRC prices were all lower this week, down 1.1%, 0.7% and 0.2%, respectively. Outside of the U.S., the Chinese domestic HRC price was down another 4.7%.


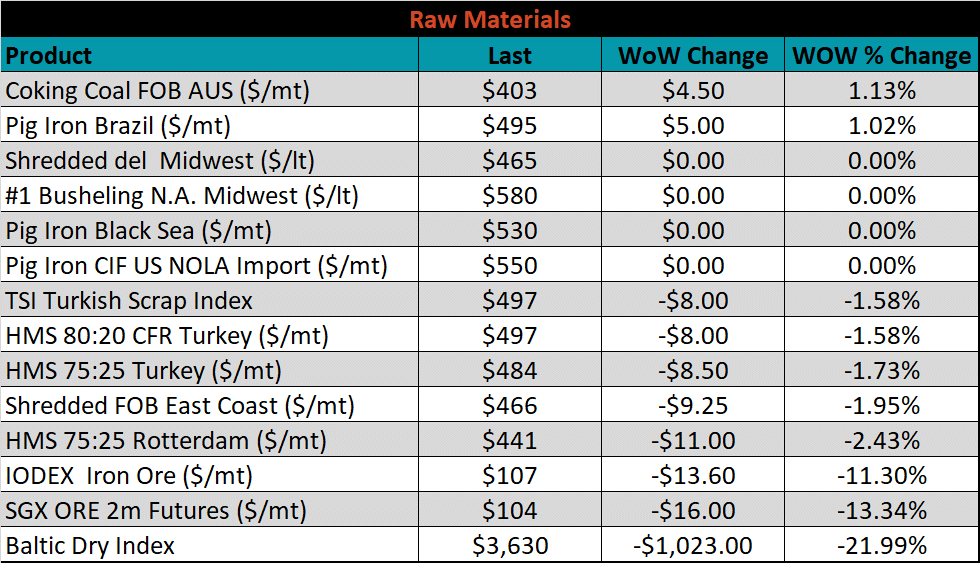
Raw material prices were mostly lower, led by the November iron ore future, down 13.3%, while Aussie coking coal was up 1.1%.
Below is the iron ore future curve with Friday’s settlements in orange, and the prior week’s settlements in green. Last week, the entire curve was shifted significanly lower at all expirations.

The ex-flat rolled prices are listed below.


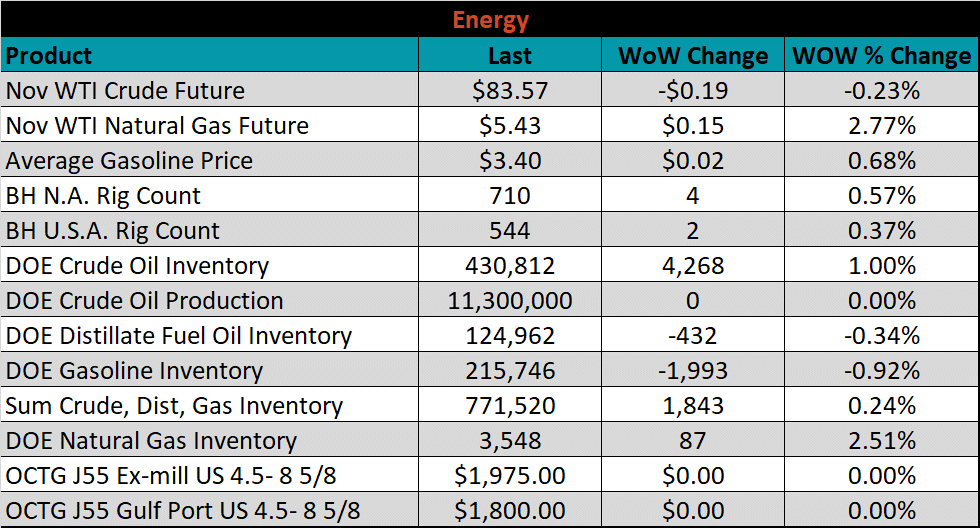
Last week, the November WTI crude oil future was down $0.19 or 0.2% to $83.57/bbl. The aggregate inventory level was up 0.2%, and crude oil production remains at 11.3m bbl/day. The Baker Hughes North American rig count was up 4 rigs, and the U.S. rig count was up 2 rigs.


The list below details some upside and downside risks relevant to the steel industry. The bolded ones are occurring or highly likely.
Upside Risks:
Downside Risks: