
Market Commentary
After being frozen in place since early September, last week, the physical market started to thaw, and it’s become clear that lower HRC spot prices are ahead. This shift in momentum is the result of 5 straight weeks of incremental declines in lead times, and an overall relaxing of high offers on new orders from the mills. Most importantly, historic discount mills, are no longer attempting to sell their limited availability at the same prices as the Big 4. The looming question is – what will this mean for pricing and availability over the remainder of the year? The easy and most likely answer is additional downward pressure on spot prices and increased availability from mills. It is also important to remember that mills are actively reducing longstanding contract tons, so lead times coming in is partially a result of that effort. Additionally, while lead times are moving closer to their historical average, they remain elevated, and mills are currently offering late November/early December production. As this downcycle begins we will turn to another commodity market, which had its price peak early this year, for insight into what we could see for steel prices going forward.
The chart below shows the rolling 2nd month Copper future (orange) and the rolling 2nd month HRC future (white).

From its peak in early May to its recent low in August, and beyond, the clear downtrend in the Copper future price is illustrative of what we anticipate over the coming months for steel prices. As mentioned before, lower prices are expected ahead, however, there are upside risks both existing and emerging. Being lulled into a business as usual, buyer’s strike mentality could be a costly mistake. As shipping/logistics issues and limited transactions will likely cause brief spikes as the price slowly grinds lower. Additionally, extended backlogs of existing orders on top of expanding new orders show that demand for steel related goods will cause buyers to reenter the market and different times.
While the U.S. appears to be insulated from the upcoming energy crisis that has already started to impact Europe and parts of Asia, the fallout will inevitably end up on our shores. In the same way that the structural shortage of steel in the U.S. superseded everything else over the last 13 months, we anticipate varied and far-reaching effects caused by this and increased pressure on global logistics. It is impossible to know when the result will be demand destruction or supply shortages for steel. It is also unclear how the increased demand for global freight will impact imports currently on the water, and tons that are expected to arrive in 1Q22. Furthermore, we implore you not to rely on prior experiences with domestic mills during historic downcycles in price. Industry consolidation has reduced competition and fundamentally changed the landscape. While the true efficacy of mill production cuts in the spring of 2020 is unknown, there is no doubt that stopping the flow of steel was a significant factor leading to the record rally and subsequent record profits they are now enjoying. No one knows when they will choose to pull that lever again, but it has clearly been proven as a powerful tool to combat falling prices.

Durable Goods
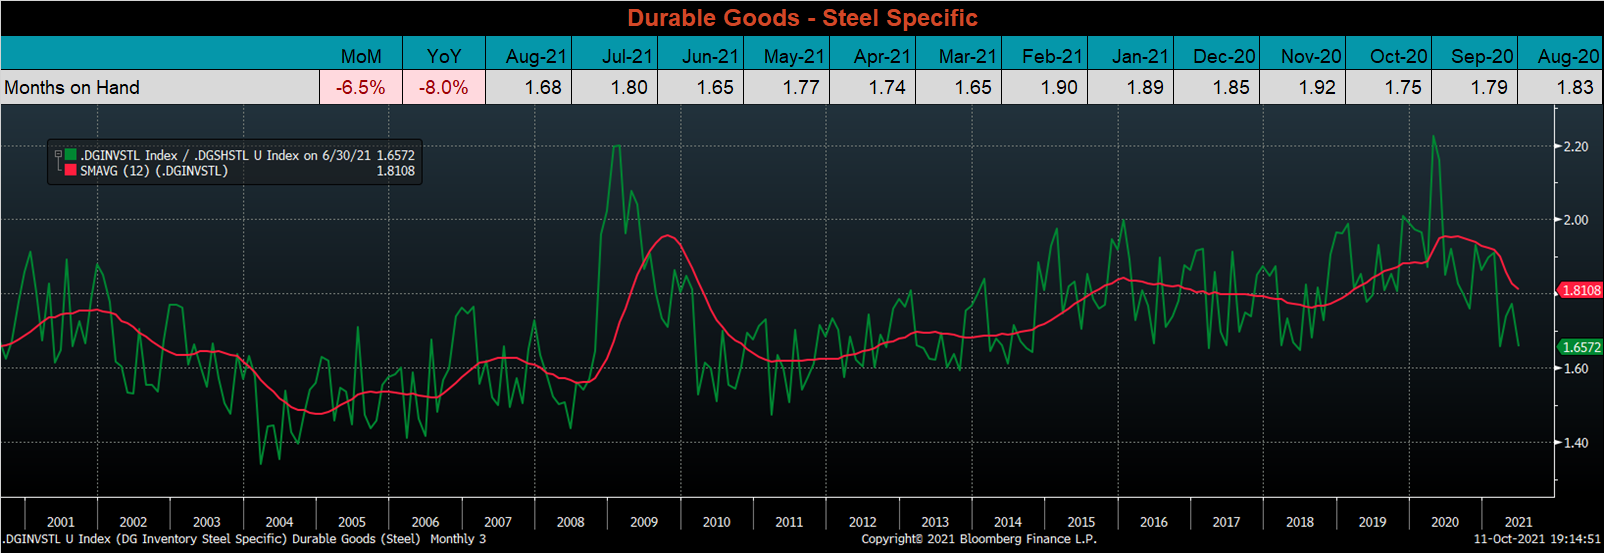
Below are final August new orders from the Durable Goods report. New orders for manufactured goods were up 18% compared to August 2020 and up 6.7% compared to July 2021. Manufacturing ex-transportation new orders were up 16.3% compared to August 2020 and 4.1% higher than in July. The final chart looks at the months on hand (inventory divided by shipments) for durable goods categories that are steel intensive. MOH moved significantly lower and sits just above the recent low found in June and March of this year.
August U.S. Durable Goods New Orders NSA

U.S. Total Manufacturing New Orders Ex-Transportation NSA YoY % Change


Auto Sales
September U.S. light vehicle sales continued to slide, down to a 12.2m seasonally adjusted annualized rate (S.A.A.R), the lowest pre-pandemic level since late 2011. The second chart shows the relationship between the unemployment rate and auto sales. The unemployment rate is inverted to show that declining unemployment typically leads to increasing auto sales. The labor market recovery continued in September, but the breakdown of this relationship is expected to continue until months after the chip shortage is resolved. We view continued improvement in the unemployment rate over that period as additional pent-up demand for cars and steel.
September U.S. Auto Sales (S.A.A.R.)

September U.S. Auto Sales (orange) and the Inverted Unemployment Rate (white)


Risks
Below are the most pertinent upside and downside price risks:
Upside Risks:
- Inventory at end users and service centers below normal operational levels
- Higher share of discretionary income allocated to goods from steel intensive industries
- Changes in China’s policies regarding ferrous markets, including production cuts and exports
- Unplanned & extended planned outages, including operational issues leaving mills behind
- Energy & construction industry rebound
- Prolonged 2022 contract negotiations creating availability concerns in the short term
- Easing labor and supply chain constraints allowing increased manufacturing activity
- Mills extending outages/taking down capacity to keep prices elevated
- Global supply chains and logistics restraints causing regional shortages
Downside Risks:
- Increased domestic production capacity
- Increasing price differentials and hedging opportunities leading to sustained higher imports
- Steel consumers substitute to lower cost alternatives
- Steel buyers and consumers “double ordering” to more than cover steel needs
- Tightening credit markets, as elevated prices push total costs to credit caps
- Supply chain disruptions allowing producers to catch up on orders
- Limited desire to restock at elevated prices, causing a “Buyer’s Strike”

HRC Futures
All of the below data points are as of October 8, 2021.
The Platts TSI Daily Midwest HRC Index decreased by $10 to $1,950.
Platts TSI Daily Midwest HRC Index

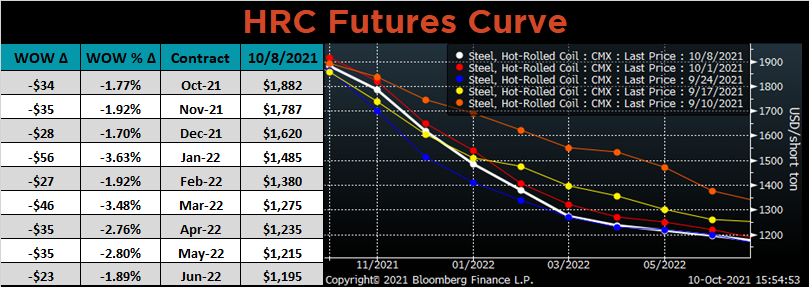
The CME Midwest HRC futures curve is below with last Friday’s settlements in white. The entire curve shifted $30-50 lower last week.
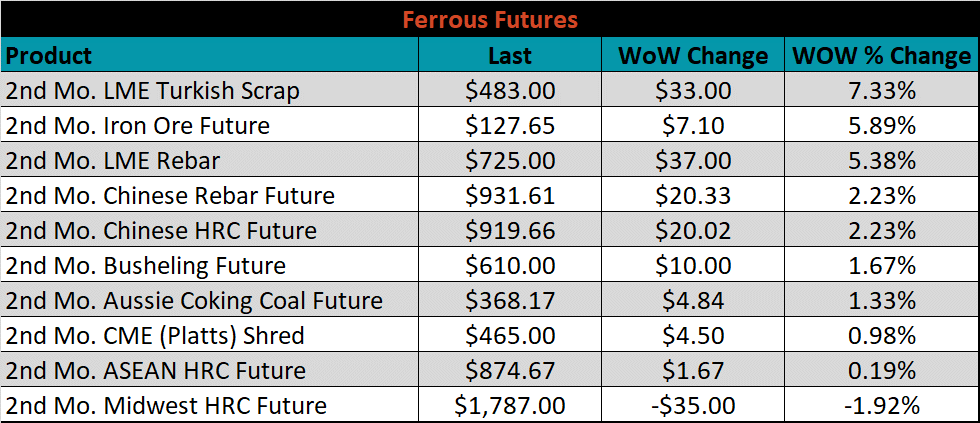
November ferrous futures were mostly higher, led by Turkish scrap, up 7.3%, while Midwest HRC lost 1.9%.
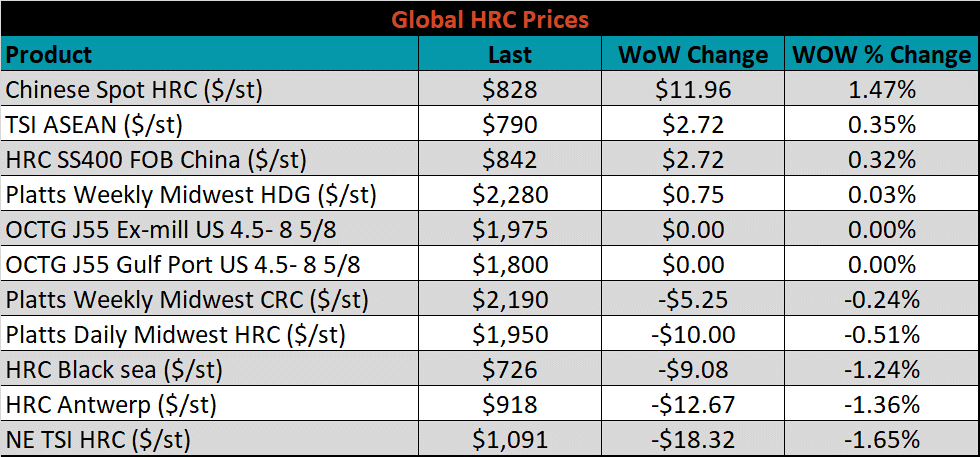
Global flat rolled indexes were mixed, with Chinese spot HRC up 1.5%, while Northern European HRC was down 2.3%.
The AISI Capacity Utilization was down 0.4% to 84.8%.

AISI Steel Capacity Utilization Rate (orange) and Platts TSI Daily Midwest HRC Index (white)

Imports & Differentials
October flat rolled import license data is forecasting a decrease of 6k to 991k MoM.
All Sheet Imports (white) w/ 3-Mo. (green) & 12-Mo. Moving Average (red)

Tube imports license data is forecasting a decrease of 52k to 431k in October.
All Tube Imports (white) w/ 3-Mo. (green) & 12-Mo. Moving Average (red)

All Sheet plus Tube (white) w/ 3-Mo. (green) & 12-Mo. Moving Average (red)

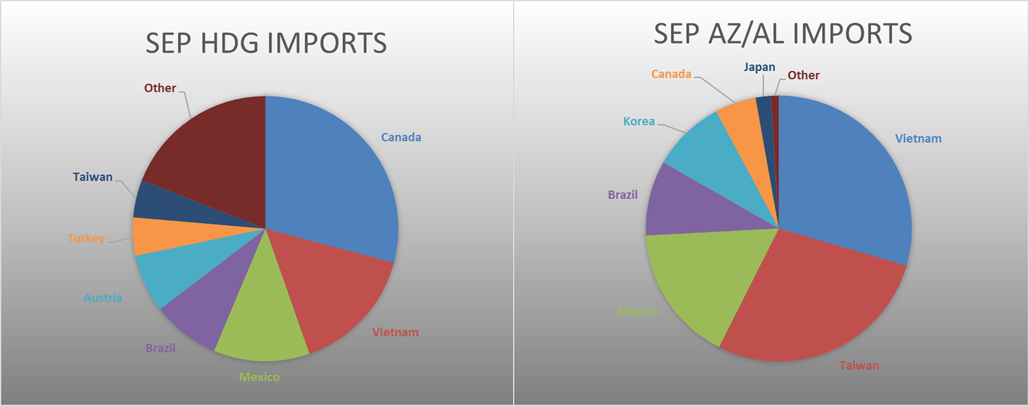
October AZ/AL import license data is forecasting an increase of 14k to 139k.
Galvalume Imports (white) w/ 3 Mo. (green) & 12 Mo. Moving Average (red)

Below is September import license data through October 4th, 2021.

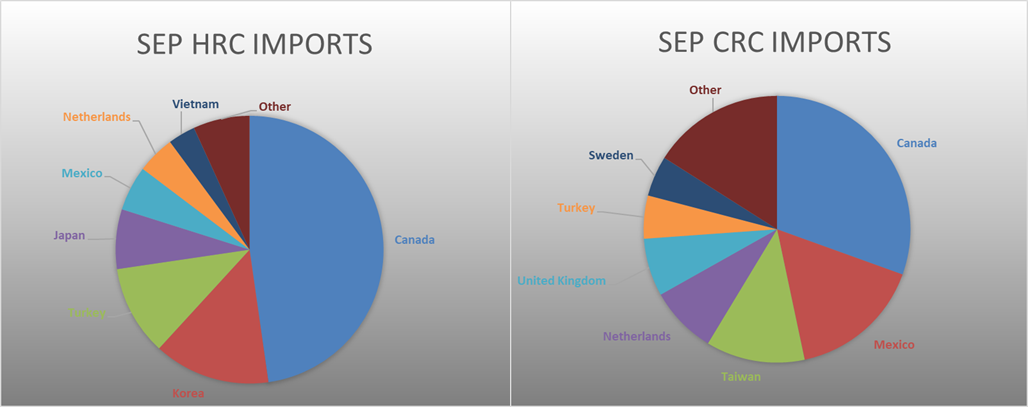

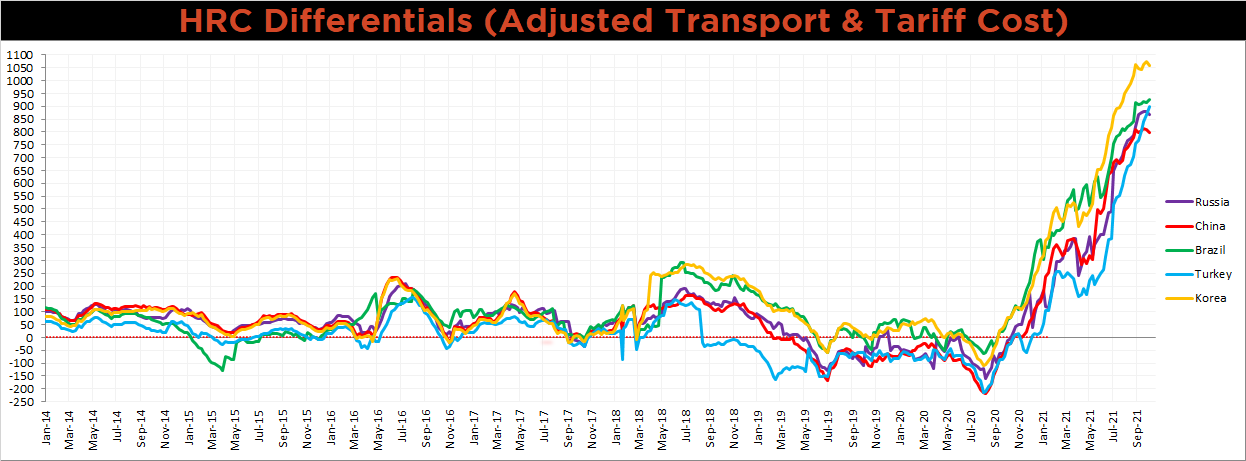
Below is the Midwest HRC price vs. each listed country’s export price using pricing from SBB Platts. We have adjusted each export price to include any tariff or transportation cost to get a comparable delivered price. Differentials decreased for Russia, China, and Korea, as their prices were slightly higher or unchanged compared to the decrease in the U.S. domestic price. The Brazilian and Turkish differentials were higher, however, as their prices fell more significantly.
SBB Platt’s HRC, CRC and HDG pricing is below. The Midwest HDG price was slightly higher, up 0.03%, while HRC & CRC were down slightly, 0.5%, and 0.2%, respectively. Outside of the U.S., the Turkish HRC export price was down 4%.


Raw Materials
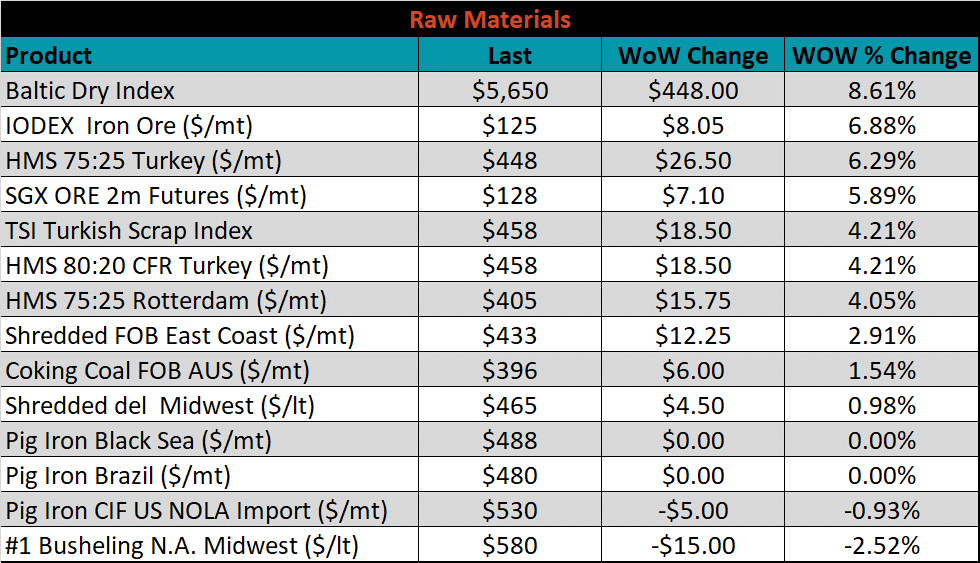
Raw material prices were mostly higher, led by the IODEX iron ore index, up another 6.9%, while Midwest busheling settled down 2.5% for the month.
Below is the iron ore future curve with Friday’s settlements in orange, and the prior week’s settlements in green. Last week, the entire curve jumped higher again, for the 3rd week in a row.
SGX Iron Ore Futures Curve

The ex-flat rolled prices are listed below.


Energy
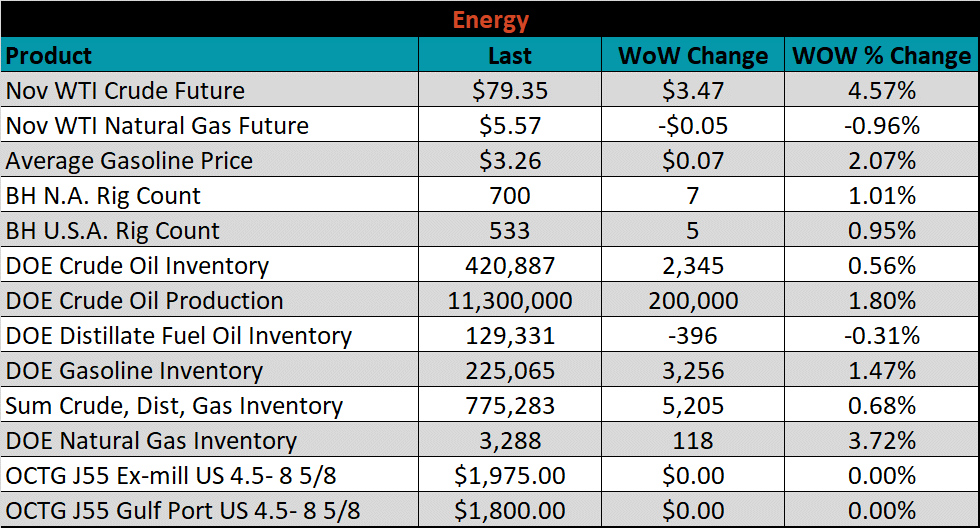
Last week, the November WTI crude oil future was up another $3.47 or 4.6% to $79.35/bbl. The aggregate inventory level was up 0.7%, while crude oil production increased to 11.3m bbl/day. The Baker Hughes North American rig count was up another 7 rigs, and the U.S. rig count was up 5 rigs.
November WTI Crude Oil Futures (orange) vs. Aggregate Energy Inventory (white)

Front Month WTI Crude Oil Future (orange) and Baker Hughes N.A. Rig Count (white)


The list below details some upside and downside risks relevant to the steel industry. The bolded ones are occurring or highly likely.
Upside Risks:
- Inventory at end users and service centers below normal operational levels
- Higher share of discretionary income allocated to goods from steel intensive industries
- Changes in China’s policies regarding ferrous markets, including production cuts and exports
- Unplanned & extended planned outages, including operational issues leaving mills behind
- Energy & construction industry rebound
- Prolonged 2022 contract negotiations creating availability concerns in the short term
- Easing labor and supply chain constraints allowing increased manufacturing activity
- Mills extending outages/taking down capacity to keep prices elevated
- Global supply chains and logistics restraints causing regional shortages
- A weakening US Dollar
- Fiscal policy measures including a new stimulus and/or infrastructure package
- Fluctuating auto production, pushing steel demand out into the future
- Low interest rates
- Threat of further protectionist trade policies muting imports
- Unexpected and sustained inflation
Downside Risks:
- Increased domestic production capacity
- Increasing price differentials and hedging opportunities leading to sustained higher imports
- Steel consumers substitute to lower cost alternatives
- Steel buyers and consumers “double ordering” to more than cover steel needs
- Tightening credit markets, as elevated prices push total costs to credit caps
- Supply chain disruptions allowing producers to catch up on orders
- Limited desire to restock at elevated prices, causing a “Buyer’s Strike”
- Reduction and/or removal of domestic trade barriers
- Political & geopolitical uncertainty
- Chinese restrictions in property market
- Unexpected sharp China RMB devaluation

